Bulls are going wild. Is a pullback an opportunity?The gold market has recently demonstrated a strong, one-sided upward trend. Gold prices surged again on Tuesday, reaching a new all-time high, confirming the bulls' absolute dominance. The early Asian session low has become a key intraday turning point. As long as prices hold above this level, the short-term bullish trend will persist. Trading strategies should prioritize buying on dips.
Analysis of multiple technical charts indicates a bullish trend. The monthly chart indicates a solid long-term uptrend; the weekly and daily charts are also trading above key support levels, providing support for a medium-term upward trend. The four-hour chart is particularly crucial. After effectively breaking through resistance last Friday, short-term bullish momentum is strong. On the whole, the strategy should continue to follow the trend. The European session should focus on entering the market at key support and resistance levels. The focus on the lower side is the 3850-3840 support line. The short-term target on the upper side can be seen in the 3890-3900 area.
Operational Strategy:
Short at 3875-3880, stop loss at 3890, profit target at 3855.
Long at 3855-3850, stop loss at 3840, target at 3880-3890.
Xauusdwave

Gold surges strongly. Bullish trend continues?The current market trend is very clear: any price pullback is a buying opportunity. Quaid advises against speculating on the top and shorting the market. The overall trend shows extremely strong bullish momentum, with continuous price increases and a vertical upward movement in the moving average system, indicating strong upward momentum and no signs of a top reversal.
The key historical support level of 3800 has become a solid foundation. The first resistance level is 3835, and the second is 3850. Quaid believes that investors should patiently wait for a pullback before continuing to buy.
It's important to note that while the uptrend is strong, strict stop-loss orders must be used for every trade to avoid large price corrections. The current trend is volatile, and once the market changes, it is easy to cause a large correction. While being bullish, one needs to be cautious.
Trading Strategy:
Buy on dips around 3810; stop loss at 3800; target profit range 3835-3850.

Bullish momentum strengthens. Trend change?Gold remained volatile before the release of the PCE data, touching around $3761 before retracing to around $3722, consistent with short-term range-bound trading. Recent significant price gains and continuous new highs have boosted bullish sentiment in the market.
However, these continuous new highs have also instilled fear and caution among many traders. Each pullback has served to build momentum for further upward breakouts. With these new highs, short-term bullish sentiment has rebounded.
Looking at the 1-hour chart, the moving average system is running upward. The early price correction touched the lower track of the Bollinger band, and then rebounded to maintain volatility. After the PCE data release, bullish momentum surged, pushing the price sharply higher, currently trading near the upper Bollinger Band. Indicators suggest that bullish strength is gradually recovering.
On the last trading day of this week, the market is likely to maintain a high-level fluctuation trend, but be wary of sudden black swan events. If the price retraces to around $3740, Quaid recommends establishing a long position at that level and waiting for a rebound.

Correction Not Enough,The Real Drop Is Yet to ComeGold began to retreat from 3778 yesterday, breaking through the key support levels of 3755, 3740 and even 3730, and hitting a low of around 3717, a drop of $60. In view of the recent continuous upward trend and the fact that it is near the 3800 mark, this is undoubtedly another heavy blow to the bulls.
From the perspective of morphological structure, gold may form a new downward trend channel with the help of high points near 3790 and 3778. If gold cannot successfully break through the 3755-3765 area during the rebound, it means that the gold downward trend channel may be successfully constructed, which will further stimulate gold to continue to decline.
As for the rising channel, gold is currently facing resistance in the 3760-3770 area. Before breaking through this area, gold bulls may still be weak. Then due to the technical resonance of the two channel resistances, it may be difficult for gold to easily break through the 3760-3770 resistance area at present.
So for short-term trading, we can start shorting gold at 3755-3765. If gold continues to rise within a limited space, we can consider adding positions.The short-term support area below is first focused on the 3740-3730 area, followed by the 3715-3705 area.

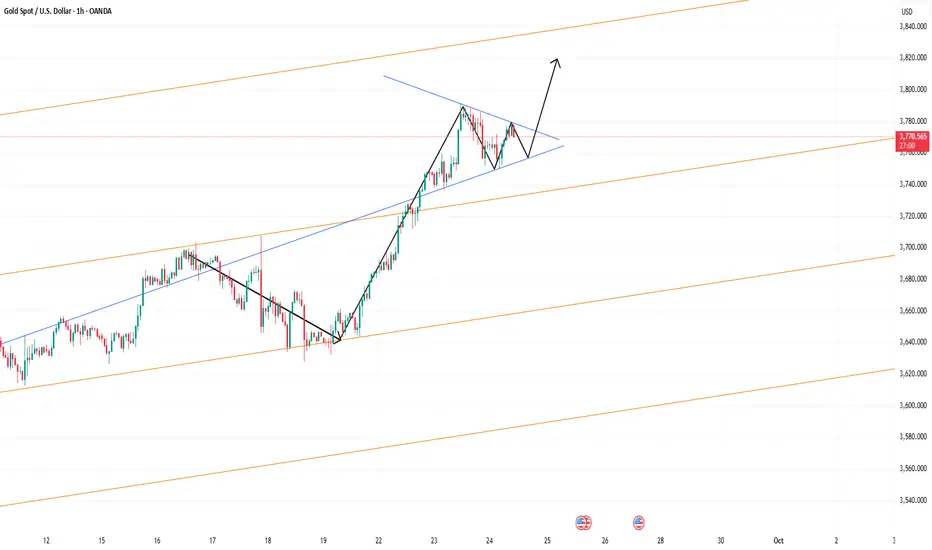
Key Battlefield: Bulls vs Bears at 3700–3800Gold fluctuated in the 3780-3750 range during the day. Although gold is still in a bullish structure overall, the short-term direction is actually not very clear due to signs of gradually weakening bullish momentum.
However, from the perspective of morphological structure, gold shows signs of forming an ascending triangle in the short term. Once the ascending triangle is successfully formed, gold will still have the potential to rise and touch 3800, or even continue to rise to the 3820-3830 area with the support of this structure. After all, gold is only slightly weak, but there is no clear signal of reaching the top at present. The premise for maintaining the ascending triangle structure is that gold cannot fall below the 3755 area; so if gold cannot effectively fall below the 3755 area next, it is expected that gold will rebound again.
However, it should be noted that once gold falls below the area near 3755, the ascending triangle structure will not hold; it also proves that the current retracement space is insufficient and gold still needs to continue to retrace, then gold may continue the retracement trend to the 3740-3730 area.
Therefore, in the current short-term trading, before gold falls below the 3755 area, we can still try to go long on gold in the 3765-3755 area; once gold falls below the area near 3755, we need to consider changing direction from long to short!

Ascending Triangle Hints at One More Push to 3800?Currently, gold is encountering resistance around 3790-3800, and the bullish momentum has slightly weakened, but the overall pattern is still bullish. Moreover, judging from the two recent pullbacks, although the bears were given the opportunity to escape from the predicament, they were supported near 3750 and rebounded many times. The strong buying support below greatly limited the retracement space.
Gold has formed an ascending triangle structure in the short term. If this structure is valid, then gold as a whole may still hit 3800, or even continue the upward trend to the 3820-3830 area, which is also the upward limit area I mentioned earlier; but this condition must be established under the premise that gold cannot fall below the 3760-3750 area during the short-term retracement.
Therefore, it is clear that the short-term structural support of gold is located in the 3760-3750 area, and the further strong support below is located in the area around 3730. At present, gold is in the ascending triangle structural resistance area of 3775-3785, so there is still a chance of a pullback in the short term.
Therefore, for short-term trading:
1. For the time being, consider shorting gold in the 3775-3785 area, with a retracement target of 3765-3755.
2. Once gold retraces to the 3765-3755 area, consider going long on gold based on market fluctuations and structural support.
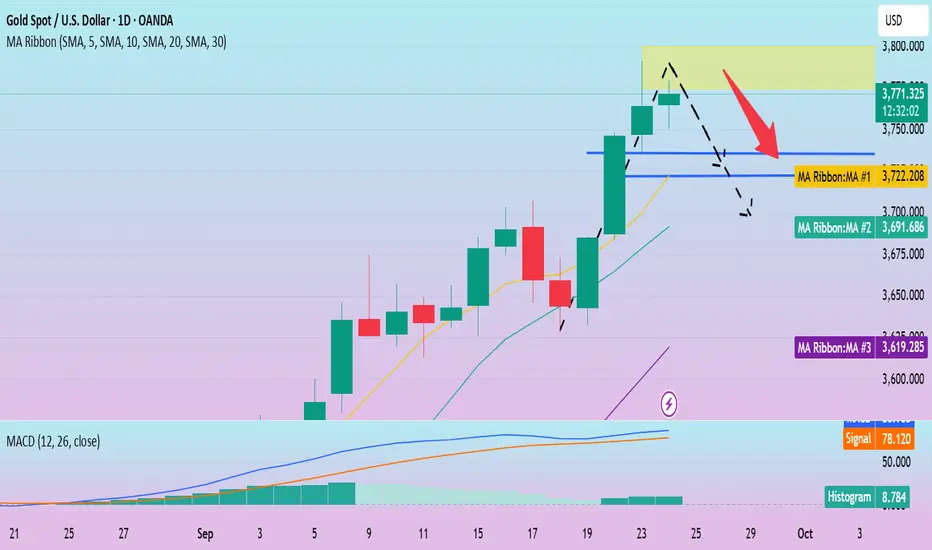
Warning: Risk of a Price Pullback?Gold continued its upward trend on Tuesday, achieving its sixth consecutive weekly gain and breaking through new highs. The core driver of this significant rally is growing dovish market expectations for further Federal Reserve easing before the end of the year. Although the September rate cut has been priced in by the market, most investors predict two more rate cuts in October and December, providing strong support for gold prices.
From a technical perspective, the daily chart shows that gold is extremely strong, and the MACD indicator confirms the short-term bullish trend, but the indicator has deviated seriously and entered the overbought area, suggesting that there is a greater risk of technical correction in the later period. Focus on the support provided by the MA5 moving average below; a break below could trigger a deeper correction.
Traditionally, caution is advised. Short positions can be taken at highs with a small position. Upper resistance is expected to be in the 3790-3800 range, while lower support lies in the 3750-3735 range.
Trading Strategy:
Short at 3775, add to positions upon a rebound to 3785-3790. Stop loss at 3800. Profit targets 3750-3740-3730.
Below 3670, shorting gold is still the main theme!After touching 3661, gold has repeatedly tested downwards today. However, this testing period repeatedly found support in the 3645-3640 area, failing to break further below. Judging from the current gold structure, gold as a whole shows a volatile and bearish trend. Although gold closed with long lower shadow candlesticks near 3627 and 3632 respectively, showing signs of bottoming out in the short term, it only exacerbated short-term volatility. Due to the obvious selling pressure from above, I expect that the rebound space for gold in the short term will be relatively limited.
According to the current gold structure, gold will face resistance in the 3665-3675 area in the short term. According to the current market performance, it may be difficult to break through this horizontal area easily in the short term. After all, there is considerable selling pressure from above. So for short-term trading, as long as gold remains below 3670, we can boldly short gold! However, because today is Friday and gold has failed to fall below the 3645-3640 area many times, it is best not to have too high expectations for the retracement space. Perhaps the 3655-3650 area will be a reasonable retracement target in the short term.

ANFIBO | XAUUSD on my view today??? [09.18.2025]Hello traders! It’s me, Anfibo. As usual, I’d like to share my personal view on gold OANDA:XAUUSD for today’s session.
On the H4 chart, gold continues to hold firmly within the upward channel, showing no major signs of weakness. The latest H4 candle closed as a bullish hammer with a long lower wick and a strong body, indicating aggressive buying absorption and solid reactions around the trendline.
In my view, as long as price stays above 3,620 USD, the bullish structure on H4 remains intact, and buyers still maintain control.
On H1, price is currently trading around 3,671 USD, and I expect it to retest yesterday’s FOMC gap near 3,678 – 3,680 USD. This is a sensitive area because it aligns with multiple confluences:
> Fibonacci retracement 0.618.
> Trendline confluence.
> Fair Value Gap (FVG).
Together, these factors make 3,678 – 3,680 a strong short-term resistance, worth considering for a counter-trend sell scalp setup.
Here’s my personal plan today:
>>> BUY SCALP:
ENTRY: around 3.645
SL: 3,640
TP: 3,679 – 3,690
_________________
>>> SELL Scalp
(1) ENTRY: 3,670 – 3,674
SL: 3,676
TP: 3,655 – 3,650
(2) ENTRY: 3,678 – 3,680
SL: 3,685
TP: 3,650 – 3,645
My approach remains the same: buy at strong support, sell at confluence resistance, and never take trades without clear risk management in place.
Besides technicals, don’t overlook today’s Unemployment Claims data. This release could trigger volatility and potentially break through key levels. Personally, I’ll wait for the market’s reaction to the news before committing to larger positions.
>>> Final Thoughts:
- H4 trend: still bullish above 3,620.
- H1: likely retest of resistance at 3,678 – 3,680.
- Plan: BUY around 3,645 – SELL around 3,678 – 3,680.
- Stick to risk management, and stay mindful of U.S. news flow to avoid being caught off guard.
Goodluck guys! ;)

False Break at 3700:Retreating Toward 3680-3670Currently, the highest price of gold has reached around 3699, and it is only one step away from the 3700 mark! I have to say that against the backdrop of significantly increased market expectations for interest rate cuts, the resonance of technical and news factors has pushed up gold prices. The current bullish momentum is strong, and there has been almost no obvious pullback during the rise. At this stage, most of these are tricks played by big funds, and it is actually difficult for retail investors to participate in long transactions. Therefore, at this stage, I will not rush to chase the rise in gold prices.
From an intraday perspective, gold still has the potential to hit the 3700-3710 area, so my latest trading plan is to continue shorting gold near this area. With gold bulls so strong, why I am still optimistic about a gold pullback. The main reason is that the current market is facing a critical time window. The Federal Reserve will announce its interest rate decision tomorrow, but I think the Federal Reserve may announce a 25 basis point interest rate cut in a step-by-step manner, rather than the 50 basis points expected by the market. If the rate falls far short of market expectations, gold could experience a significant pullback or even a crash. However, the sharp rise in gold prices near the Fed's rate decision suggests it may be an attempt to reserve room for further declines. In addition, based on the current trading volume, the small trading volume may not be able to support the continued upward trend of gold. It is for this reason that while I avoid chasing high gold prices, I also always remain optimistic about gold shorts.
Therefore, at this stage, I would consider shorting gold in batches based on market price performance. By effectively raising the average entry price, we can reap the first bite of the pie after gold prices fall.
However, we must note that short-term support for gold currently lies in the 3680-3670 area, with strong structural support below that at 3660-3650. Therefore, in order to lock in profits in time, these two support areas will be our primary target areas for short trading.

Bearish Pressure Mounts: Will 3600 Hold or Collapse?In the short term, gold has not been able to stand above 3655 during multiple rebounds, and even closed below 3650 at the close of last Friday. Although it is far from the level of collapse, there are obvious signs of profit-taking in some chips. As the center of gravity of gold slowly shifts, the short-term resistance area will gradually move down to the 3635-3645 area. If gold cannot break through this area during repeated fluctuations, the market's downward momentum will be further strengthened!
It should be noted that although the center of gravity of gold is gradually shifting downward, the overall bullish structure is still maintained; and against the backdrop of interest rate cut expectations, gold's retracement space should be limited before the Federal Reserve announces its interest rate decision. The first thing we need to pay attention to is the support of the recent low point of 3615-3605. Gold is likely to rebound again after testing the support of this area, and take this opportunity to try to intensify short-term volatility! However, once gold falls below the support of this area, it may continue to the 3590-3580 area.
Therefore, for short-term trading, since gold is still fluctuating in the support and resistance areas, it can be treated as regional fluctuations for the time being; but as the center of gravity of gold gradually moves downward and 3675 is expected to become a temporary high point, we can maintain the strategy of shorting at high levels as the main strategy, supplemented by the idea of going long at low levels.
1. Consider shorting gold against the resistance zone of 3635-3645, with the primary retracement target at 3620-3610.
2. If gold fails to break below the 3615-3605 area during a pullback, we could consider going long on gold, with the primary rebound target at 3630-3640.

XAUUSD/GOLD Daily Sell Projection (13.09.25)📌 Chart Overview
Pair: XAUUSD / Gold Spot vs USD
Timeframe: Daily (1D)
Projection: Sell Setup
🔹 Key Technical Zones
Major Resistance Zone
Around 3,696 – 3,680 level.
Confluence with trendline resistance.
Resistance Levels
R1: Near 3,650.
R2: Near 3,696.
Major Support Levels
S1: ~3,600.
S2: ~3,579 – 3,580.
🔹 Bearish Signals
Price has touched major resistance & trendline (marked “OBEY”).
Increase in seller dominance (demonetization of buyers visible).
Shooting Star candle pattern at resistance → indicates possible reversal.
🔹 Trade Idea
Entry: Near resistance rejection (3,680–3,696 zone).
Target: Towards 3,600 – 3,579 supports.
Stop Loss: Above major resistance / 3,696 zone.
Bias: Short-term sell projection while price respects resistance.
🔹 Special Note
Marked OBEY FVG zone (Fair Value Gap) → indicates that price is likely to fall into that area but won’t break below 3,579 support strongly unless fundamentals shift.
Overall bias: Sell from resistance, book profits at support

Bulls and Bears Poised to StrikeGold is currently fluctuating in a narrow range around 3635-3655, with no clear signs of a breakthrough. However, judging from the current structure, gold has been showing an overall volatile upward trend since it rebounded near 3615.
What needs to be paid close attention to at present is the support performance near 3635. If gold can stand firmly above 3635, it will perfectly maintain the volatile upward structure and provide the prerequisite for breaking through the short-term resistance area of 3655-3665. Once gold uses this as a basis and breaks through the 3655-3665 area, then gold is expected to set a new high again, and even hit the area near 3700.
Since the bulls are still in an advantageous position and the overall structure of the market is oscillating upward, we have no reason not to execute long trades based on the long structure. Therefore, I think that in short-term trading, we can consider going moderately long on gold in the 3640-3630 area.

Quiet Storm:Bulls vs Bears in Waiting!Under the influence of CPI and initial jobless claims data, gold rose directly to the area around 3644. The short-term rise seems exaggerated, but it did not stand firmly above 3650, and even failed to reach the intraday high of 3649. The release of bullish momentum was relatively convergent; it can be clearly seen from the short-term candlestick chart that gold showed long upper shadows many times in the short term, and the trajectory and structure began to shift downward, and tested support downward many times, which also proved that the short-selling force was gradually recovering after being suppressed.
However, gold rebounded after touching the 3620-3610 support area several times during the retracement. Although the bullish momentum has declined in the short term, the bullish structure has not been completely destroyed, so the overall structure is still controlled by the bulls, and the bullish force still has enough strength to support gold.
Overall, as the bulls become more cautious and the bears gradually recover, gold is expected to maintain high-level fluctuations in the short term, and the fluctuation range is likely to remain in the 3655-3615 area. Therefore, for short-term trading, we can strictly stick to the trading points and execute high-selling and low-buying transactions within the area.

Bulls vs Bears: Race to 3700 or 3600 ?!Currently, gold is fluctuating above the 3640 line. We can clearly see that gold has not effectively fallen below 3640 during multiple pullbacks in the short term. This proves that during the pullback period of gold, a lot of funds have entered the market, thereby pushing the gold price to fluctuate upward. However, during the upward fluctuation, gold encountered resistance and fell back in the 3655-3660 area many times, exacerbating the short-term volatility trend!
But we need to note that gold has rebounded since 3620 and formed a band-like low point structure; and it has tested 3640 many times and has not fallen below it, showing signs of forming a band-like secondary low point structure. Judging from the characteristics of the low point gradually rising, the current bullish force has a slight advantage, so short-term trading is still dominated by going long on gold.
Judging from the current structure, the short-term support area below is located in the 3635-3625 area, followed by the 3615-3605 area; and the short-term resistance is located near 3660. If gold breaks through the area near 3660 during the volatile upward process, gold may test the high point area near 3675. Once the high point near 3675 is refreshed again, it is expected to directly touch around 3700.
Therefore, it is not completely certain that gold has peaked at present, and we should not blindly chase short gold in trading; on the contrary, when gold retreats to the support area of 3635-3625, we can try to go long on gold, first aiming at the target area: 3660-3670, and once it breaks through this area, the target area will be postponed to the 3690-3700 area.

Plan 10 Sep, 2025Related Information:!!!
🎯Bets on a more aggressive policy easing by the Federal Reserve (Fed), reinforced by last Friday’s weak U.S. Nonfarm Payrolls (NFP) report, have kept the overnight U.S. Dollar rebound in check and helped revive demand for non-yielding gold. In addition, prolonged trade-related uncertainties, escalating geopolitical tensions, and political concerns in France and Japan are other factors supporting the safe-haven precious metal. This, in turn, affirms the short-term positive outlook for the commodity and suggests that any corrective pullback could be viewed as a buying opportunity.
personal opinion:!!!
🎯Gold prices are moving sideways within the 3,660–3,630 range.
Important price zone to consider : !!!
resistance zone point: 3660, 3630 zone

Intensifying Bear Grip: Can 3610–3600 Save the Bulls?Gold started to retreat from around 3675, and has now retreated to the lowest point of 3620-3610. According to the current market performance, we can clearly see that the rebound high point of gold after the retreat is gradually decreasing, and the control of the short position is further increasing. Yesterday, according to my trading model, my prediction that gold may usher in another 600pips retreat has been realized, and we have also won a big victory in the short transaction. It can be said that we have become the first echelon to reap the dividends from the short transaction. Then, will the high-rise building that the gold market has worked so hard to build collapse?
In fact, from a macroeconomic and technical perspective, gold's bullish trend remains intact, supported by expectations of rate cuts and safe-haven demand, which will, to a certain extent, limit any potential pullback.
From a capital perspective, some funds may be taking profits, but the current retracement is far from panic selling. Furthermore, as gold gradually retreats, a large amount of funds that have not yet entered the market in a timely manner may flow into the market, further pushing up gold prices.
From a technical perspective, after the pullback, the rebound high of gold has gradually moved down from 3655 to 3650 and 3640, while the retracement low has also moved down simultaneously. The current lowest has reached around 3620, and there are signs of further pullback. However, we need to note that in the short term, gold is still technically supported in the 3610-3600 area, while strong support is in the 3590-3580 area. Therefore, from a short-term perspective, the retracement space may not be sufficient, so I do not advocate shorting gold directly. On the contrary, we can wait for gold to rebound to the 3640-3650 area and then moderately consider shorting gold, because as gold gradually retreats, the 3635-3645 area has become the current short-term resistance area.
Therefore, for short-term trading, since gold has rebounded after touching 3620 many times, and is technically supported by the 3610-3600 area in the short term, we can consider starting to try to go long on gold in the 3620-3610 area; after gold rebounds to the 3635-3645 area, we can moderately consider shorting gold.

9/3: Chasing Highs Risks Traps, Selling Is SaferGood morning, everyone!
🔹 Key Support Levels:
30M chart: 3510 / 3498
1H chart: 3507 / 3480
1D chart: 3458
🔹 Key Resistance Levels:
3540–3550 / 3558–3562
🔹 Trading Outlook:
Focus primarily on short positions; avoid chasing the rally.
Light long entries may be considered near support, but profits should be taken quickly.
Yesterday, gold tested the 3500 level for the second time. After a brief pullback, bulls regained strength, pushing prices up to around 3540. Over the past week, gold has surged by nearly $200, with only minor retracements and no meaningful corrections.
At current levels, there are essentially no trapped long positions. Instead, the market is dominated by shorts under pressure and profit-taking from longs.
While prices might extend further toward 3550, I personally will not engage in such high-risk long trades. My overall strategy remains decisively bearish, with downside targets at 3460–3430.

9/1: Be Cautious Chasing Highs, Focus on SellingGood evening, everyone!
Driven by rate-cut expectations and geopolitical tensions, gold opened today with a slight pullback but held above key support, then rallied strongly to around 3490. If the 3368–3363 support remains intact during the U.S. session, a test of the 3500 level cannot be ruled out.
However, given the sharp rally and entry into historical highs, chasing the upside is not recommended. My trading bias continues to favor selling into strength.
During a correction, the 3452–3447 support zone will be crucial; holding above it keeps the bullish trend intact.
If broken, focus shifts to the 3437–3423 support area.
At the 3500 mark, strong resistance is highly likely. A pullback from this level is almost certain — the only uncertainty lies in the extent of the retracement. This presents a relatively high-probability shorting opportunity.
Trading Strategy:
Conservative traders → Focus on short positions at higher levels.
Aggressive traders → May attempt tactical longs, but above 3488, selling remains the preferred approach.
Given the heightened volatility, risk management is critical. If you need more specific guidance, feel free to leave me a message.

XAUUSD 1H – EW Bearish Scenario Hi fellow traders,
On the 1h XAUUSD chart, I am applying Elliott Wave principles to outline a potential expanding flat scenario, forming either as an X-wave or a B-wave. If this count holds, I expect another leg to the downside before the larger structure completes.
The red-shaded supply zone provides a potential rejection area, while the blue-shaded demand zone below marks where price could stabilize. Most importantly, the golden box beneath remains untested, aligning with my expectation that price will revisit this key support zone before a stronger reversal.
For this setup, my entry is positioned around the supply zone, with a Take Profit aimed at the golden box below. The Stop Loss is placed at the invalidation level, meaning the trade idea is no longer valid if price breaks above this structure.
Although the broader sentiment may lean bullish, this bearish scenario remains technically supported by Elliott Wave structure and confluence levels.
Good luck and trade safe.

Gold (XAU/USD) 21st August 2025Gold continues to trade within a critical range, where institutional footprints are leaving clear supply and demand imbalances. Today’s outlook blends the Daily (macro bias), 4H (swing structure), and 1H (execution refinement) to deliver execution-ready trading zones.
🔵 Demand Side (Buy Zones)
Primary Buy Zone: $3325 – $3332
This zone represents the highest-probability demand for bulls. On the 4H chart, a fresh bullish order block was created after a clean break of structure, and the 1H confirms liquidity sweeps of prior lows alongside a fair value gap. Momentum indicators add confluence, with RSI resetting near 40 and OBV spiking during the last rally.
Execution Plan: Buy around $3330 with stops below $3320. Targets are $3362 and $3380.
Secondary Buy Zone: $3300 – $3308
If the first demand fails, deeper liquidity pools sit near $3300. This level coincides with discount pricing of the recent impulse leg and untapped demand on the Daily chart. Equal lows and a large liquidity cluster make this zone attractive for a potential accumulation before any further rally.
Execution Plan: Buy around $3305 with stops below $3292. Targets are $3340 and $3360.
🔴 Supply Side (Sell Zones)
Primary Sell Zone (Golden Zone): $3365 – $3372
This is today’s strongest supply area and the nominated Golden Zone. A fresh 4H bearish order block, aligned with a fair value gap and liquidity above recent highs, creates a high-probability rejection point. On lower timeframes, bearish divergence on MACD and expanding ATR volatility confirm the risk of a downside move.
Execution Plan: Sell around $3368 with stops above $3378. Targets are $3342 and $3328.
Secondary Sell Zone: $3388 – $3395
Should momentum overshoot the primary supply, $3390 offers another key resistance. This area represents extreme premium pricing of the current leg and overlaps with an untested supply block. Liquidity from prior double tops rests above this zone, while RSI shows signs of overbought conditions.
Execution Plan: Sell around $3392 with stops above $3402. Targets are $3360 and $3340.
🟡 Executive Summary – Golden Zone
The Primary Sell Zone ($3365 – $3372) stands out as the highest-probability setup of the day. With strong alignment across Daily, 4H, and 1H charts, this area combines:
Fresh institutional supply,
Liquidity resting above highs,
Fair value gap imbalance,
Bearish divergence on momentum indicators.
The structure favors a controlled short with a tight invalidation point at $3378.
Plan of the Day: Short from $3368 with targets at $3342 and $3328.
Final Note: Always manage risk with discipline. Zones highlight institutional footprints, but execution must adapt to live order flow and market conditions.

Gold (XAU/USD) 4H- 20th August 2025Gold continues to trade in a bearish transitional phase after extended bullish movement. Current structure shows price reacting from premium supply zones, with liquidity resting below prior lows. This suggests short setups remain favorable, while discount levels could still attract buyers if deeper pullbacks occur.
✅ Primary Trading Levels
Primary Buy Zone – $3280 to $3288
Gold has a fresh 4H demand block aligning with a discount zone and liquidity resting under recent equal lows. A rejection here could fuel a rebound back into $3338 and potentially $3350.
Stop Loss: Below $3270
Targets: $3338 → $3350
Primary Sell Zone – $3346 to $3354
This area sits in premium territory, overlapping with a refined supply block and an unfilled imbalance. Liquidity above equal highs at $3355 makes this the most attractive level for sellers.
Stop Loss: Above $3364
Targets: $3305 → $3288
⚠️ Fallback Levels
Fallback Buy Zone: $3252 – $3260 → Targeting $3305 / $3332
Fallback Sell Zone: $3372 – $3380 → Targeting $3330 / $3305
🏆 Golden Zone of the Day
Sell Zone $3346 – $3354 is the highest-probability, institution-grade level for today. This zone aligns with liquidity above equal highs and offers the best risk-reward for shorts into downside targets.
📌 Trading Plan
Focus on short setups near $3346 – $3354
Look for confirmation: wick rejection or displacement within the zone
Manage risk tightly around liquidity shelves
📢 Conclusion:
Gold is offering a clean sell-side opportunity from premium levels, with downside targets into $3305 and $3288. Buyers may only regain control if $3280 holds firmly. For now, sellers have the upper hand.

Gold on Fire: Bulls Eye an Unrelenting Surge to 3365–3375Although gold has been weak recently, we have still achieved impressive results in gold long trading because it touched 3375 and 3358 twice during the rebound process. We have made a total profit of more than 900 pips in the long trading, which can be said to be a very successful transaction in the short term.
At present, gold maintains an overall volatile market, but in the short term, gold has never effectively fallen below the 3330-3320 area. What is more obvious is that the dense trading area below is concentrated in the 3330-3310 area, so the buying support below is strong, which greatly limits the downward space of gold; in addition, gold touched around 3358 during today's rebound, and once broke through Friday's intraday high, which to a certain extent strengthened the market bullish sentiment. Therefore, when gold retreats again, there may be more buying funds willing to enter the market.
In terms of fundamentals, the ceasefire and peace between Russia and Ukraine have not yet been settled, and the geopolitical situation remains tense; and the market's expectations for the Federal Reserve to cut interest rates are gradually strengthening. Against this background, gold still has the possibility of rising again.
Therefore, in the short term, I still prefer to trade gold long. We can consider buying gold in the 3340-3330 area, first looking at the target 3365-3375 area, and even continuing the upward trend to around 3380.
