Oil Rises 1.7% Since the Start of the Week On Geopolitical FactoOil Rises 1.7% Since the Start of the Week On Geopolitical Factors
As the XBR/USD chart shows, Brent crude trading opened this week near the $61.40 level, and by Tuesday morning the price was hovering around $61.50 (approximately +1.7%).
Oil prices are being pushed higher by geopolitical developments, including:
→ Pressure on Venezuela. President Trump stated that the United States could seize or sell oil from Venezuelan tankers that have been blocked.
→ Ukrainian attacks on ports and tankers linked to the transportation of Russian oil.
As a result, oil has gained around 5% from its seven-month low recorded on 16 December (point B), reflecting the risk premium that traders are building into the price of a barrel.
Technical Analysis of the XBR/USD Chart
Since mid-October, prices have remained in a downtrend, driven by a global increase in oil supply (analysts expect the supply surplus to persist into 2026).
At the same time:
→ price fluctuations have formed a descending channel, which was extended lower during the bearish impulse on 15–16 December;
→ at the low (B), the price failed to reach the lower boundary of the channel (a bullish signal), and then formed two bullish gaps (marked by arrows);
→ during the second gap, price moved aggressively into the upper half of the channel.
From a bullish perspective, price action suggests that buyers are currently in control, meaning traders should be prepared for a scenario in which rising geopolitical tensions push XBR/USD towards the upper boundary of the channel.
From a bearish standpoint, it is reasonable to assume that the area between the 50% and 61.8% Fibonacci retracement levels (where oil is trading today) could act as resistance following the A→B decline.
This article represents the opinion of the Companies operating under the FXOpen brand only. It is not to be construed as an offer, solicitation, or recommendation with respect to products and services provided by the Companies operating under the FXOpen brand, nor is it to be considered financial advice.
Xbrusd

XBR/USD Chart Analysis: Price Rebounds from a Seven-Week LowXBR/USD Chart Analysis: Price Rebounds from a Seven-Week Low
On 1 December, we outlined a descending channel on the XBR/USD chart and noted that the bearish trend was driven by fading geopolitical risks. Indeed, hopes for an end to the war in Ukraine—along with the possibility of sanctions on Russia being eased—acted as a bearish catalyst.
In addition, the International Energy Agency reaffirmed its forecast for a record supply surplus and highlighted that global inventories have reached a four-year high.
Under the influence of these and other factors, such as signs of a slowdown in the Chinese economy, Brent crude fell to a seven-week low at point A. However, today the XBR/USD chart shows a bullish reversal, again triggered by geopolitics, according to media reports:
→ The United States has intercepted a sanctioned Venezuelan tanker, which Caracas described as an “act of piracy”.
→ Ukraine has struck another vessel from the “shadow fleet” linked to Russia’s oil trade.
Technical Analysis of XBR/USD
From a bearish perspective:
→ the $62.60 level (where the blue trendline was broken) remains a significant resistance zone;
→ bulls failed to preserve the gains from the A→B rally, as the price sank further to the low at point C;
→ the nearest resistance lies around $61.70.
From a bullish perspective:
→ the lower boundary of the channel may continue to act as support;
→ Brent crude has rebounded convincingly after a false bearish break below the November low—an indication of a potential liquidity grab, suggesting that “smart money” may be siding with demand.
Given these factors, geopolitical tensions may intensify, potentially driving XBR/USD back towards the median of the descending channel.
This article represents the opinion of the Companies operating under the FXOpen brand only. It is not to be construed as an offer, solicitation, or recommendation with respect to products and services provided by the Companies operating under the FXOpen brand, nor is it to be considered financial advice.

XBR/USD: Geopolitics Are Once Again Driving Brent Crude PricesXBR/USD Chart Analysis: Geopolitics Are Once Again Driving Brent Crude Prices
On 21 November, we outlined a descending channel on the XBR/USD chart and noted that the bearish trend had been fuelled by easing geopolitical risks and hopes for an end to the war in Ukraine.
Ten days later, Brent crude is now trading above its late-November highs — once again driven by geopolitical developments.
Why is Oil Rising?
US President Donald Trump stated that the airspace over and around Venezuela “should be considered completely closed”. This immediately led to flight cancellations, created a de facto blockade, and raised the threat of military action in an oil-rich region. This risk premium is being priced into the current rally.
In addition, OPEC+ members have confirmed they will postpone the production increases planned for early 2026 — setting the stage for a potential supply deficit, especially if Venezuelan exports are disrupted.
XBR/USD Technical Analysis
Although there was no further downside extension, the descending channel remains valid. The downward move was met with strong buying interest (evident from the long lower wicks on candles in late November around $61.50), triggering an upward reversal from the channel’s lower boundary.
This week opened with a bullish gap, followed by a large bullish candle on the 4-hour chart — a sign of limited selling pressure and market expectations of higher prices.
However, Brent’s advance may soon stall due to nearby resistance zones:
→ around $63.90 (the 20 November high);
→ at the upper boundary of the channel.
Should sellers regain control, support may be found in the area between:
→ the channel’s median line;
→ the lower edge of the gap at $62.78.
This article represents the opinion of the Companies operating under the FXOpen brand only. It is not to be construed as an offer, solicitation, or recommendation with respect to products and services provided by the Companies operating under the FXOpen brand, nor is it to be considered financial advice.

XBR/USD Chart Analysis: Brent Crude Falls to Monthly LowXBR/USD Chart Analysis: Brent Crude Falls to Monthly Low
As the XBR/USD chart shows, today (Friday) Brent crude has dropped below $62, after rising above $64.50 as recently as Tuesday. This represents a decline of over 4% from the week’s high.
This sharp bearish movement is driven by an easing of geopolitical risks and hopes for an end to the conflict in Ukraine.
Media outlets are circulating insider reports and rumours of secret coordination between the Trump administration and Moscow on a ceasefire plan. The fall in oil prices suggests that the risk premium, which reflected fears of escalation and supply disruptions, is now being replaced by a scenario of conflict resolution, potentially including a relaxation of sanctions on Russia.
Bearish pressure is also supported by news of:
→ weakness in China’s economy, the world’s largest oil consumer;
→ rising oil inventories in US storage facilities.
Technical Analysis of XBR/USD
Since late October, oil prices have been forming a downward channel. Signs of aggressive selling include (as indicated by the arrows):
1→ a sharp drop without retracements during yesterday’s trading session;
2→ a breach of the $62.60 support level with a bearish gap.
In this context, it is reasonable to suggest that:
→ Brent crude could move towards the lower half of the channel;
→ the channel’s median may act as resistance.
Furthermore, if fundamental indicators confirm progress towards ending the war in Ukraine, the downward trend may continue. This does not rule out a scenario in which Brent tests the lower boundary of the channel, around the psychological $60 per barrel mark.
This article represents the opinion of the Companies operating under the FXOpen brand only. It is not to be construed as an offer, solicitation, or recommendation with respect to products and services provided by the Companies operating under the FXOpen brand, nor is it to be considered financial advice.

Crude oil ready for next leg! Not long ago did oil change the downtrend to an uptrend, the uptrend has had the pause it needed and now i believe we are ready for another leg up. Yesterday i shortet it down. today i took profit and im ready for the next leg.
1H chart so this will take time. I think the support zone looks strong and a push can be possible with the RSI looking good.

Oil Prices Rise on Geopolitical FactorsOil Prices Rise on Geopolitical Factors
As the XBR/USD chart shows, Brent crude opened this week’s trading around $65.70, but today the price is near $66.80 (around +1.7%).
Oil is being pushed higher by geopolitical factors, including:
→ Israel’s strike on Hamas leadership in Qatar;
→ Trump’s calls for Europe to impose tariffs on buyers of Russian oil.
It is also worth noting that over the weekend an OPEC+ meeting took place. Although the decision was made to increase production, the volumes were smaller than analysts had expected.
Technical Analysis of the XBR/USD Chart
After the surge of extreme volatility at the end of July, Brent crude price fluctuations have been forming a descending channel (shown in red), with the following developments:
→ in September the price tested the lines dividing the channel into quarters (2 September – QH test, 5 September – QL test);
→ this week’s rise in oil looks like a return to the median, where supply and demand tend to balance out (in other words, where market participants more often agree on a fair price).
From a bullish perspective:
→ the $65.00 level appears to be an important support, having already proved its strength in August and September;
→ the sequence of higher highs and lows A→B→C→D→E suggests that pullbacks have been roughly half the size of bullish impulses – a sign of strong demand.
From a bearish perspective:
→ August price action suggests that a bear flag has formed as an interim correction within the prevailing downtrend;
→ the $67.50 level may act as strong resistance, as supply forces there were able to trigger a bearish breakout of the pattern.
Taking the above into account, we could assume that Brent prices may stabilise around the median in the short term, before sliding along it downwards – unless the balance of supply and demand shifts sharply (for example, under the influence of new geopolitical factors or the release of major economic indicators).
This article represents the opinion of the Companies operating under the FXOpen brand only. It is not to be construed as an offer, solicitation, or recommendation with respect to products and services provided by the Companies operating under the FXOpen brand, nor is it to be considered financial advice.

XBR/USD Chart Analysis: Brent Crude Nears Its Lowest LevelXBR/USD Chart Analysis: Brent Crude Nears Its Lowest Level Since Early Summer
According to the XBR/USD chart, this morning (19 August) Brent crude oil price is showing bearish momentum, moving towards its lowest level since early summer (set last week). The key bearish drivers in the market include:
→ OPEC+ policy aimed at increasing production;
→ expectations that negotiations to end the war in Ukraine could lead to the lifting of sanctions on Russian oil exports, which would further expand global supply.
Technical Analysis of the XBR/USD Chart
In our analysis on 5 August, we noted that:
→ Brent crude had fallen to an important support level (marked in blue), which held throughout July;
→ a bearish breakout attempt below the blue support line was possible.
Indeed, in early August the price confirmed a bearish breakout of the blue line, accompanied by signs of rising volatility – the line subsequently reversed its role from support to resistance (as indicated by the arrows on the left-hand side of the chart).
Bears then consolidated their position, continuing to apply pressure and forming a downward channel (shown in red). The question now is whether Brent prices can continue their decline.
From a bullish perspective, there are grounds for demand to strengthen around the key support level at $65.00 (as indicated by the arrows on the right-hand side of the chart):
→ during an attempt to move lower, the chart formed a bullish harami reversal pattern;
→ this level acted as support following the bearish gap at this week’s market opening;
→ yesterday’s long lower shadow highlights aggressive buying activity.
From a bearish perspective, August’s downtrend remains intact – though it may be losing momentum. Note the RSI indicator, which is gradually leaning towards the 50 level (if bears were still firmly in control, it would remain closer to oversold territory).
This suggests that bulls may attempt to seize the initiative and challenge the upper boundary of the descending channel, seeking to offset at least part of Brent’s nearly 10% decline since late July. In this scenario, the $67.40 level – where bears previously demonstrated strong control – could become a critical test of demand resilience.
Tomorrow’s key releases could significantly influence price action: crude oil inventories (15:30 GMT+3) and the FOMC minutes (21:00 GMT+3).
This article represents the opinion of the Companies operating under the FXOpen brand only. It is not to be construed as an offer, solicitation, or recommendation with respect to products and services provided by the Companies operating under the FXOpen brand, nor is it to be considered financial advice.

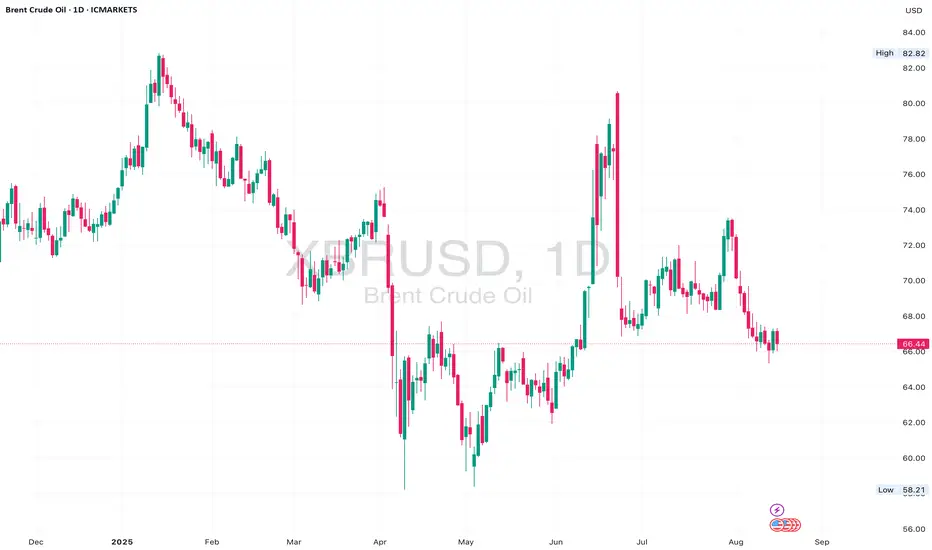
Brent Crude Squeeze – Daily Symmetrical Triangle Nears BreakoutBrent Crude has been consolidating within a symmetrical triangle on the daily chart since mid-May, following a strong bullish recovery from $58 lows. Price is now approaching the apex of the structure, suggesting a breakout is imminent.
We’re still holding above the higher low trendline support, but resistance at $71.00 remains unbroken. A decisive daily candle close outside this triangle will likely set the tone for the next leg.
A bullish breakout above $71.15 could expose $75.00 and eventually $82.00 highs. But if bears take control and break below $67.00 support, $64.00 and $58.00 reopen.
📈 Bias:
Neutral short term — Waiting for breakout confirmation.
Bullish if price breaks and retests above $71.15.
Bearish if we lose $67.00 and structure fails.
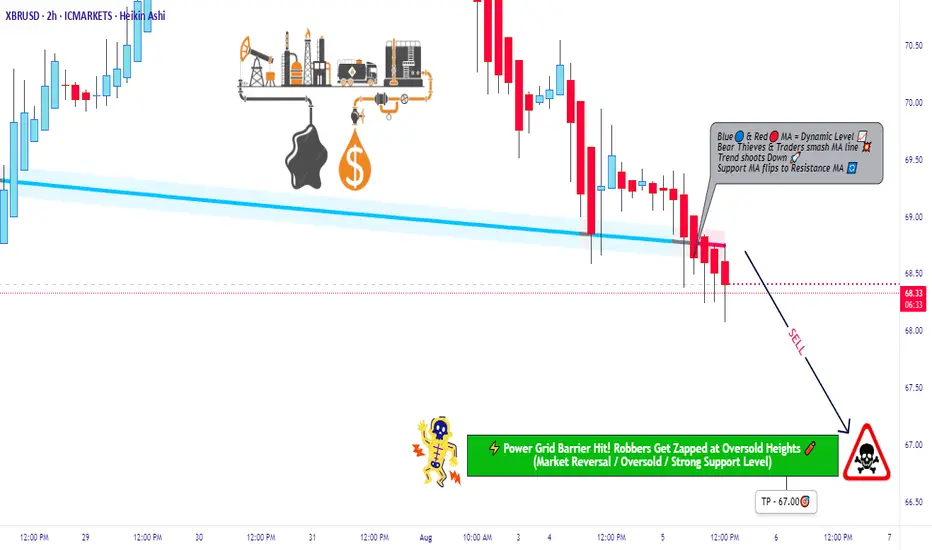
XBRUSD Robbery Setup: Thief's Bear Trap is Active! 🔥💰BRENT BEARISH HEIST PLAN💰🔥
🎯 Asset: XBRUSD / UK Oil Spot / BRENT
🧠 Strategy: Layered Limit Orders | Bearish Robbery in Progress
💼💣💼
Yo Money Movers & Market Jackers!
It’s time to load up the truck and roll out — the BRENT vault is cracked open and dripping with bearish loot! 🐻💵🔓
🎩 This isn’t just trading — this is Thief Trading Style™.
We don’t chase candles. We layer the loot, wait in the shadows, and strike on the pullback. No mercy. Just money. 💸🕶️
🚨 THIEF'S TRADE SETUP 🚨
🕵️ Entry Point:
Any Price Level – we’re everywhere.
Place layered Sell Limits like tripwires on the chart 🎯💣 — 15m or 30m candle nearest swing highs. The trap is set.
🛑 Stop Loss:
🔒 Locked @ 69.50 — right above resistance
This is a tactical retreat, not a failure. Every heist needs an escape route. 📉🔁
🎯 Target Zone:
💥 Aim for 67.00 — smash and grab style.
Get in, take profit, disappear into the shadows.
🧠 WHY THE HEIST?
The BRENT market looks ready for a rug pull —
🧊 Demand slowing
📉 Bearish structure unfolding
🎭 Bull traps getting exposed
🔥 Perfect time for thieves to cash out while the herd dreams green
Before pulling the trigger, check:
📰 Fundamentals 📦 Inventory Data 🧭 Intermarket Analysis 📊 COT Reports
Do your homework — then rob it like a professional. 🧠💼🔎
⚠️ MISSION WARNING ⚠️
Avoid new trades during news drops!
Use trailing SLs to protect loot. This market doesn’t play fair — but we don’t either. 🛑📰📉
💥 Hit BOOST if you're riding with the robbers!
Let’s show this market how Thief Traders steal gains like legends.
Every like = one more gold bar in the van 💰🚚💨
Stay sharp. Stay shadowed.
See you on the next job. 🐱👤💸📉
🔗 #Brent #XBRUSD #UKOil #ThiefTrader #BearishSetup #EnergyMarket #LayeringStrategy #MarketRobbery #SellThePump #RobTheChart
XBR/USD Chart Analysis: Oil Price Declines Towards Key SupportXBR/USD Chart Analysis: Oil Price Declines Towards Key Support
As the XBR/USD chart shows, Brent crude oil has made two significant moves recently:
Last week’s price increase (A) followed President Donald Trump’s intentions to impose tariffs on India due to its purchases of Russian oil. This could have disrupted established oil supply chains.
The price decline (B) may have been driven by both the decision of OPEC+ countries to increase production and reports of a weakening US labour market.
Thus, there is reason to believe that the more than 4.5% decline in Brent crude oil prices since the beginning of August reflects market participants’ scepticism about sustained high oil prices:
→ this has a negative impact on the US economy (JP Morgan analysts raised concerns about recession risks this week);
→ increased activity from oil producers may offset supply chain disruption risks.
Technical Analysis of the XBR/USD Chart
From a technical analysis perspective, Brent crude oil has dropped to a key support level (marked in blue), which was previously active in July. A rebound from this line could happen – in such a case, the price might face resistance at the Fair Value Gap area (marked in orange), formed between:
→ $70.81 – a support level active in late July, which was broken;
→ the psychological level of $70.00.
Attention should also be paid to price behaviour around the $69.00 level (indicated by arrows) – it quickly switched roles from support to resistance, indicating aggressive bearish sentiment. Given this observation, a potential bearish breakout attempt below the blue support line cannot be ruled out.
However, whether this scenario materialises will largely depend on developments in geopolitical risks and tariff agreements.
This article represents the opinion of the Companies operating under the FXOpen brand only. It is not to be construed as an offer, solicitation, or recommendation with respect to products and services provided by the Companies operating under the FXOpen brand, nor is it to be considered financial advice.

Oil Price Falls Below $69Oil Price Falls Below Pre-Escalation Levels of Middle East Conflict
According to the XBR/USD chart:
→ Prior to Israel’s airstrikes on Iran on 13 June, the price of Brent crude was hovering around the $69.00 mark;
→ Following US bombings in Iran, the price spiked at the Monday market open, reaching a high of approximately $77.77 (as we reported on 23 June).
However, after President Trump announced a ceasefire between Iran and Israel — later confirmed by statements from both sides — oil prices dropped sharply. This morning, Brent is trading around $68, which is even lower than the level seen before the initial strikes.
Media outlets report that analysts broadly agree that fears have eased, even if the ceasefire appears fragile. Market participants seem to view the likelihood of the conflict escalating into a full-scale ground war — involving US troops and the closure of the Strait of Hormuz — as low. Shipping through the strait is reportedly returning to normal.
Technical Analysis of the XBR/USD Chart
Interestingly, the $69 level — from which prices surged on 13 June — acted as resistance yesterday (as indicated by the arrow on the chart).
It can be assumed that the longer the ceasefire holds, the less relevant the fears that have served as bullish drivers. In that case, Brent crude prices may continue fluctuating within a downward channel, outlined in red, with the possibility of a short-term rise toward its upper boundary.
Nevertheless, the key drivers for oil prices will remain the fundamental backdrop and official statements regarding the situation in the Middle East and other geopolitical factors.
This article represents the opinion of the Companies operating under the FXOpen brand only. It is not to be construed as an offer, solicitation, or recommendation with respect to products and services provided by the Companies operating under the FXOpen brand, nor is it to be considered financial advice.

Oil Price Surges at Monday Open Amid US Strikes on IranOil Price Surges at Monday Open Amid US Strikes on Iran
As shown on the XBR/USD chart, the Brent crude oil price formed a bullish gap at the opening of financial markets this Monday, surpassing last week’s high.
Only three days ago, we drew attention to Donald Trump’s statement that a decision regarding US involvement in the Iran-Israel conflict would be made within two weeks – yet over the weekend, US aircraft dropped bombs on Iran’s nuclear facilities.
Now oil prices are likely to be affected by Iran’s potential move to block shipping traffic through the Strait of Hormuz. According to Reuters, analysts suggest that in such a scenario, the oil price could climb to $100.
Technical Analysis of the XBR/USD Chart
The ascending channel plotted last week remains valid.
The fact that the price is pulling back (as indicated by the arrow) from the high set at the market open suggests the market had already priced in a significant risk of US involvement in the Iran-Israel military conflict.
Key points:
→ Technical support in the near term may be provided by the area where the lower boundary of the blue channel intersects with the $76 level (which acted as resistance at the end of last week).
→ Ultimately, fundamental factors and official statements will play a decisive role in oil price movements. It’s worth noting that, following the strikes on its territory, Iran is threatening retaliation against the US.
This article represents the opinion of the Companies operating under the FXOpen brand only. It is not to be construed as an offer, solicitation, or recommendation with respect to products and services provided by the Companies operating under the FXOpen brand, nor is it to be considered financial advice.

XBR/USD Chart Analysis: Oil Price Falls After Trump’s DecisionXBR/USD Chart Analysis: Oil Price Falls After Trump’s Decision
As shown on the XBR/USD chart, the price of Brent crude oil has pulled back from yesterday’s 4.5-month high following a statement from the White House that President Donald Trump will make a decision within the next two weeks on whether the United States will take part in the Israel-Iran conflict.
According to Reuters, the US President is facing backlash from some members of his team over the prospect of launching a strike against Iran, which could drag the US into yet another prolonged war.
Technical Analysis of the XBR/USD Chart
From a technical standpoint, Brent crude oil price is developing within an upward channel (marked in blue), though several bearish signals are appearing on the chart:
→ a bearish gap that formed overnight;
→ a false bullish breakout (indicated by an arrow) above the $76.50 level, drawn from the 13 June high;
→ bearish divergence on the RSI indicator;
→ a break of the recent local ascending trendline (marked in orange).
Given the steep angle of the rising blue channel, it is reasonable to assume that bears may attempt to break through its lower boundary, which is currently acting as support. Whether this scenario materialises in the oil market will largely depend on developments in the Middle East.
This article represents the opinion of the Companies operating under the FXOpen brand only. It is not to be construed as an offer, solicitation, or recommendation with respect to products and services provided by the Companies operating under the FXOpen brand, nor is it to be considered financial advice.

Israel Strikes Iran. Oil and Gold Prices SurgeIsrael Strikes Iran. Oil and Gold Prices Surge
According to media reports, Israel launched a large-scale overnight strike on Iranian territory, targeting dozens of military and strategic facilities linked to the country’s nuclear programme and missile capabilities. Israeli officials justified the action by citing an existential threat from Tehran, which, according to their intelligence, is accelerating its development of nuclear weapons and expanding its arsenal of ballistic missiles.
In response, Iran has vowed severe retaliation, stating that the United States and Israel will “pay a heavy price” for the attack. US President Donald Trump has urgently convened a meeting to assess the situation.
Commodities Market Reaction
In the wake of these developments, gold — the primary safe-haven asset — surged sharply. The XAU/USD price broke above its May high, rising past $3,440. However, the all-time high near $3,498 remains intact for now.
Oil prices also spiked due to fears of supply disruption. The military conflict threatens shipping through the Strait of Hormuz, a crucial chokepoint through which one-fifth of the world’s oil supply passes. Traders quickly priced in the risk of war, anticipating a supply shortage driven by large-scale instability in the Middle East.
Technical Analysis of the XBR/USD Chart
Brent crude oil price has risen to the upper boundary of a large-scale descending channel (shown in red), which is defined by lower highs from 2024–2025. As anticipated, this upper boundary acted as resistance, with the price forming a peak above $76 before reversing downward (as illustrated by the black arrow).
From a technical standpoint, following such a sharp rally, Brent is vulnerable to a corrective move. In this scenario, a pullback into the orange zone is possible, where support may be found at:
→ The psychologically important $70 level;
→ The 50% Fibonacci retracement level;
→ The former resistance of the purple descending trendline, now turned support.
Nevertheless, given the scale of the geopolitical threat, it is unlikely that market sentiment will allow Brent to decline significantly in the near term.
This article represents the opinion of the Companies operating under the FXOpen brand only. It is not to be construed as an offer, solicitation, or recommendation with respect to products and services provided by the Companies operating under the FXOpen brand, nor is it to be considered financial advice.

XBR/USD Chart Analysis: Brent Crude Reaches 1.5-Month HighXBR/USD Chart Analysis: Brent Crude Reaches 1.5-Month High
In our analysis of Brent crude oil six days ago, we identified a large contracting triangle and a local ascending channel. We also outlined a potential scenario involving a bullish breakout above the upper boundary of the triangle.
Although this was not the base-case scenario, the XBR/USD chart now suggests it has played out: yesterday, the price climbed to nearly $67 per barrel — its highest level since the end of April.
The main bullish catalyst appears to be ongoing trade talks between the United States and China, which have raised hopes of a resolution to tariff-related tensions between the world’s two largest economies.
At the same time, rising oil prices may exacerbate geopolitical tensions, particularly amid Israeli threats to strike ports in Yemen — a risk that could disrupt supply chains across the Middle East.
Technical Analysis of the XBR/USD Chart
From a technical perspective:
→ Brent crude continues to move within an ascending channel (marked in blue);
→ the upper boundary may now act as a support level.
The fact that the price is holding in the upper half of the channel indicates strong demand-side pressure. Based on this, it is reasonable to assume that as long as Brent remains above the $65.75 level (the retest zone of the breakout), the technical outlook will remain predominantly bullish.
This article represents the opinion of the Companies operating under the FXOpen brand only. It is not to be construed as an offer, solicitation, or recommendation with respect to products and services provided by the Companies operating under the FXOpen brand, nor is it to be considered financial advice.
XBR/USD Chart Analysis: Oil Price Rises to Key ResistanceXBR/USD Chart Analysis: Oil Price Rises to Key Resistance
Yesterday, the price of Brent crude climbed above $65.60 — the highest level in over a week.
According to media reports, several bullish factors are driving this move:
→ Stalled negotiations between the US and Iran over abandoning Iran’s nuclear programme in exchange for lifting oil export sanctions;
→ Wildfires in Canada, which have significantly reduced oil output;
→ Market reaction to the OPEC+ meeting held over the weekend;
→ A weakening US dollar.
Technical Analysis of the XBR/USD Chart
From a technical standpoint, Brent crude oil:
→ Has been forming a short-term ascending channel (marked in blue) since the beginning of the week;
→ Has approached a major resistance level.
This resistance is defined by the upper boundary of a narrowing triangle, with its central axis around the $63.70 level — a price that could be considered a fair value based on trading over the past one and a half months.
This situation points to two possible scenarios:
→ A downward reversal from the key resistance, with expectations that the price will return to the triangle’s central axis. A break below the lower boundary of the local blue channel would support this scenario.
→ An attempt at a bullish breakout of the triangle. While this scenario cannot be ruled out, it appears less likely due to the global economic slowdown risks posed by tariff-related trade barriers.
This article represents the opinion of the Companies operating under the FXOpen brand only. It is not to be construed as an offer, solicitation, or recommendation with respect to products and services provided by the Companies operating under the FXOpen brand, nor is it to be considered financial advice.

Oil Prices Surge Amid Threat of Strike on IranOil Prices Surge Amid Threat of Strike on Iran
As shown on today’s XBR/USD chart, Brent crude oil prices have jumped (as indicated by the arrow) to a one-week high. This surge follows U.S. intelligence reports suggesting that Israel may be preparing to strike Iran’s nuclear facilities.
Although CNN, citing officials, noted that it remains unclear whether Israeli leaders have made a final decision, oil prices are rising as markets price in the risk of escalation disrupting Middle Eastern oil supply chains:
→ Iran is the third-largest oil producer within OPEC.
→ There is concern that Iran could retaliate by blocking the Strait of Hormuz in the Persian Gulf — a key shipping route used by Saudi Arabia, Kuwait, and others to export oil products.
Technical Analysis of XBR/USD
Brent crude oil price has climbed towards the descending trendline (marked in black), drawn through key highs from April and mid-May. From a bearish perspective, this key resistance could trigger a downward pullback.
On the other hand, recent price action in Brent suggests upward momentum (indicated by blue lines), with the $65.20 level — previously a cap — potentially turning into support after a breakout.
Whether the black resistance line is broken will largely depend on geopolitical developments. It is possible that reports of an imminent missile strike on Iran may later be refuted.
This article represents the opinion of the Companies operating under the FXOpen brand only. It is not to be construed as an offer, solicitation, or recommendation with respect to products and services provided by the Companies operating under the FXOpen brand, nor is it to be considered financial advice.

XBRUSD Brent Oil Loot: Ride the Bullish Breakout Wave!🌎 Yo, Treasure Hunters! Aloha! Hola! Grüß dich! 🌟
Profit Plunderers, ready to strike? 🤑💸⚡
Forged with 🔥Outlaw Oracle tactics🔥 (technical + fundamental), here’s our slick plot to loot the "XBRUSD / Brent Oil" Energy Market. Stick to the chart’s path for a long entry, eyeing an exit near the risky YELLOW MA Zone. Beware—overbought vibes, consolidation, or a trend switch could snare you where bearish rogues prowl! 🏴☠️💰 "Grab your gains and party, traders—you’ve nailed it! 🎉💪"
Entry 📈: "The safe’s cracking! Watch for the MA breakout (67.50), then pounce—bullish bounty awaits!"
Hot tip: Place buy stop orders above the Moving Average or set buy limit orders at the recent 15/30-min swing low/high for pullback plays.
📢 Pop an "alert" on your chart to seize the breakout!
Stop Loss 🛑: "📣 Oi, listen up! 🗣️ If you’re jumping in with buy stop orders, don’t set that stop loss ‘til the breakout ignites 🚀. Follow my pin 📍 or take a wild shot 😜—but don’t cry if it backfires! ⚠️"
📍 Outlaw SL parked at the recent 3H swing low (63.00) for swing trades.
📍 Tweak SL based on your risk, lot size, and order stack.
Target 🎯: 72.50 or slip out before the goalpost.
🧲 Scalpers, heads up 👀: Play long-side scalps only. Deep pockets can dive in; smaller crews, tag along with swing traders for the heist. Use trailing SL to guard your stash 💰.
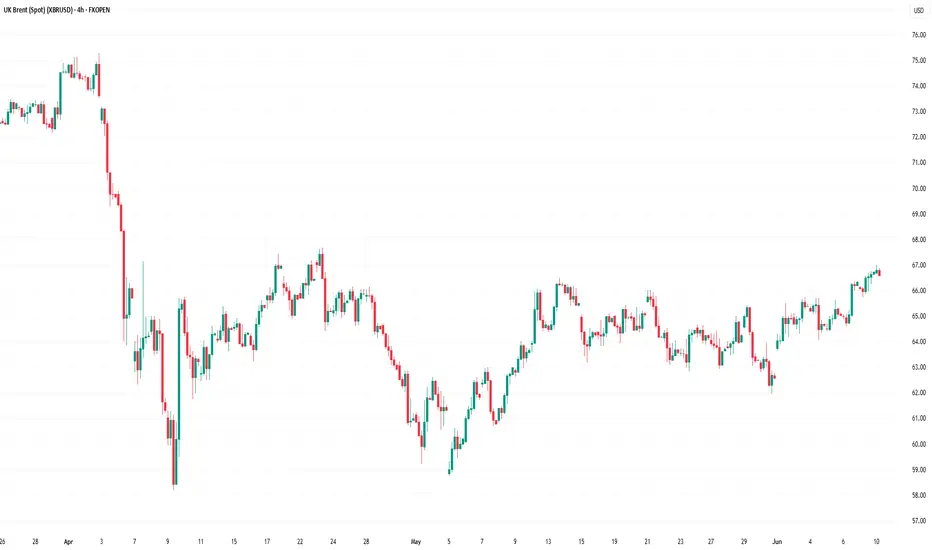
💸 UK Oil Spot / Brent Swing Trade Plot: Bullish fever 🐂 is roaring, sparked by key forces. ☝
📰 Dig In: Scope out Fundamentals, Macro Signals, COT Reports, Seasonal Trends, Intermarket Clues, Inventory Stats, and Future Targets 👉🔗
⚠️ Trading Alert: News & Position Savvy 🗞️ 🚨
News bombs can rattle prices and volatility. To lock in your loot:
- Dodge new trades during news drops.
- Slide trailing stops to pocket profits.
💖 Power our raid! 💥Smash the Boost Button💥 to supercharge our profit grab. Roll with the Outlaw Trading Posse, raking in wins daily with swagger! 🏆🤝🎉
Catch you at the next heist—stay locked in! 🤑🐱👤🚀
---
### Real-Time Data (UTC+1, May 14, 2025) 📊
**Brent Oil (XBRUSD)**:
- **Price**: ~$67.20 (based on latest market feeds).
- **MA Breakout Level**: ~$67.50 (as per strategy).
- **Stop Loss Level**: ~$63.00 (3H swing low).
- **Target**: $72.50.
- **Market Sentiment**: Bullish 🐂, fueled by shrinking inventories and geopolitical noise.
**Latest COT Data (Friday, May 9, 2025)**:
- **Commercial Hedgers**: Net long positions rose 4% in Brent futures, backing bullish momentum.
- **Large Speculators**: Net long but scaling back slightly, wary of overbought signals.
- **Data Source**: CFTC Commitment of Traders report.
**Key Fundamental Drivers**:
- **Inventory**: ICE Brent data shows -1.8M barrel draw last week, bolstering prices.
- **Geopolitical**: Ongoing Middle East supply risks keep markets edgy.
- **Seasonal**: Rising summer demand forecasts add tailwinds.
🔔 **Note**: Watch for API inventory data (late May 14, 2025) and OPEC updates for potential volatility.
---
💥 Hit that Boost and let’s ransack the Brent market together! 🚀
💖 Fuel our heist! 💥Tap the Boost Button💥 to power up our profit raid. Join the Bandit Trading Crew, snatching wins daily with ease! 🏆🤝🎉 Stay sharp for the next caper—see you soon! 🤑🐱👤🚀

Brent Crude Opens with a Bearish GapBrent Crude Opens with a Bearish Gap
As shown on the XBR/USD chart, Brent crude oil opened this Monday morning around $59.00, forming a bearish gap relative to Friday’s closing price of approximately $61.40.
The current Brent crude oil price is near the yearly low reached about a month ago, following the announcement of Trump’s tariffs, which turned out to be significantly higher than expected.
Why Is Oil Falling?
As we noted on 30 April, market participants are closely watching news related to OPEC+. Over the weekend, during an online meeting (according to media reports), the following developments occurred:
→ It was stated that the current oil market is fundamentally healthy;
→ A decision was made to accelerate the pace of oil production increases.
According to the plan, output will rise by 411,000 barrels per day — with some believing this move is partly due to certain OPEC+ countries previously failing to adhere to production quotas.
Technical Analysis of the XBR/USD Chart
Oil price movements in 2025 form a descending channel (shown in red), with progressively lower highs and lows indicating bearish sentiment.
Although bulls may hope that the lower boundary of the channel could act as support, bears are showing signs of dominance (as indicated by arrows):
→ the median line of the channel previously acted as resistance;
→ now, similar behaviour is seen at line Q, which divides the lower half of the channel into two quarters;
→ the Rounding Top pattern also signals strong selling pressure.
Fundamentally, oil prices are supported by China’s willingness to negotiate tariffs with the US. However, considering the OPEC+ decision and ongoing fears of a global recession, the current downward channel on the Brent crude oil price chart is unlikely to lose relevance any time soon.
This article represents the opinion of the Companies operating under the FXOpen brand only. It is not to be construed as an offer, solicitation, or recommendation with respect to products and services provided by the Companies operating under the FXOpen brand, nor is it to be considered financial advice.

Brent Crude Price Continues to FallBrent Crude Price Continues to Fall
Today, the price of Brent crude has dropped below $60 per barrel, marking its lowest level since March 2021. As shown on the XBR/USD chart, from the start of 2025, the price saw a rise of around 2.6% at the end of March 2025.
Why is oil falling?
The key driver is the escalation of the trade war. Yesterday, the US President announced the imposition of additional tariffs on trade with China, bringing the total to 104%.
The decline in Brent prices seems to reflect traders' concerns about the risks of a global recession.
Oil price forecasts for 2025 and 2026
Yesterday, analysts at Goldman Sachs released their oil price forecasts for Brent and WTI crude. They expect prices to reach $62 per barrel for Brent and $58 for WTI by December 2025. By December 2026, they anticipate a further decline to $55 and $51, respectively. However, analysts caveat that these forecasts are based on the assumption that the US will avoid a recession and that OPEC+ countries will increase their supplies.
In the event of a global economic slowdown, Brent prices could drop to $40 by the end of 2026.
Technical analysis of the XBR/USD chart today
The sharp decline in Brent prices has resulted in a forceful breach of key lows from 2024 and 2025 around the $68.68 level.
Additionally, the XBR/USD chart shows that the price continues to follow a downward channel (indicated in red), with the following levels acting as resistance (marked by arrows):
→ The upper boundary of the channel;
→ Its median (previously acting as support) – indicating the dominance of supply forces.
It is possible that the lower boundary of the channel, strengthened by the psychological level of $60.00, will provide support, slowing the bearish progress of Brent prices. However, the key factor will undoubtedly be the news flow, with sharp statements from the White House.
Traders are focusing on how China will react to the 104% tariffs announced by Donald Trump. As Reuters reports, the President stated yesterday, "We have many countries coming to us wanting to make deals," adding that he expects China to also seek an agreement.
This article represents the opinion of the Companies operating under the FXOpen brand only. It is not to be construed as an offer, solicitation, or recommendation with respect to products and services provided by the Companies operating under the FXOpen brand, nor is it to be considered financial advice.

XBR/USD Analysis: Price Near Resistance ZoneXBR/USD Analysis: Price Near Resistance Zone
As seen on the XBR/USD chart, Brent crude oil prices are hovering near last week’s highs this morning as market participants assess various influencing factors, including:
→ New U.S. sanctions on Iran, which are limiting its export capacity and tightening global supply, particularly to China.
→ Ongoing negotiations between the U.S., Ukraine, and Russia in Saudi Arabia, which could potentially lead to increased Russian oil exports.
→ OPEC+ plans to raise oil production starting in April.
Technical Analysis of XBR/USD
From a technical perspective, Brent crude oil is trading near a key resistance zone, which consists of:
→ A bearish Fair Value Gap (highlighted in purple).
→ The upper boundary of the descending channel.
→ The upper boundary of a narrowing triangle (shown in black), which can be interpreted as a Rising Wedge pattern.
The Rising Wedge may represent a corrective rebound within a broader bearish trend. If buyers fail to break through this resistance zone, Brent crude prices could resume their downtrend within the red channel.
This article represents the opinion of the Companies operating under the FXOpen brand only. It is not to be construed as an offer, solicitation, or recommendation with respect to products and services provided by the Companies operating under the FXOpen brand, nor is it to be considered financial advice.
Brent Crude Price Breaks Key Support LevelBrent Crude Price Breaks Key Support Level
Today, Brent crude is sliding towards the psychological $70 per barrel mark, with the XBR/USD chart showing a break below a key support level (marked in blue) that had been holding since autumn last year.
Why Is Brent Crude Falling?
The bearish sentiment in the market is driven by OPEC+’s decision to increase oil production, contrary to analysts’ expectations that existing output cuts—designed to support prices—would remain in place.
According to the Wall Street Journal, analysts now predict:
→ Oil production will rise by 137,000 barrels per day from April 2025 to September 2026.
→ Brent crude may drop below $70 per barrel.
Technical Analysis of XBR/USD
From a long-term perspective, Brent crude is forming a descending channel (marked in red), connecting the April and July 2024 peaks. The break below this support level could signal a renewed downtrend following a prolonged period of consolidation.
If XBR/USD sees a short-term recovery from its yearly lows, key resistance levels to watch include:
→ The midline of the descending channel.
→ The former support level (marked in blue).
Trade on TradingView with FXOpen. Consider opening an account and access over 700 markets with tight spreads from 0.0 pips and low commissions from $1.50 per lot.
This article represents the opinion of the Companies operating under the FXOpen brand only. It is not to be construed as an offer, solicitation, or recommendation with respect to products and services provided by the Companies operating under the FXOpen brand, nor is it to be considered financial advice.

Brent Crude Price Drops After Trump’s Call with PutinBrent Crude Price Drops After Trump’s Call with Putin
According to the XBR/USD chart, the price of Brent crude oil fell by more than 2% in a single day. This decline followed an announcement by US President Trump that he had spoken with Russian President Putin, discussing various global issues, including the war in Ukraine.
As reported by Reuters, this has raised expectations that a potential peace agreement between Ukraine and Russia could involve lifting sanctions, which have disrupted global oil supply flows.
Technical Analysis of XBR/USD
On 7 February, we highlighted key support at $74. Since then, the price has risen (as indicated by the arrow) to $77, which has confirmed its role as resistance.
Brent crude price movements outline a descending channel (marked in blue), with:
→ Bullish perspective: The $74 level may still act as support.
→ Bearish perspective: The $75.50–$75.80 zone, where sellers have shown dominance, could challenge bulls attempting to push prices into the upper half of the channel.
Rising US oil inventories, the prospect of increased production under President Trump, and expectations of sanctions on Russia being lifted could all contribute to Brent crude revisiting its 2025 lows.
Trade on TradingView with FXOpen. Consider opening an account and access over 700 markets with tight spreads from 0.0 pips and low commissions from $1.50 per lot.
This article represents the opinion of the Companies operating under the FXOpen brand only. It is not to be construed as an offer, solicitation, or recommendation with respect to products and services provided by the Companies operating under the FXOpen brand, nor is it to be considered financial advice.
