There is a possibility for the beginning of an uptrend in XMRBTCMidterm forecast:
While the price is above the support 0.01185, beginning of uptrend is expected.
We make sure when the resistance at 0.01395 breaks.
If the support at 0.01185 is broken, the short-term forecast -beginning of uptrend- will be invalid.
Technical analysis:
While the RSI uptrend #1 is not broken, bullish wave in price would continue.
Price is below WEMA21, if price rises more, this line can act as dynamic resistance against more gains.
Relative strength index (RSI) is 48.
Trading suggestion:
. There is a possibility of temporary retracement to suggested support zone (0.01255000 to 0.01185000). if so, traders can set orders based on Price Action and expect to reach short-term targets.
Beginning of entry zone (0.01255000)
Ending of entry zone (0.01185000)
Entry signal:
Signal to enter the market occurs when the price comes to " Buy zone " then forms one of the reversal patterns, whether " Bullish Engulfing ", " Hammer " or " Valley " in other words,
NO entry signal when the price comes to the zone BUT after any of the reversal patterns is formed in the zone.
To learn more about " Entry signal " and the special version of our " Price Action " strategy FOLLOW our lessons:
Take Profits:
TP1= @ 0.01395
TP2= @ 0.01580
TP3= @ 0.01710
TP4= @ 0.01900
TP5= @ 0.02040
TP6= @ 0.02300
TP7= @ 0.02565
TP8= @ 0.03420
TP9= Free
XMRBTC

Daily Bullish Signal $XMR #XMR (3 March 2019)RED ARROW indicates the EXPECTED Time and Targets
Level Stoploss point up to maximize profit and reduce risk
I'm working all the time, even in Bearish Market

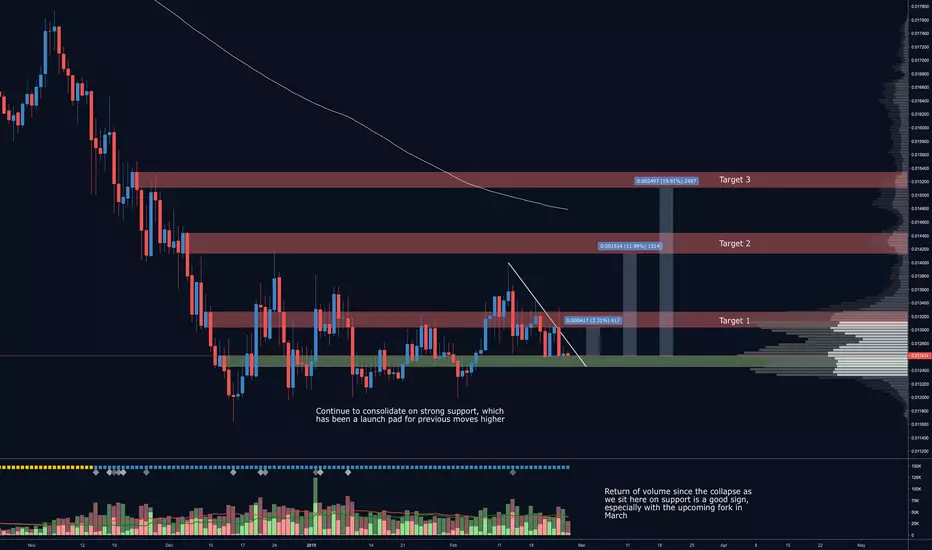
XMR consolidating before retest of highs! XMR continues to consolidate on strong support and possible move higher before fork in March looking more and more likely
Thanks guys!
A trading opportunity to buy in XMRBTCTechnical analysis:
. Monero/Bitcoin is in a range bound and the beginning of uptrend is expected.
.The price is below the 21-Day WEMA which acts as a dynamic resistance.
. The RSI is at 49.
Trading suggestion:
. There is a possibility of temporary retracement to suggested support zone (0.01279700 to 0.01210440). if so, traders can set orders based on Price Action and expect to reach short-term targets.
Beginning of entry zone (0.01279700)
Ending of entry zone (0.01210440)
Entry signal:
Signal to enter the market occurs when the price comes to "Buy zone" then forms one of the reversal patterns, whether "Bullish Engulfing" , "Hammer" or "Valley" in other words,
NO entry signal when the price comes to the zone BUT after any of the reversal patterns is formed in the zone.
To learn more about "Entry signal" and the special version of our "Price Action" strategy FOLLOW our lessons:
Take Profits:
TP1= @ 0.01388900
TP2= @ 0.01479200
TP3= @ 0.01552700
TP4= @ 0.01632840
TP5= @ 0.01753490
TP6= @ 0.01922380
TP7= @ 0.02157680
TP8= @ 0.02393000
TP9= @ 0.02574855
TP10= @ 0.03152420
TP11= Free

XMR posiblemente rebotará una vez más en su soporte.XMR viene desde hace varios días y semanas corriendo en un canal muy amplio en lo que parece una etapa de acumulación. Ya días atrás, nos dio un buen rendimiento en un trade a corto plazo. Parece que va a seguir el mismo patrón. Si llegara a fallar parece que seguirá el canal y eventualmente podemos recuperarnos o bien hacer otra compra más baja promediando nuestro valor de costo.
Estamos buscando comprar a 0.01281.
COMPRA ~ 0.01281
VENTA* ~ 0.013248 - 0.01344000
GANANCIA APROX ~ 3.5% - 5%
¿Quiere profundizar más en el análisis? ¿Desea conversar u obtener más ayuda? Comente aquí o mejor aún subscríbanse a la comunidad Privada “3C Plus”.
Envié un correo a crypto@3cservices.co
————————————
Síganos en redes sociales:
Twitter: twitter.com
Instagram: www.instagram.com
Facebook: www.facebook.com
Youtube: go2l.ink/3cyoutube
————————————


Buy the bottom.Weekly 200 EMA hold the price.
Price breaks the Triangle and going to re-test the upper trend line.


MoneroXMRBTC touched bottom and now formed triangle with potential break out resistance line. Targets next fibonacci levels

Eyes on long-term XMRBoth USD and BTC price reaching areas of possible reversal on long-term weekly charts. Posed for potential breakouts at the bottoms of downwards wedges in both charts. Bullish divergence has appeared for the last two lows on both MACDs. RSI is not showing bullish divergence but has recently touched and rebounded slightly from oversold areas, also posed to breakout through resistance in downwards wedge formations.
A corrective bounce to either of the last fib lines suggest possible XMRBTC targets of 0.016 (+20%) and 0.020 (+50%), with possible XMRUSD target of $130 (+245%).

Monero ($XMR) - simple buy and sell. Green - buy. Red - sell.
I do not recommend using this chart for margin trading.
It's not a financial advice.
Trade carefully and good luck!

It Is That Time Of The Year Again For XMR/BTC (MONERO) Hello, in this post I will share boh my Analysis and Strategy on XMR/BTC (Monero).
Monero is the top 13 coins in terms of marketcap, used to be in the top 8, lost 90% in value since last ATH, and is I believe undervalued right now.
This said Monero's price is indexed on Bitcoin, and tends to behave nicely when Bitcoin shows some green. So this might be wise to wait a little before entering a position on XMR.
Here is my latest analysis on Bitcoin, that I will keep updated.
I was looking for a coin to trade with my Automated Strategy on Binance, and Monero looks like having a huge space for a move up. Indeed I prefer to not use leverage or short for now, since I'm not an expert, so I use a simple Buy and Sell Strategy.
I backtested my Strategy Crypto Trader 1H ( results below ) and found a configuration for my bot. The idea is to outperform Buy & Hold ( grey line). Next signal will be a Buy, I will keep you updated.

XMRBTC - what next movement? - price analysis?hello guys, as per analysis we found symmetrical triangle and can be traded for profit. We drawn some targets as per pattern and resistance.
trader can trade now inside patttern but for safe trade wait for pattern breakout. We will update the chart as per changes.
Stop loss recommended

Will this Bullish Break Lead to the End of the Bear ?? LONG XMRMaybe this is an ending triangle? RSI has come to life breaking through 40 and holding on a couple tests setting up this price triangle. ADX is reset and ready for a new trend. Is this the end of the bear for XMRBTC?


Monero (XMR) - A little more downside before recovery?Not financial advise. Do your own research. The ideas shared here are the personal opinions of the BitDoctor team. Trade at your risk.
I'll keep this one a little short and sweet. There is potential that XMR has bottomed out but with the overall sentiment of the market, it wouldn't surprise me to see one more push down before recovery.
Don't get me wrong, these prices are steals but with the formation I see at the present moment (it's a little difficult to see on the 3 Day chart) shows one more push down, putting us at approximately .0090 or .0091 but I expect this to spring like no other so if I was a betting man, I would set some orders around there in case there's a wick down in that general area. According to bitfinex, that would put the XMRBTC level lower than it ever has been. .0093 is basically the all time low.
Will it get there? Only time will tell but I would say we've got about a week... two weeks tops, before we get that spring. Once the pivot occurs, I can see us reaching .02 as the first take-profit level. I'm not sure I would be targeting .03 or .035 anytime soon.

BUY XMRI think XMR will grow soon.
Breakout traders should buy after breakout.
Agresive traders can buy now.

