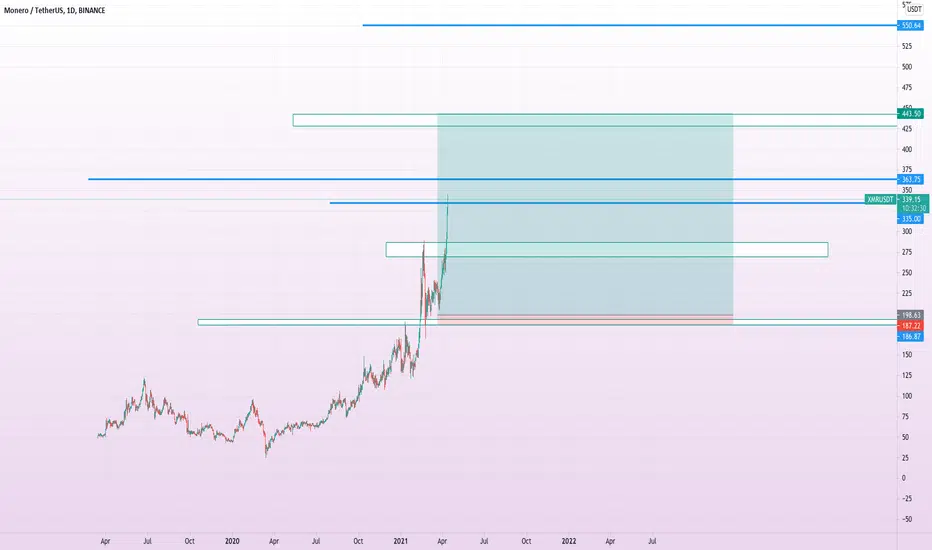
XMR/USDT - Rounded Bottom Signals: Breakout New Bullish Cycle?XMR has finally broken out of one of the strongest technical structures on the daily timeframe: a multi-month rounded bottom, a pattern that typically marks the transition from long distribution phases into new bullish cycles.
After establishing a stable base near $235, price has been rising gradually, forming a clean upward curvature that reflects a steady shift from selling pressure toward sustained accumulation. A rounded structure this smooth rarely appears unless buyers have been consistently absorbing supply for a long period.
Now, the market has touched and pierced the major historical resistance at $426, a level that has capped price for months. This breakout validates the pattern and suggests the market is shifting from consolidation into expansion.
The quick spike toward $471 shows aggressive buying interest but also marks this region as a liquidity cluster that will play a crucial role in determining continuation. As long as price holds above the $420–426 rim, buyers maintain full control and the bullish probability remains dominant.
Given the depth of the pattern at roughly $191, the measured breakout target sits around $615–$620, which is structurally reasonable if the breakout is confirmed and $426 flips into reliable support.
---
Pattern Explanation (Clear and In-Depth)
Pattern name: Rounded Bottom / Cup (pure cup, no handle formation).
Formation duration: Multi-month, which increases reliability.
Characteristics: stable bottom, consistent upward curvature, repeated rejections at the same horizontal level → market completing a major accumulation phase.
Breakout confirmation: daily candle closing above the rim → shift in medium-term market structure.
Large rounded bottoms like this are often precursors to trend reversals and are known for initiating strong directional moves.
---
Bullish Scenario (Primary Outlook)
1. Price forms a clean daily close above $426.
2. Ideal retest occurs at $420–430 with lower-wick support and rising volume.
3. If confirmed, continuation targets become:
$471 (local liquidity zone)
$520 (psychological resistance)
$618 (measured move) as the main structural target
4. As long as price holds above the ascending support and does not close below $420, the bullish structure remains intact.
Market narrative: buyers are controlling the tempo, and momentum is transitioning decisively upward.
---
Bearish Scenario (If Breakout Fails)
1. Breakout becomes a false breakout if price closes back below $420.
2. This would expose deeper corrective zones:
$380–400 (ascending support)
$340
$300
Even a return to the base of the pattern in a worst-case scenario
3. Bearish confirmation signals include: low breakout volume, repeated upper-wick rejections, and daily closes below the rim.
Market narrative: buyers lose control, and the asset slips back into prolonged accumulation.
---
Additional Insight
A rounded bottom of this scale is more than a pattern; it often reflects a major shift in market psychology. It typically marks the transition from weak, low-interest conditions to renewed investor engagement. When paired with a breakout at a long-standing resistance, this formation is one of the strongest signals for potential medium-to-long-term trend continuation.
For XMR, the structure shows that selling pressure that dominated earlier in the year has faded, and buyers are beginning to establish a clear advantage.
---
#XMRUSDT #Monero #CryptoAnalysis #RoundedBottom #Breakout #TechnicalAnalysis #PriceAction #MarketStructure #CryptoTrading
Xmrusdtrade

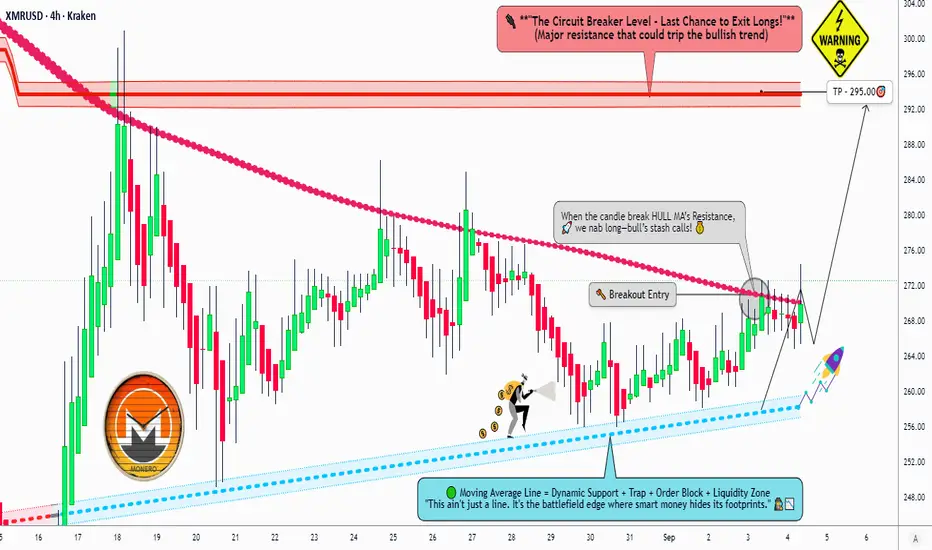
Monero vs USD: Breakout Levels and Layered Trade Setup⚡ XMR/USD | Monero vs USD – Bullish Money Looting Plan 🎭💰
🔑 Trade Plan Overview
Bias: Bullish (Swing/Scalping Hybrid Setup)
Strategy: Pending Order Breakout + Layered Entries (“Thief Layers” style)
Entry Plan (Thief Layering Style)
🔹 Breakout Trigger: 270.00 ⚡ (set alert to catch breakout easily)
🔹 Layered Limit Entries:
260.00
264.00
267.00
270.00 ⚡
(More layers can be added based on personal risk appetite.)
🛡 Stop Loss (Thief Protection)
🔹 Core SL idea: 256.00 🛑 (placed after breakout confirmation)
🔹 ⚠️ Reminder for Thief OG’s: Always adjust SL with your own strategy & risk control.
🎯 Target Zone (Escape with Loot)
🔹 Targeting 295.00 🏰
🔹 ⚡ Zone is near electric trap resistance + overbought area → Be wise, exit before the market turns against you.
🔹 Note: Everyone has their own profit-taking style → Take the loot at your comfort!
📌 Extra Notes (Thief OG Reminder)
🔹 This is a layering strategy with multiple limit buys to reduce risk and improve entry precision.
🔹 Breakout confirmation is key 🔑 before activating the plan.
🔹 Not financial advice — only my personal “thief-style” trading plan.
🚀 XMR/USD Market Report – September 04, 2025
💰 Current Snapshot
Price: $261.11 USD
24h Change: -0.11% 📉 (Slight dip amid broader market consolidation)
Market Cap: $4.93B (Stable in top 30 cryptos)
Key Trend: Neutral with bearish lean, but privacy demand keeps it resilient 🛡️
📊 Trader Sentiment Outlook
Investor mood is mixed but leaning cautious:
Retail Traders: 58% Bullish 🟢 (Up from 52% last week; fueled by community defense & new GMX trading pairs)
Institutional Traders: 45% Bullish 🟡 (Delistings limit exposure, but privacy-focused funds see inflows; whales added 340M XMR)
👉 Investors stay watchful, with only 40% green days in the last month. Privacy features act as a hedge in volatile markets, keeping confidence intact despite short-term pressure.
😨📈 Fear & Greed Index
Score: 49 (Neutral) ⚖️
Fear factors: Exchange delistings & macro uncertainty (tariffs, inflation).
Greed factors: Network resilience & ETF buzz for privacy coins.
🔎 Market feels balanced – not fearful, not euphoric → ideal for steady accumulation.
🔍 Fundamental Score
Score: 8/10 🟢 (Strong Privacy Edge)
Strengths:
Untraceable transactions (ring signatures + stealth addresses).
No pre-mine, ASIC-resistant → decentralized & secure.
Adoption in DeFi + payments keeps rising.
Tail emission model ensures long-term network security.
Weakness: Limited exchange listings = reduced liquidity.
⚡ Verdict: Fundamentals make Monero the gold standard for privacy in a surveilled world.
🌍 Macro Score
Score: 6/10 🟡 (Mixed Global Winds)
Fed rate cuts + ETF inflows bring liquidity boost.
Tariffs & sticky inflation = added volatility.
Bitcoin dominance (60%+) pressures alts.
Privacy demand rising with global surveillance concerns.
US policies move toward clarity ✅, EU privacy coin bans loom ❌.
🔮 Outlook: Liquidity-driven bullishness, but September jobs data could spark swings.
🎯 Overall Market Outlook
Bearish Short-Term 📉🟡 – but potential reversal brewing:
Corrective pullback from May highs → likely chop toward $235 support.
Technicals:
Bearish crossover (20-day MA < 50-day).
RSI at 47 = neutral momentum.
Long-Term View: Privacy utility + easing macro could drive breakout → $300+ if $270 resistance breaks.
🔥 Main Takeaways:
Privacy king in uncertain times 🛡️
Neutral sentiment, dips = smart accumulation zones 💎
Macro volatility ahead – patience is key ⏳
📌 Data reflects real-time market conditions; always DYOR before trading.
🔎 Related Pairs to Watch ($)
🔹BTCUSD
🔹ETHUSD
🔹LTCUSD
🔹 DASHUSD
🔹 ZECUSD
✨ “If you find value in my analysis, a 👍 and 🚀 boost is much appreciated — it helps me share more setups with the community!”
#XMRUSD #Monero #CryptoTrading #SwingTrade #Scalping #BreakoutStrategy #TradingPlan #LayeringStrategy #ThiefTrader
the XMR is going to blow your mind Indicators Used:
Moving Average 20 High (Red Line): This serves as a resistance level.
Moving Average 20 Low (White Line): This serves as a support level.
Fibonacci Retracement Levels: These are displayed and show key retracement and extension levels based on a recent price swing.
Volume Bars: Shown in red and green, indicating selling (red) and buying (green) volume intensity.
Price Action:
The current price is around 199.88, trading slightly below the 20 High MA (Red) and above the 20 Low MA (White). This suggests consolidation between these moving averages, acting as short-term resistance and support.
The price retraced after hitting a local high and is now testing the Fibonacci 0.5 and 0.618 retracement levels, which are strong zones for a potential reversal or continuation.
Fibonacci Levels:
0.618 Level: The price is near this retracement level, which often acts as strong support during retracements in uptrends.
Extension Levels: Levels like 1.272 and 1.618 suggest potential future price targets if the uptrend resumes.
Volume Analysis:
The volume bars show a mix of buying and selling pressure, with some decrease in recent activity. This could indicate indecision in the market, waiting for a breakout or breakdown.
Scenarios to Watch:
Bullish Scenario:
If the price breaks above the 20 High MA (Red) and maintains above the 0.618 retracement, this could signal a continuation of the uptrend.
Look for a retest of resistance levels around 204 (near Fibonacci 1) or higher extensions like 1.272 or 1.618.
Bearish Scenario:
If the price falls below the 20 Low MA (White) and breaks below the 0.618 retracement, it may test lower support levels near 194 or even 190.
Sideways Scenario:
The price could consolidate between the 20 High MA and 20 Low MA, with traders waiting for a breakout.
Key Levels to Watch:
Resistance:
200.27 (20 High MA)
204 (Fibonacci 1 level)
210-212 (Fibonacci extension levels)
Support:
198.01 (20 Low MA)
194 (Historical Support Zone)
190.10 (Major Support)
This chart shows a critical point where the market could decide its next direction. Pay close attention to how the price interacts with the moving averages and Fibonacci retracement levels to plan your next trade!

XMRUSD MONERO Long Bullish can go to 190 USDAccording to our current Monero price prediction, the value of Monero is predicted to drop by -2.32% and reach $ 164.17 by July 6, 2023. According to our technical indicators, the current sentiment is Bullish while the Fear & Greed Index is showing 59 (Greed). Monero recorded 21/30 (70%) green days with 7.04% price volatility over the last 30 days. Based on our Monero forecast, it's now a good time to buy Monero.
Based on data from July 01, 2023 at 20:43, the general Monero price prediction sentiment is bullish with 25 technical analysis indicators signaling bullish signals, and 8 signaling bearish signals.
Technical Analysis Bullish
1 Monero makes 3 weeks Higher Lows and Higher Highs
2 Trend continuation Confirmation RSI
See Circles
10 Nov 2022
9th March 2022
10th June 2022
3 RSI is above 50
4 Rsi confirmation is Bullish
5 Volume is increasing Bullish
6 We have rising POCs
7 Volume Value has been shifting higher
8 Monero is currently trading above the 200-day simple moving average (SMA). The 200-day SMA has been signaling BUY for the last 8 days, since Jun 23, 2023.
The price of Monero is currently above the 50-day SMA and this indicator has been signaling BUY for the last 9 days, since Jun 22, 2023.
The most recent Death Cross in the Bitcoin market happened 30 days ago, on Jun 01, 2023. Meanwhile, a Golden Cross last occurred on Jan 09, 2023, which was 173 days ago.
Based on our technical indicators, Monero's 200-day SMA will rise in the next month and will hit $ 153.22 by Jul 31, 2023. Monero's short-term 50-Day SMA is estimated to hit $ 159.61 by Jul 31, 2023.
The Relative Strength Index (RSI) momentum oscillator is a popular indicator that signals whether a cryptocurrency is oversold (below 30) or overbought (above 70). Currently, the RSI value is at 74.32, which indicates that the XMR market is in a overbought position. The RSI indicator suggests that the price of XMR will increase.
Monero reached its highest price on Jan 9, 2018 when it was trading at its all-time high of $ 593.42, while Monero's lowest price was recorded on Jan 14, 2015 when it was trading at its all-time low of $ 0.212967. The lowest price since it's ATH was $ 26.23 (cycle low). The highest XMR price since the last cycle low was $ 514.43 (cycle high). The Monero price prediction sentiment is currently bullish, while Fear & Greed Index is showing 59 (Greed).
Monero's current circulating supply is 18.30M XMR out of max supply of 18.20M XMR. The current yearly supply inflation rate is 0.86% meaning 156,872 XMR were created in the last year. In terms of market cap, Monero is currently ranked #5 in the Proof-of-Work Coins sector, ranked #1 in the Privacy Coins sector and ranked #15 in the Layer 1 sector.
Highlights
Price has increased by 48% in the last 1 year
Outperformed 79% of the top 100 crypto assets in 1 year
Trading above the 200-day simple moving average
21 green days in the last 30 days (70%)
Trading on Binance
Trading with Euro
Yearly inflation rate is 0.86%
Monero price in US Dollar has increased by 13.08% in the last 1 month. XMR is up 10.29% against Ethereum and down -0.47% against Bitcoin in the last 1 month.
The top-performing year for Monero was 2016 when the price of XMR increased by 2,830.22% from $ 0.470402 to $ 13.78. The worst performing year for Monero was 2018 when the price dropped by -86.72% from $ 349.16 to $ 46.38. The average yearly growth of Monero over the last 10 years is 595.55% per year. Usually, Monero performs best in Q3 with an average of 59.43% gain and worst in Q2 with 11.17% gain.
Risk Analysis
Outperformed by Bitcoin and Ethereum
Down -72% from all-time high
Has medium liquidity based on its market cap
How is the price positioned in comparison to the all-time high?
The price is currently down -72% from the all-time high.
How is the price positioned in comparison to the cycle high/low?
Monero is currently trading at -67.40% below cycle high and 539.17% above cycle low.
Is the price highly volatile?
The 30-day volatility is above 30% and is currently at null%
Does it have enough liquidity based on market cap to volume ratio?
Has medium liquidity with 0.0282 volume to market cap ratio. The current market cap is $ 3.07B while the 24-hour volume is $ 86.46M
Is the total supply high in comparison with the circulating supply?
Over 101% of the total supply is in circulation.
Is the current inflation below 2% per year?
The yearly inflation rate is 0.86% meaning there were 156,872 coins generated in the last 1 year.
According to our current Monero price prediction, the value of Monero is predicted to drop by -2.32% and reach $ 164.17 by July 6, 2023. According to our technical indicators, the current sentiment is Bullish while the Fear & Greed Index is showing 59 (Greed). Monero recorded 21/30 (70%) green days with 7.04% price volatility over the last 30 days. Based on our Monero forecast, it's now a good time to buy Monero.
Comparing Monero against other important technological innovations and trends is one way of predicting where the Monero price could head over the long term. The table above shows what the Monero price would be by end of year 2024, 2025, and 2026 if its growth trajectory followed the growth of the internet, or large tech companies like Google and Facebook in their growth phase.
In the best case scenario, XMR price prediction for year 2026 is $ 3,836.33 if it follows Facebook growth. In case Monero would follow Internet growth the prediction for 2026 would be $ 440.09.
Monero Key Price Levels
Based on today's classical pivot point (P1) with the value of $ 166.97, Monero has support levels of $ 164.34, $ 160.29, and the strongest at $ 157.66. Similarly, Monero resistance levels are at $ 171.02, $ 173.65, and $ 177.70..
Monero Correlation
Over the past 7 days, Monero price was most positively correlated with the price of TRON (TRX), Stellar (XLM), Bitcoin Cash (BCH), Zcash (ZEC) and Bitcoin SV (BSV) and most negatively correlated with the price of XRP (XRP), OKB (OKB), Cardano (ADA), NEM (XEM) and Binance Coin (BNB).
Monero price is positively correlated with the top 10 coins by marketcap with a value of 0.119, excluding Tether (USDT) and positively correlated with the top 100 coins by marketcap excluding all stablecoins with a value of 0.107.
Currencies that are positively correlated with Monero indicate that the movement of one has a statistically significant weight to lead the other in the same direction. For currencies that are negatively correlated with Monero, a move in one direction for Monero would translate into a move in the opposite direction for the negatively correlated coin.
Monero Price Forecast(Probability 69%) This is just a mathematical methode to trade my own accont, Okease note that it is for educational and informative issue, and you should use stops and proper risk and money mangemnt to protect your capital.
Date Price Change
Jul 2, 2023 $ 168.17 0.06%
Jul 3, 2023 $ 169.11 0.62%
Jul 4, 2023 $ 171.83 2.24%
Jul 5, 2023 $ 170.25 1.30%
Jul 6, 2023 $ 164.17 -2.32%
Jul 7, 2023 $ 170.84 1.65%
Jul 8, 2023 $ 166.89 -0.70%
Jul 9, 2023 $ 165.08 -1.78%
Jul 10, 2023 $ 151.52 -9.85%
Jul 11, 2023 $ 158.89 -5.46%
Jul 12, 2023 $ 157.76 -6.13%
Jul 13, 2023 $ 160.38 -4.57%
Jul 14, 2023 $ 155.57 -7.43%
Jul 15, 2023 $ 151.87 -9.63%
Jul 16, 2023 $ 156.14 -7.10%
Jul 17, 2023 $ 155.08 -7.73%
Jul 18, 2023 $ 155.62 -7.40%
Jul 19, 2023 $ 157.16 -6.49%
Jul 20, 2023 $ 156.53 -6.86%
Jul 21, 2023 $ 164.10 -2.36%
Jul 22, 2023 $ 165.61 -1.46%
Jul 23, 2023 $ 169.10 0.62%
Jul 24, 2023 $ 175.47 4.41%
Jul 25, 2023 $ 176.17 4.83%
Jul 26, 2023 $ 179.92 7.06%
Jul 27, 2023 $ 185.74 10.52%
Jul 28, 2023 $ 190.11 13.12%
Jul 29, 2023 $ 183.07 8.93%
Jul 30, 2023 $ 187.35 11.48%
Jul 31, 2023 $ 187.86 11.78%

Xmr Looks Promising Here Xmrusdt
Love the way xmr ignoring btc movement
Attempting breakout incase of successful breakout I am expecting 80-100% bullish wave

Xmr Building Up for Massive Breakout Seems Like Getting ready for Massive Breakout formed Descending Channel In 3 days Timeframe Incase Of Breakout Expecting 180 to 200% bullish Wave

🟢 XMR USDT - 4H (04/02/2023)🟢 XMRUSDT
TF: 4H
Side: Long
TP 1: $174.22
TP 2: $176.67
TP 3: $178.65
Absolute beauty! Gorgeous looking bull flag on the 4H time frame. When this pops its gonna be awesome.
Not using SL as usual on this swing trade so I can DCA and get the best possible entry for my position.
RSI and MACD look ready. LTFs just need to sync up a bit.

XMR USDT one last pullbacki will enter an order for a short position on XMR at 158.5$ (current price 157.30$)
STOP LOS S if 4h candle closes above 160$ which is a 0.8% loss
the risk of 0.8% is minimal,so i will use 3x.max loss 2.4%
TAKE PROFIT will be 151.5$ which is 4.4% and 13.2% with leverage.
i believe that in the next couple of days some manipulation at the price of ptc will come and see 19150$ which
means that overextended alts will dip too.
if the order is not executed and the situation changes,i will update the idea here.
FOLLOW FOR MORE!


XMR is getting closer to perfect buy zone!!!!!!! (Not-Trade-Advice)
Hello guys, as the bad movements of the market lately XMR is staying strong like a solid rock. As you see on the chart it had break its descending triangle and got supported on the upper trend line of the formation itself.
On the daily chart there must be a support of the daily 200ma price about 204-208$ and it will be our buy zone. For fib levels; those prices are in golden pocket zone. That means with 200ma and golden pocket supports gonna
give XMR a good opportunity for Long Positions.
I wrote Stop-lose and take profit prices. They are situational but i dont think they will be changed too much. I'll update my analysis.
See you soon
(Not-Trade-Advice)

$XMR (Monero) Swing Long Update +53% #MONERO #XMRWe have hit our first target for the $XMR swing with a 53% Profit! The trend is your friend, follow it. Congratulations to those who entered this long position!
We will hit our 2nd Target in time!

XMR is super Bullish!!!!!!!!! 30 MINXMR Broke out of the descending channel and retested it yesterday. The 10 day ema is about to cross the 30 day ema from the bottom, What does this mean:
Hand me my Lightsaber.

XMRUSDT BUY IDEAXMRUSDT has finally reached the support area of 220.07 (4 Hour chart) and the trend line support also held the price which gave me a confirmation bulls coming in.

XMRUSDXMRUSD chart review. range/accumulation setup in progress. currently ACCUMULATION MODE. BULLS reload low near 170USD. strong bullish chart. up to 75% gains possible later. short-term pullback possible. bulls wait for pullback.

XMRUSDt local signalHello friends.
Please support my work by clicking the LIKE button(If you liked).Thank you!
Everything on the chart.
open pos: market
target: 330 and 350
after first target reached move ur stop to breakeven
stop: ~282 (depending of ur risk). ALWAYS follow ur RM .
risk/reward 1 to 2.2
Good luck everyone!
Follow me on TRADING View, if you don't want to miss my next analysis or signals.
It's not financial advice.
Dont Forget, always make your own research before to trade my ideas!
Open to your questions or suggestions(Looking for investors!).

XMRUSDT , We are ready for ranging :DHello guys
Today we analysis 6 chart and publish it for anyone that can take position and can take profit from market
In here we a key in some candles ago and we need a pullback to the minor resistance to accept the key after that it can fall down until the 1st tp reach
Dont forget stop loss and money management
Be with us and slepp comfortably
Good Luck
Abtin

XMRUSDT Waiting for the Resistance zone Breakout!XMRUSDT Technical analysis Update
XMR/USDT currently trading at $249
Waiting for the resistance Breakout
Buy level : Above $251.00
Stop loss: $237.00
TP1: $260
TP2: $270
TP3: $281
TP4: $290
Max Leverage 2x
Always keep Stop loss
Note: please do your own research before investing. Never invest money that you can't afford to lose.

XMRUSDT Might Be at the beginning of an Uptrend @monero
Welcome back Traders, Investors, and Community!
Hi Traders, XMRUSDT has broken above the major Resistance, however the market is ranging now and I guess we would have a retracement at around 199.27 before we start a new uptrend. The price also may go back all the way down to retest the Resistance before it goes up.
⬆️Buy now or Buy at 199.27
⭕️SL @ 182.99
✅TP1 @ 222.66
✅TP2 @ 244.05
✅TP3 @ 274.92
We will have more FREE forecasts in TradingView soon
❤️ Your Support is really appreciated!❤️
Have a Profitable Day


XMR/USDTThere might be the chance of entry on pullback if happen. See potential for re-test of 280-290 zone.
