Asymmetric War Trade – $3.90 Anticipatory Entry Targeting $9.901. Revised Technical Analysis
Current Price: $3.82
New Proposed Entry: $3.90
New Stop-Loss: $2.90
A. Logic of the New Entry Scheme
Early Entry: Entering at $3.90 anticipates an earlier confirmation of the rebound, based on:
The active bullish divergence on the CCI
The immediate proximity of the current price ($3.82)
The intent to capture upward movement before the major Fibo resistance
Improved Risk/Reward Ratio: The lower entry and tight stop create a superior R:R.
B. Calculation of the New Risk/Reward Ratio
Risk per unit: $3.90 - $2.90 = $1.00
Reward to TP1 ($8.16): $8.16 - $3.90 = $4.26
Base R:R: 1:4.26 (Extremely favorable)
Reward to TP2 ($9.90): $9.90 - $3.90 = $6.00 → R:R 1:6
C. Required Technical Validation for $3.90
Minimum Condition: Weekly close above $3.85 + CCI maintaining its ascent
Additional Confirmation: Break above $4.50 as a first intermediate signal
2. Revised Scenarios with New Levels
Optimized Bullish Scenario
Entry: $3.90 (buy on current strength)
Stop-Loss: $2.90 (-25.6% from entry)
Targets:
TP1: $5.80 (+48.7%) - First Fibo test
TP2: $6.70 (+71.8%) - Major breakout
TP3: $8.16 (+109.2%)
TP4: $9.90 (+153.8%)
Invalidation Scenario
The stop at $2.90 invalidates the thesis if:
The CCI divergence fails
Price fails to surpass $4.50
Fundamental downward pressure prevails
3. 2026 Geo-Economic Analysis - Impact on Strategy
Impact of the New Scheme on Crisis Management
Lighter Initial Position possible thanks to the favorable R:R
Reduced Capital at Risk: $1.00 initial risk vs. potential $6.00+ move
Increased Flexibility to:
Add on the breakout of $6.70
Fund geopolitical hedges
Recalculated Extreme Price Scenarios
From $3.90:
Moderate crisis scenario ($12): +207%
Major crisis scenario ($20): +412%
Catastrophe scenario ($25): +541%
4. Detailed Execution Plan
Step 1: Initial Entry
Level: $3.90
Size: Core position (50% of planned exposure)
Condition: CCI > -50 and price > $3.85 on daily close
Step 2: Post-Entry Management
First target: $4.50 → Move stop to $3.40
Critical threshold: $5.00 → Technical stop to $4.00
Decision zone: $5.50-$5.80 → Prepare addition or reduction
Step 3: Conditional Additions
Addition 1: On breakout of $5.80 (+33% from TP1)
Addition 2: On confirmation > $6.70
Unified stop after additions: $5.20
5. Trade Dashboard
Metric Value Comment
Entry $3.90 Anticipatory level
Stop-Loss $2.90 -25.6% risk
Unit Risk $1.00
TP1 ($5.80) +48.7% R:R 1:1.9
TP2 ($6.70) +71.8% R:R 1:2.8
TP3 ($8.16) +109.2% R:R 1:4.3
TP4 ($9.90) +153.8% R:R 1:6.0
Crisis Scenario ($15) +284.6% R:R 1:11.1
6. Final Recommendations
Advantages of the New Scheme
Exceptional R:R: Even with 30% success rate, the mathematical expectancy is positive
Early Exposure to geopolitical movements
Tight Stop limiting losses in case of failure
Specific Risks
Stop too tight: Risk of premature exit on normal volatility
Lack of confirmation: Entry without Fibo validation
Adaptation to 2026 Conditions
Allocation: 3-5% of capital on this anticipatory scheme
Complementary Hedge: Call options at $6.00 to cover the intermediate phase
Enhanced Monitoring between $3.50-$4.50 for dynamic adjustment
Strategic Conclusion:
The revision to a $3.90 entry with a $2.90 stop transforms this trade into an asymmetric opportunity:
Limited Risk: $1.00 per unit
Unlimited Potential through geopolitical leverage
Optimal Positioning for the dual contingency:
Slow technical realization towards $5.80-$6.70
Triggering geopolitical event (the true 2026 catalyst)
"This strategy anticipates that the first signal of geopolitical escalation will send natural gas well beyond $4.50, making the $3.90 entry retrospectively very low. The $2.90 stop is the price to pay for this anticipation."
Xngusdanalysis

Natural Gas Prices Surge as Cold Weather ApproachesNatural Gas Prices Surge as Cold Weather Approaches
According to AccuWeather, a powerful Arctic cold front is expected to sweep across the United States, reaching as far south as the southern states and bringing lower temperatures to more than 150 million people across 24 states.
On Thursday, Texas Governor Abbott declared a state of emergency in more than half of the state’s counties ahead of the cold snap. It is worth noting that Texas is home to key natural gas production facilities, while its infrastructure is less adapted to prolonged cold weather.
As a result, market sentiment is being shaped both by expectations of higher natural gas demand for heating and by the risk of technical disruptions to production.
Consequently, the XNG/USD chart shows a sharp rise in natural gas prices, with the move from last week’s low to the recent high amounting to nearly 40%.
Technical Analysis of the XNG/USD Chart
When analysing gas prices on 15 January, we identified a long-term descending channel, highlighted in red on the chart. At that time, we also:
→ noted that prices were hovering near the 2025 low;
→ suggested that bears might attempt to break below the 2025 low, which could have a psychological impact on the market, prompting short sellers to take profits and encouraging renewed buying interest.
Indeed, following a false bearish break of the 2025 low (as indicated by the arrow), prices surged sharply towards the median of the channel, an area where supply and demand often tend to balance.
Moreover, around the 3.330 level, there was a clear period of imbalance in favour of buyers. Bulls broke through the descending trendline resistance, and XNG/USD rose with minimal pullbacks.
From a technical perspective, it is therefore possible that this area may now act as support. However, the actual path of the natural gas market will largely depend on the severity of the cold weather and its impact on conditions across the country.
This article represents the opinion of the Companies operating under the FXOpen brand only. It is not to be construed as an offer, solicitation, or recommendation with respect to products and services provided by the Companies operating under the FXOpen brand, nor is it to be considered financial advice.

XNG/USD Bullish Retest Play | MA Support Holds🔥 XNG/USD (NATURAL GAS) - BULLISH TRADE OPPORTUNITY 🔥
Natural Gas is showing strength with a confirmed bullish structure! This idea outlines a potential day trade as price retests a key moving average support level.
📈 Trade Plan: Bullish
Idea: Long on any retest/dip, targeting a move towards the next significant resistance.
Rationale: Price action confirms a bullish bias, with the Moving Average acting as dynamic support.
🎯 Key Levels & Execution
✅ Entry Zone: Any price level is considered, but a retest of the MA support offers a favorable risk-reward. Be patient for your setup!
🛑 Stop Loss (Risk Management):
My Personal SL: 4.000
⚠️ IMPORTANT NOTE: This is MY stop loss based on MY risk tolerance and strategy. YOU MUST adjust your SL according to your own capital management rules. Trade at your own risk!
🎯 Take Profit Target: 4.400
This level aligns with a strong resistance zone, overbought signals, and a potential correction area. Secure your profits accordingly!
🔍 Related Pairs & Market Correlations
To get a fuller picture of the Energies market, keep an eye on these key assets:
TVC:USOIL / BLACKBULL:WTI (Crude Oil): 💡 The "big brother" of energy. Often, strength in Crude can pull Natural Gas higher, though the correlation isn't always perfect.
ICMARKETS:XBRUSD (Brent Oil): 🌍 The international energy benchmark. Similar to WTI, its trends can influence sentiment across the entire energy complex.
TVC:DXY (U.S. Dollar Index): 💵 KEY CORRELATION! Since XNG is quoted against the USD (XNG/USD), a weaker Dollar typically bullish for Natural Gas. A stronger Dollar can act as a headwind. Watch the DXY closely!
AMEX:UNG (United States Natural Gas Fund ETF): 📊 A popular ETF that tracks Natural Gas prices. Good for confirming momentum and retail sentiment.
✅ Key Takeaway: A weakening TVC:DXY and strength in TVC:USOIL could provide the perfect tailwinds for this XNG/USD bullish move!
👍 Found this helpful? Give it a LIKE & FOLLOW for more daily trade ideas and insights! 🚀
💬 Comment below with your take on Natural Gas! Let's discuss the setup.

Natural Gas Volatility Compression Precedes Breakdown🔻 NATURAL GAS (XNG/USD) – Bearish Breakdown Setup | Day & Swing Trade
Asset: XNG/USD – Natural Gas vs U.S. Dollar (Commodities CFD)
Market Type: Energy Commodities
Timeframe: Intraday → Swing
📉 Trade Bias
Primary Bias: Bearish continuation
Market structure shows distribution near resistance, with sellers defending the upper zone. Momentum remains capped below dynamic averages.
🧠 Technical Plan
Setup Type: Trend continuation (Break & Hold)
Indicator Focus: TMA (Triangular Moving Average)
Price is waiting for confirmation via TMA breakdown
Volatility compression hints at an expansion move lower
🎯 Entry Strategy
🟢 Entry Method:
Sell AFTER confirmed TMA moving-average breakout
Trigger Zone: Around 3.200
Execution: Market or pullback entry after MA break
(No forced entries — patience = edge)
🎯 Profit Target
🎯 Primary Target: 2.800
🛑 Why this level?
Acts as a “police force” resistance-turned-support
Previous overbought & bull-trap zone
Smart money likely to book profits here
⚠️ Partial profits recommended — scale out, don’t be greedy.
🛑 Stop Loss (Risk Control)
🔴 Protective Stop: 3.600
This is a defensive SL, not financial advice.
Capital protection comes first — survival beats hero trades.
🔗 Correlated Markets to Watch
Keep an eye on these instruments for confirmation or divergence:
DXY ( AMEX:USD Index) – Strong USD = pressure on commodities
WTI Crude Oil (USOIL) – Energy sector sentiment spillover
XAU/USD (Gold) – Risk-off flows vs commodity demand
S&P 500 ( SP:SPX ) – Risk appetite correlation
US10Y Treasury Yield ( TVC:TNX ) – Macro pressure on energy pricing
📌 If USD strengthens + yields rise → bearish NATGAS bias strengthens.
🌍 Fundamental & Economic Drivers (Key Focus)
Bearish factors currently influencing Natural Gas:
Seasonal demand normalization (post-peak heating demand)
High storage levels vs historical averages
Stable to increasing U.S. production output
USD strength weighing on dollar-denominated commodities
Upcoming catalysts traders should monitor:
🗓 U.S. Natural Gas Storage (EIA Weekly Report)
🗓 U.S. CPI / PPI inflation data
🗓 Federal Reserve policy tone & rate expectations
🗓 Weather outlook updates (temperature deviations)
⚠️ Volatility spikes expected around EIA release days — manage exposure accordingly.
🧾 Final Notes
This setup is confirmation-based, not prediction-based
Trade what the market shows, not what you hope
Risk management > entry precision
💬 If the TMA breaks — sellers take control.
👍 Like | 💬 Comment | 🔁 Share if this plan adds value to your trading playbook.

Natural Gas Prices Fall to a Near Five-Month LowNatural Gas Prices Fall to a Near Five-Month Low
As the XNG/USD chart indicates, natural gas prices are trading very close today to the 2025 low formed in August.
The factors weighing on natural gas prices include:
→ Updated weather models, which are forecasting higher temperatures in the eastern US in late January (24–28), sharply reducing expected demand for gas used for heating.
→ Technical issues with power supply and pipelines at the Cheniere Corpus Christi and Freeport LNG terminals, which have reduced gas flows for export. This means gas that was destined for overseas markets is remaining on the domestic market, adding to inventories.
→ Supply–demand imbalance. US gas production is near record levels (110.7 billion cubic feet per day), while domestic consumption has fallen by 15.5% year-on-year.
Technical Analysis of the XNG/USD Chart
In our earlier analysis of gas prices, we identified a long-term descending channel, shown in red on the chart. On 19 December, we:
→ noted that the price was trading near the channel’s median, where supply and demand typically balance;
→ suggested that the market could enter a consolidation phase.
Indeed, prices hovered around the median until 30–31 December, when a sharp decline began. During this move:
→ bearish gaps formed on the XNG/USD chart, indicating a strong dominance of sellers;
→ based on the price action, a downward trajectory can now be drawn (shown by the orange lines).
Traders should be prepared for the possibility that, in the near term, bears may attempt to break below the 2025 low. In that case, it cannot be ruled out that:
→ this would have a psychological impact on the market;
→ sellers would take profit on short positions;
→ buyers could step in and push gas prices up towards the R2 resistance line.
This article represents the opinion of the Companies operating under the FXOpen brand only. It is not to be construed as an offer, solicitation, or recommendation with respect to products and services provided by the Companies operating under the FXOpen brand, nor is it to be considered financial advice.

XNG/USD Trade Guide | Bullish Momentum Building🔥 XNG/USD (NATURAL GAS) — Bullish Trade Opportunity | Day / Swing Setup
📌 Asset Overview
Asset: XNG/USD — Natural Gas
Market: Energies | Commodities
Trading Style: Day Trade / Swing Trade
📈 Trade Plan — BULLISH BIAS
🟢 Primary Bias: Bullish continuation
🟢 Market Structure: Demand strength holding above key zones
🟢 Volatility: Expanding (energy markets active)
🎯 Entry Strategy
💡 Entry:
➡️ YOU CAN ANY PRICE LEVEL ENTRY
➡️ Flexible execution based on your own confirmation model
➡️ Suitable for both scalpers & swing traders
🛑 Risk Management
🚨 Stop Loss: 3.900
⚠️ This is thief SL
📝 Risk Note:
Dear Ladies & Gentlemen (Thief OG’s),
I am NOT recommending to follow only my SL.
✔️ Adjust stop loss based on your strategy, risk appetite, and account size.
✔️ Capital protection comes first.
💰 Profit Objective
🎯 Target: 4.500
📊 Target Logic:
Strong resistance zone ahead
Overbought conditions expected near highs
Trap probability increases → book profits & escape smartly
📝 TP Note:
Dear Ladies & Gentlemen (Thief OG’s),
I am NOT recommending to follow only my TP.
✔️ Secure profits based on your plan & market behavior.
🔗 RELATED PAIRS TO WATCH (Correlation Watchlist)
Keep an eye on these $-denominated energy & USD drivers:
🛢️ Energy Correlation
USOIL ( BLACKBULL:WTI ) → Strength supports energy sentiment
UKOIL ( BLACKBULL:BRENT ) → Confirms global energy demand tone
💵 USD Correlation
DXY (U.S. Dollar Index)
🔻 Weak USD = 🔺 Natural Gas supportive
🔺 Strong USD = ⚠️ May slow upside momentum
🏭 Energy Equity Proxy
Energy sector indices / producers
Institutional inflows into energy stocks often align with NG strength
🌍 FUNDAMENTAL & ECONOMIC FACTORS TO CONSIDER
🔥 Natural Gas–Specific Drivers
🌡️ Weather Outlook (US & Europe):
Colder-than-normal forecasts = higher heating demand → bullish NG
🏭 Storage Levels:
Lower-than-average inventories support upside pricing
🚢 LNG Export Demand:
Strong U.S. LNG exports tighten domestic supply
💼 Macro & Economic Factors
🏦 Federal Reserve Policy:
Rate cut expectations → weaker USD → supportive for commodities
📊 US Economic Data (GDP, PMI):
Strong growth = higher industrial energy demand
🌍 Geopolitical Energy Risks:
Supply disruptions amplify volatility & upside spikes
🧠 TRADER’S NOTE
✔️ This setup is directional, not predictive
✔️ Let price action confirm your execution
✔️ Manage risk like a professional, not a gambler
📌 If this analysis helps your trading, support it with a 👍 Like, 💾 Save, and 🗨️ Comment — it helps the idea reach more traders.
Natural Gas Market Signaling a Fresh Bullish Opportunity?🔥 XNG/USD – Natural Gas Bullish Swing Trade Play | Energy Momentum Setup 🔥
📌 Asset
XNG/USD – NATURAL GAS
Energies & Commodities Market
⏳ Trade Type: Swing Trade
🧭 Market Plan
📈 Bullish Bias Active
Natural Gas is showing upside continuation potential, supported by energy-sector momentum and price acceptance above key demand zones. Bulls are currently in control while volatility expands.
🎯 Entry Strategy
🟢 Flexible Entry Allowed
You may enter from any favorable price level, aligned with your own execution model.
This setup supports scaling or single-entry styles, depending on risk preference.
🛑 Stop Loss
🔻 Reference SL: 3.500
⚠️ Risk Note:
Dear Ladies & Gentlemen (Thief OG’s),
This is not a mandatory stop loss. Always adjust your SL based on:
Position size
Volatility
Personal risk management rules
💡 Capital protection comes first.
🏆 Profit Targets
🎯 Target 1: 4.500
🎯 Target 2: 5.200
📊 Why Take Profits Here?
Strong historical resistance zones
Overbought conditions likely near targets
Liquidity traps often appear at these levels
➡️ Book profits smartly and don’t get greedy.
⚠️ TP Disclaimer:
This is a guideline, not a command. Secure profits based on your own strategy.
👀 Related Assets to Watch (Correlation Check)
⛽ WTI Crude Oil (USOIL / WTI)
Positive sentiment in energy markets often supports Natural Gas
Rising oil prices can lift overall energy demand expectations
🛢️ Brent Crude (UKOIL)
Global energy benchmark
Strength in Brent usually confirms broad energy-sector bullishness
🇺🇸 DXY – U.S. Dollar Index
Natural Gas is USD-denominated
Weak USD = tailwind for commodities
Strong USD may slow upside momentum
📊 Energy Sector Index / Energy Stocks
Institutional flows into energy equities often precede commodity strength
Watch for sector-wide risk-on behavior
🧠 Final Notes
✅ Trade with confirmation
✅ Respect volatility
✅ Manage risk aggressively
✅ Profits > Ego
If this idea adds value, hit 👍 Like, 💬 Comment, and ⭐ Follow to stay ahead of smart money moves.
Trade safe & trade sharp. 🚀💰

Natural Gas Prices Fell in Late DecemberNatural Gas Prices Fell in Late December
On 4 December, while analysing the XNG/USD chart, we highlighted the rally in natural gas prices towards a three-year high and noted that the price had entered a resistance zone formed by:
→ the upper boundary of a broad descending channel (shown in red);
→ the $4.800/MMBtu level, near which a peak was formed in March;
→ the psychological $5.000/MMBtu mark.
As indicated by the arrow:
→ this resistance cluster proved effective, and after an attempt to break above the $5.000 psychological level, the uptrend reached its climax;
→ following the appearance of a bearish gap on 8 December, selling pressure took control, leading to a break below the orange ascending trend line and a decline in US natural gas prices.
From a fundamental perspective, the pullback has been driven by several factors:
→ Seasonality. Weather forecasts for the US holiday period point to above-average temperatures, reducing demand for heating and power generation.
→ Rising production. According to Trading Economics, natural gas output in the continental United States reached 109.7 billion cubic feet per day in December, maintaining the record levels seen in November. In addition, EIA data show that gas inventories remain 0.9% above the current five-year average.
It is worth noting that today natural gas prices are trading:
→ near a support zone created by the bullish gap formed in the second half of October;
→ close to the median of the aforementioned descending channel, an area where supply and demand often come back into balance.
Taking this into account, it is reasonable to assume that:
→ after a sharp drop of around 30% from the early-December peak, sellers may look to lock in profits ahead of the holidays;
→ the market could enter a consolidation phase.
This article represents the opinion of the Companies operating under the FXOpen brand only. It is not to be construed as an offer, solicitation, or recommendation with respect to products and services provided by the Companies operating under the FXOpen brand, nor is it to be considered financial advice.

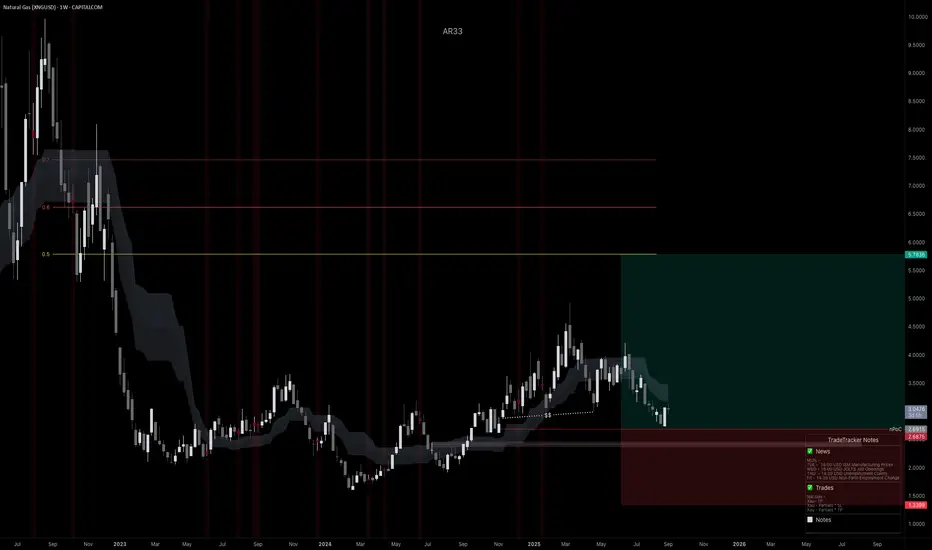
XNGUSD, Accumulation to Expansion? Weekly Long Into Winter RiskI’ve initiated a long on Natural Gas from weekly structure. Price has rotated inside this area since ’23 and is now reacting at a confluence of trendline support + prior demand. The plan is to hold into Q4, when seasonality (heating demand + potential hurricane/LNG disruptions) often provides upside tailwinds. Risk is defined on the weekly chart; I’ll manage around swings and let the position work.
Technicals (Weekly)
• Range base reclaimed: Price is bouncing from the same 2023–2024 accumulation zone (roughly 2.5–3.0).
• Multi-touch trendline support: Current candle is reacting at the rising base trendline; wicks show responsive buying.
• Structure targets: First objective is a move back into mid-range supply; extension aims toward the upper band shown on the chart.
Fundamentals Supporting Long Bias
• Seasonality: Q4 typically brings rising Heating Degree Days across the Northern Hemisphere; winter risk premia often get priced ahead of the draw season.
• LNG pull: Ongoing ramp in global LNG demand + incremental U.S. export capacity tends to tighten the domestic balance on cold forecasts or unplanned outages elsewhere.
• Supply discipline: Gas rig counts have lagged after the 2024 price slump; that slower supply response can tighten later-year balances if weather cooperates.
• Weather & Gulf risk: Peak hurricane season can interrupt Gulf production and processing, periodically supporting price.
• Europe draw season: As EU storage transitions from injection to draws, import needs rise, keeping a bid under seaborne gas.
Trade Plan:
• Entry: From weekly support (see chart).
• Management: Trail below fresh higher lows on the daily; take partials at fib/structure levels; let a runner target the upper band if momentum broadens.
What Breaks the Thesis
• A persistently warm Q4, outsized storage overhang into winter, major LNG outages/delays, or a renewed surge in production that swamps demand.
Note: Please remember to adjust this trade idea according to your individual trading conditions, including position size, broker-specific price variations, and any relevant external factors. Every trader’s situation is unique, so it’s crucial to tailor your approach to your own risk tolerance and market environment.
Natural Gas Bulls Eye 5.000 as Market Shows Overbought Trap🔥 NATURAL GAS DAY TRADE BLUEPRINT — BULLS TARGETING THE 5.000 ZONE! 🔥
**📈 XNG/USD — “NATURAL GAS” Commodities CFD
Market Trade Opportunity Guide (Day Trade)**
🧭 TRADE PLAN (Bullish Momentum Outlook)
Asset: XNG/USD “NATURAL GAS”
Plan: Bullish
Entry: Any price level based on your strategy
🛡️ STOP LOSS SETUP
Stop Loss: This is thief SL @ 4.700
Dear Ladies & Gentleman (Thief OG's), adjust your SL based on your own strategy & your risk conditions.
Note: Dear Ladies & Gentleman (Thief OG's), I am not recommending to set only my SL. It’s your choice — you make money & take money at your own risk.
🎯 TARGET ZONE
Police barricade acts as a strong resistance + market is overbought + a trap is visible, so escape with profits.
OUR Target: 5.000
Note: Dear Ladies & Gentleman (Thief OG's), I am not recommending to set only my TP. It’s your choice — you make money & take money at your own risk.
🔗 RELATED PAIRS TO WATCH (Correlation & Key Notes)
Here are highly relevant pairs connected to Natural Gas through USD strength, risk sentiment, energy market flows, and commodity-currency behavior:
1️⃣ USD/CAD (🇺🇸 USD vs 🇨🇦 CAD)
🔑 Key Points / Correlation:
Canada is a major energy exporter, so CAD often strengthens when energy (including Natural Gas) rises.
If XNG/USD pumps, CAD may gain → USD/CAD can show downside pressure.
Watch for correlation shifts during high-impact USD news.
2️⃣ WTI Crude Oil – USOIL (🛢️ Energy Sector Lead Indicator)
🔑 Key Points / Correlation:
Oil and Natural Gas are part of the same energy complex; they often move in tandem.
Strong oil = strong sentiment for energy markets.
If USOIL is bullish, it often supports XNG upside continuation.
3️⃣ DXY – US Dollar Index (💵 USD Strength Barometer)
🔑 Key Points / Correlation:
XNG/USD is priced in USD.
Strong DXY = natural gas usually corrects.
Weak DXY = commodity prices typically lift.
Always check DXY trend before entering Natural Gas trades.
4️⃣ EUR/USD (💶 Major USD Flow Indicator)
🔑 Key Points / Correlation:
Higher EUR/USD = weaker USD = bullish pressure on XNG/USD.
When EUR/USD is rising strongly, most USD-denominated commodities get a tailwind.
5️⃣ USD/CHF (🇺🇸 USD vs 🇨🇭 CHF — Safe-Haven Gauge)
🔑 Key Points / Correlation:
Natural Gas rises during risk-on conditions.
USD/CHF dropping signals safe-haven outflow → adds strength to commodity markets like XNG.
6️⃣ GBP/USD (🇬🇧 GBP vs USD — USD Sentiment Mirror)
🔑 Key Points / Correlation:
GBP/USD rising = weaker USD = supports Natural Gas bullish legs.
Acts as a secondary USD trend confirmation pair.
7️⃣ AUD/USD (🇦🇺 Commodity Currency Pair)
🔑 Key Points / Correlation:
AUD is a commodity-linked currency; rises when global commodities strengthen.
AUD/USD strength can confirm an overall commodity-bullish environment supporting XNG upside.
📌 FINAL NOTE
Trade smart, monitor correlations, and adjust risk according to your own strategy — protect capital first, profit next. 🔥📊

Natural Gas Price Nears Three-Year High in Early DecemberNatural Gas Price Nears Three-Year High in Early December
In mid-November, analysing the XNG/USD chart, we noted a rise in natural gas prices, outlined a system of trend channels, and suggested a possible pullback scenario.
Indeed, since then (as indicated by the arrow), U.S. gas prices retreated to the lower boundary of the orange ascending channel, forming a low at point B. From late November, renewed buying activity has been observed, driven by:
→ Seasonal factor: U.S. forecasts for December indicate below-average temperatures, sharply increasing demand for heating and electricity.
→ Export and geopolitics: The U.S. is exporting record volumes of liquefied natural gas (LNG). Europe continues to purchase U.S. gas to replace Russian supplies, while demand in Asia is also rising.
→ Anticipation of shortages: Due to high exports and early cold weather, traders are factoring in the risk that storage levels may deplete faster than usual.
Technical Analysis of XNG/USD
Price is currently near a resistance zone formed by:
→ The upper boundary of a broad descending channel, extended following a bullish breakout in late October.
→ The $4.800/MMBtu level, near which a peak formed in March.
→ The psychological $5.000/MMBtu mark.
At the same time, price action indicates bulls remain in control:
→ The lower boundary of the orange channel acts as support.
→ Low B resembles a false bearish breakout of low A, trapping short sellers who expected a breakdown.
→ Long lower wicks at low B indicate strong buying pressure.
Given this, it is reasonable to suggest that if U.S. gas prices failed to hold above $4.800/MMBtu in mid-November, December could prove more favourable for bulls, potentially establishing a three-year high.
This article represents the opinion of the Companies operating under the FXOpen brand only. It is not to be construed as an offer, solicitation, or recommendation with respect to products and services provided by the Companies operating under the FXOpen brand, nor is it to be considered financial advice.

Is This the Start of the Next Natural Gas Upswing?💨 Natural Gas (XNG/USD) — “Profit Pathway Setup” 🎯 Swing / Day Trade Edition
📊 Market Overview:
The Energies Market is heating up — and Natural Gas is showing its next potential boom move! After a confirmed Moving Average Breakout, bulls are sneaking back in. 🕵️♂️
This setup blends discipline + creativity, using the Thief-Trader layered entry method — designed to catch price action efficiently while minimizing emotional errors. ⚙️
⚔️ Trade Plan (Bullish Setup):
Entry Zones (Layered Buys):
🟩 3.500
🟩 3.600
🟩 3.700
(You can expand your buy layers depending on your own comfort and risk plan.)
Stop-Loss (Thief SL):
🧯 3.350 — just below the nearest lower-low candle wick.
💬 Dear Ladies & Gentlemen (Thief OG’s) — this SL is a personal style choice, not a fixed rule. Manage your risk your way.
Target (Profit Escape Zone):
🎯 4.100 — a strong resistance + overbought + trap + distribution zone.
💬 Reminder: I’m not forcing my TP; you’re the boss of your own bag — make your profits, then take them! 💰
📈 Why This Setup Works:
🧠 Technical Confirmation: MA breakout = bullish continuation in progress.
🎯 Layering Strategy: Multiple limit orders reduce average cost + improve flexibility.
🏗️ Structural Setup: Clear accumulation → breakout → markup pattern emerging.
🧩 Exit Logic: Resistance + trap-zone = high-probability exit zone for profit capture.
🌍 Related Assets to Watch (Correlation Check):
💹 NYMEX:NG1! — Natural Gas futures benchmark, strong global mirror.
AMEX:UNG — U.S. NatGas ETF; sentiment confirmation.
🛢️ BLACKBULL:WTI / BLACKBULL:BRENT — closely tied to energy flow; when oil strengthens, gas often follows.
⚡ TVC:DXY — dollar strength can inversely impact commodity demand.
💵 FX:EURUSD — macro correlation to risk appetite across energy & FX.
Keep eyes on these pairs — their momentum helps confirm or contradict your NatGas bias. 👀
📌 Key Takeaways:
✅ Trend Bias: Bullish
💪 Setup Type: Swing / Day Trade hybrid
🧮 Risk : Reward: Favorable above 1 : 3
⏳ Holding Window: Short-term → Mid-term (2 – 5 days typical)
🧭 Trade Management: Stick to your plan — don’t chase, layer smart.
⚠️ Pro Tip:
If price breaks below 3.350, it’s a signal to step aside — no hero moves. 🛑
Price structure > emotions. Stay patient, and let the plan do the heavy lifting. 🧘♂️
✨ “If you find value in my analysis, a 👍 and 🚀 boost is much appreciated — it helps me share more setups with the community!”
#NaturalGas #XNGUSD #EnergyTrading #SwingTrading #DayTrading #TechnicalAnalysis #BreakoutStrategy #CommodityTrading #ForexTrading #TradingIdeas #RiskManagement #MarketAnalysis #EnergyMarkets #TradingView #ChartAnalysis

Natural Gas Prices Hover Near a Three-Year HighNatural Gas Prices Hover Near a Three-Year High
As the XNG/USD chart shows today, natural gas prices are trading close to the March peak, which is the highest level since December 2022.
According to Trading Economics, the rise in gas prices has been driven by several factors:
→ Despite short-term warming in the US, weather models point to colder conditions ahead.
→ LNG exports remain elevated, as European buyers continue seeking alternatives to Russian gas. In November, average shipments across the eight major US terminals reached 17.8 billion cubic feet per day, exceeding the previous record of 16.7 billion in October.
→ The International Energy Agency expects global demand for oil and gas to continue rising until 2050, reflecting uncertainties surrounding the pace of the energy transition.
At the same time, chart analysis suggests that the upside potential may be limited.
Technical Analysis of XNG/USD
Price action is approaching a major resistance area, formed by:
→ the upper boundary of the channel, widened after the bullish breakout in late October;
→ the psychological level of $5.000 per MMBtu;
→ the previously mentioned March high.
Meanwhile, the more than 50% rally since early autumn has been significant, and long-position holders may be tempted to take profits. Therefore, if the price attempts to break above these resistance levels, it may result in a false bullish breakout (a buyer’s trap) followed by a pullback.
This article represents the opinion of the Companies operating under the FXOpen brand only. It is not to be construed as an offer, solicitation, or recommendation with respect to products and services provided by the Companies operating under the FXOpen brand, nor is it to be considered financial advice.

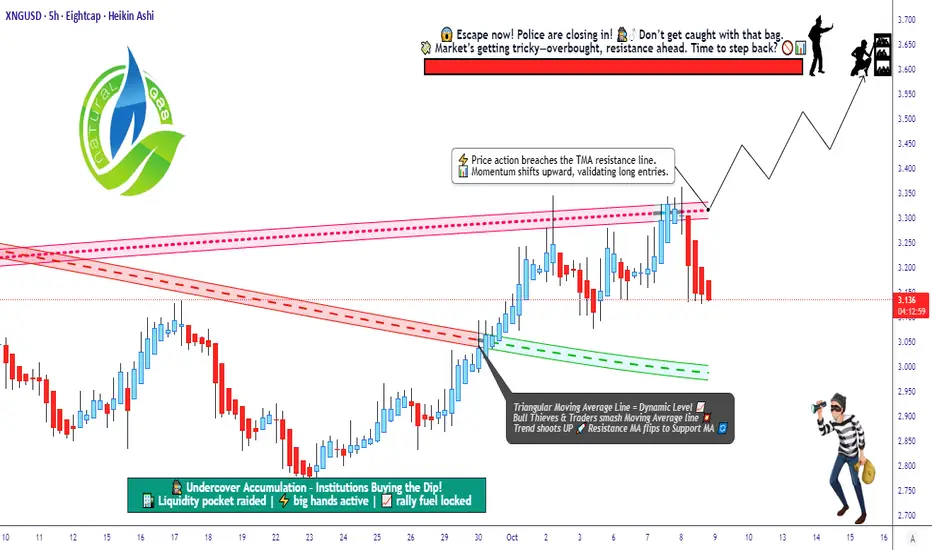
Is This the Start of a Fresh Bull Run in Natural Gas (XNG/USD)?🎯 XNG/USD Natural Gas: The Great Energy Heist! 💰⛽
📊 Market Overview
Natural Gas is setting up for a classic "Ocean's Eleven" style breakout! The 382 Triangular Moving Average has been breached by the bulls, and the trend confirmation is IN. Time to plan our strategic entry into this energy market opportunity!
🔥 The Master Plan: BULLISH Setup
Strategy Type: Swing/Day Trade - Cash Flow Management
Confirmation Signal: 382 Triangular Moving Average breached to the upside ✅
Entry Method: Buy the dip when TMA confirms the bullish trend
💎 Layered Entry Strategy (Scale In Like a Pro!)
⚠️ IMPORTANT: You can enter at ANY price level after the breakout confirmation! Set alerts on your trading platform to catch the breakout easily.
Recommended Entry Layers:
🎯 Layer 1: $3.100
🎯 Layer 2: $3.150
🎯 Layer 3: $3.200
🎯 Layer 4: $3.250
🎯 Layer 5: $3.300
This layering approach helps average your entry and reduces risk!
🛡️ Risk Management Zone
Stop Loss: $3.000
⚠️ Disclaimer: This is MY stop loss level based on my risk tolerance. YOU should determine your own stop loss based on YOUR risk management rules and account size. Trade at your own risk!
🎪 Target Zone: The Great Escape!
Primary Target: $3.600 🚀
Why $3.600? This level acts as:
🚧 Strong resistance (Police barricade zone!)
📉 Oversold bounce area
Potential bull trap zone
Exit Strategy: Lock in profits BEFORE reaching the target zone. Secure your gains and don't get greedy!
⚠️ Disclaimer: This is MY target based on my analysis. YOU should take profits at levels that match YOUR trading plan and risk tolerance. Always trade at your own risk!
🔗 Correlated Assets to Watch
Keep an eye on these related markets for confirmation:
AMEX:UNG (United States Natural Gas Fund) - Direct correlation
AMEX:BOIL (2x Leveraged Natural Gas ETF) - Amplified moves
AMEX:KOLD (Inverse Natural Gas ETF) - Opposite direction
AMEX:XLE (Energy Sector SPDR) - Broad energy sector correlation
NYMEX:CL1! (Crude Oil) - Energy sector correlation
COMEX:HG1! (Copper) - Industrial demand indicator
Key Correlation Point: Natural Gas often moves with broader energy sentiment. Watch crude oil and energy sector strength for confirmation of bullish momentum.
📝 Key Technical Points
✅ 382 Triangular Moving Average breakout = Trend confirmation
✅ Layered entries reduce average cost and risk
✅ Multiple timeframe confluence at target zone
✅ Energy sector showing relative strength
✅ Risk-reward ratio favors bulls above $3.000
⚡ Trading Notes
This setup combines technical precision with proper risk management. The TMA breach is a strong momentum indicator, and the layered entry approach allows for strategic position building. Remember to manage your position size according to your account and always have a plan before entering!
🎭 The "Thief Style" Disclaimer
🎪 FOR ENTERTAINMENT & EDUCATIONAL PURPOSES ONLY!
This "thief style" trading strategy is presented with a fun, heist-themed twist to make technical analysis more engaging. This is NOT financial advice. I'm not a licensed financial advisor, and you should NOT blindly follow any trading setup. Always do your own research, consult with licensed professionals, and never risk more than you can afford to lose. Trading is risky, and past performance doesn't guarantee future results. This is my personal analysis shared for educational purposes only! 🎭
✨ If you find value in my analysis, a 👍 and 🚀 boost is much appreciated — it helps me share more setups with the community!
#NaturalGas #XNG #XNGUSD #EnergyTrading #SwingTrading #DayTrading #TechnicalAnalysis #TriangularMovingAverage #TMA #Breakout #BullishSetup #TradingStrategy #RiskManagement #LayeredEntry #CashFlowManagement #EnergyCommodities #NatGas #CommodityTrading #TrendTrading #PriceAction
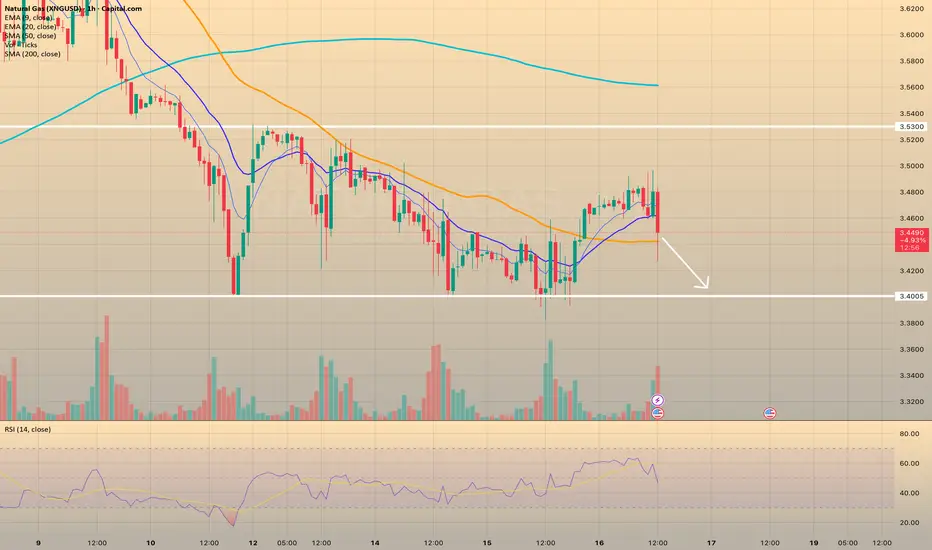
U.S. Natural Gas — mild weather weighs, trend stays bearishU.S. Natural Gas — mild weather weighs, trend stays bearish
U.S. natural gas fell for a third straight session as the latest EIA report showed an 80 Bcf build, leaving inventories 4.3% above the 5-year average. Analysts cite mild weather and an oversupplied market as key drivers.
Production remains near record highs at 107 Bcf/day (+3.8% YoY), while demand has dropped 6% YoY. Despite a slightly smaller-than-expected storage build, fundamentals stay weak.
Technically, prices broke below local support at $3.40, confirming short-term bearish momentum. On October 17, natural gas prices bounced back, retracing part of Thursday’s losses. Temporary support emerged near $3.36–$3.35, but the recovery looks like a dead-cat bounce.
Scenarios:
🔻 Bearish (primary): Below $3.40–$3.42, downside targets remain $3.30–$3.25.
🔺 Bullish (alternative): Above $3.42, a rebound toward $3.50–$3.53 is possible, though momentum favors sellers.
In Europe, gas prices stay steady near €32/MWh with 83% storage capacity, while Russian attacks cutting Ukrainian output by ~60% add supply risks heading into winter.

Natural Gas — Pressure persists, but a rebound setup buildNatural Gas (Nov)— Pressure persists, but a rebound setup build
Natural gas futures extended losses to a 3-week low, weighed down by forecasts for warmer-than-normal U.S. weather through late October. Atmospheric G2 expects above-average temperatures across most of the country between October 20–29, limiting heating demand and capping price recovery attempts.
📉 Fundamentals:
- U.S. (Lower 48) dry gas production: 108.5 bcf/day (+5.8% YoY)
- Demand: 71.3 bcf/day (-4.8% YoY)
- Storage levels: +4.5% above 5-year average, with inventories expected to rise +83 bcf this week (EIA consensus)
Active gas rigs: 120 (+2 w/w)
🔥 Geopolitical Context:
European gas futures climbed ~2% after Russian strikes on Ukraine’s gas infrastructure cut ~60% of national output, forcing shutdowns at DTEK and Naftogaz sites. The disruption raised supply concerns at the start of the heating season, with EU storage now at 83% capacity versus 93.2% last year.
📊 Technical Outlook:
Price is consolidating within the $3.40–$3.53 range, forming a short-term sideways channel. RSI is neutral near 44, and momentum remains weak. A break below $3.40 could trigger a slide toward $3.30, while a close above $3.53 may open the way to $3.60–$3.65.
Scenario Outlook
🔻 Bearish scenario (main):
A confirmed breakdown below $3.40 would expose $3.32–$3.30 as the next target zone.
Momentum indicators support potential continuation lower.
🔺 Bullish scenario (alternative):
If buyers reclaim $3.53, we could see a short-covering rally toward $3.60–$3.65, but resistance above remains heavy due to the 200 SMA ceiling.
Summary
Natural Gas remains range-bound but weak, with sentiment tilted bearish due to macro fundamentals (warm weather + ample storage).
Traders should watch for a decisive break of the $3.40–$3.53 zone to define the next directional move.
Profit Blueprint on XNG/USD! Is This the Bullish Energy Move?😎 Steal the Show with XNG/USD: The "Thief" Day Trade Blueprint! 🚨
Asset: XNG/USD (Natural Gas CFD) - Energies MarketVibe: A cheeky, calculated heist to snag profits with a slick Ichimoku breakout strategy! 💰
📜 The Master Plan: Ichimoku Kijun Line Breakout
🎯 Confirmed Bull Trend: The price has broken above the Ichimoku Kijun-Sen line, signaling a bullish move in the Natural Gas CFD market. This breakout is our green light to execute the "Thief Strategy" with precision!
🕵️♂️ Entry: The Thief’s Layered Approach
🔍 How It Works: The "Thief Strategy" uses a layering method with multiple buy limit orders to scale into the trade safely, protecting your capital while maximizing profit potential. No fear, just finesse! 😎
Buy Limit Layers:
🥉 2.960
🥈 2.980
🥇 3.000
🏆 3.020
💡 Pro Tip: Add more layers based on your risk appetite and account size for extra flexibility!
Alternative Entry: If you prefer a single entry, jump in at the current market price after the Kijun-Sen breakout confirmation. Your call, Thief OG! 😏
🛑 Stop Loss: Protect Your Loot!
🚨 Thief Stop Loss: Set at 2.900, just below the breakout level to guard against reversals.
Customize It: Adjust your stop loss based on your risk tolerance and strategy. This is your heist—own it!
Note: Dear Thief OG’s (Ladies & Gentlemen), I’m not dictating your stop loss. Manage your risk and keep your profits safe! 💪
🎯 Target: Escape Before the Trap!
🏃♂️ Profit Target: Aim for 3.150, where strong resistance, overbought conditions, and a potential trap await. Cash out before the "police" (market reversal) catch you!
Note: You’re the mastermind here. Take profits at your own discretion—don’t let me cap your gains! 💸
🔗 Correlation & Related Markets to Watch
Natural Gas (XNG/USD) often correlates or reacts with:
ICMARKETS:XBRUSD (Crude Oil Brent) – Energy sector movements can impact gas demand.
FOREXCOM:USOIL (Crude Oil WTI) – Supply/demand shocks in oil can spill into gas pricing.
OANDA:XAUUSD (Gold) – Inflation hedge & safe-haven flows can influence energy sentiment indirectly.
TVC:DXY (US Dollar Index) – A stronger/weaker dollar impacts commodity pricing.
SP:SPX (S&P 500 Index) – Risk-on/risk-off sentiment across markets.
Keeping an eye on these pairs helps confirm energy market momentum and macro sentiment.
Key Correlation Point: Natural Gas prices often lead or lag other energy markets due to supply/demand dynamics and seasonal factors. Confirm your trade with cross-asset analysis for a sharper edge! 📊
🧠 Why This Setup Rocks
Ichimoku Precision: The Kijun-Sen breakout is a reliable signal for short-term bullish momentum.
Layered Entry Safety: The Thief Strategy’s multiple limit orders spread risk and allow scaling without overcommitting.
Risk Management: Clear stop loss and target levels keep your heist disciplined and profitable.
Market Context: Energy markets are volatile, but this setup leverages technical confirmation to ride the wave. 🌊
✨ If you find value in my analysis, a 👍 and 🚀 boost is much appreciated — it helps me share more setups with the community!
#ThiefStrategy #XNGUSD #NaturalGas #Ichimoku #DayTrading #EnergyMarkets #TradingView

Gas prices surge on cold forecastsGas prices surge on cold forecasts
On Oct 7 european natural gas jumped to a six-week high, extending a sharp rally as colder weather forecasts and weaker renewable output boosted heating demand expectations. Temperatures in France and Germany are set to fall about 2°C below seasonal norms from mid-October.
The market also reacted to Russia’s largest missile strikes on Ukraine’s gas infrastructure since the war began, heightening concerns over potential supply disruptions. Despite the risks, EU storage remains robust at 82.8% of capacity, with Italy at 93%, France at 92%, and Germany at 76.3%.
In the UK, gas futures climbed also as the Met Office warned of a sharp temperature drop ahead, likely lifting heating demand. Analysts noted that if damage to Ukrainian facilities proves significant, Europe may need to increase pipeline and LNG imports to stabilize supply.
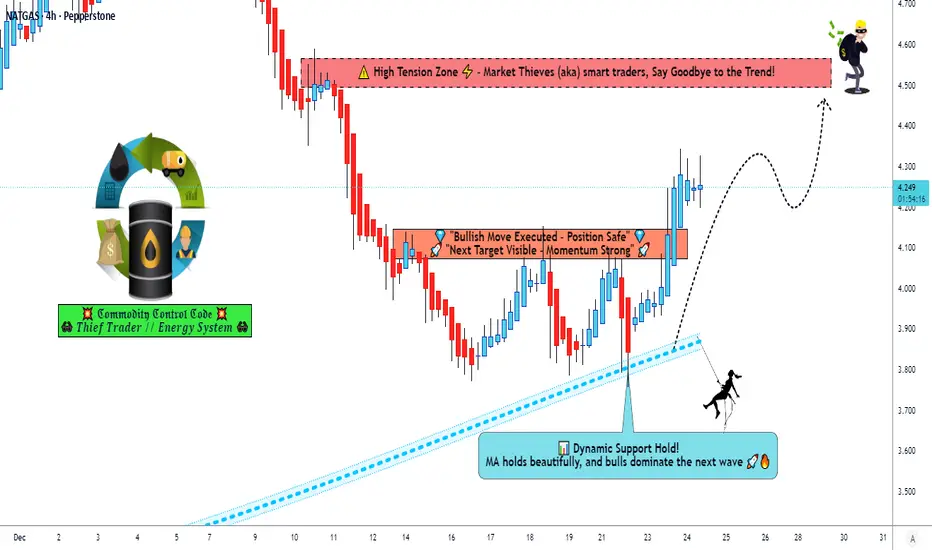
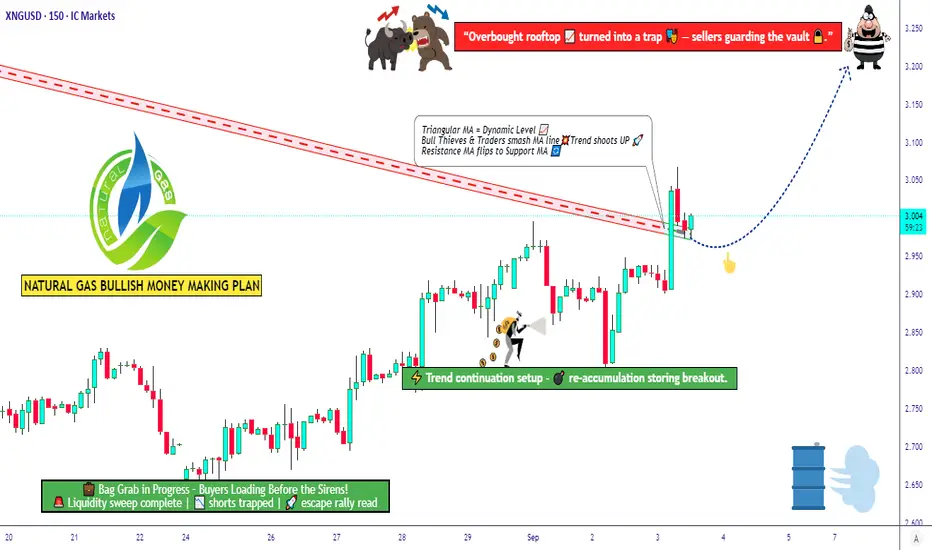
Natural Gas Market Outlook ‖ Bullish Breakout with Risk Control💎 XNG/USD Natural Gas – Thief Trader’s Money Loot Plan (Swing/Scalping) 💎
🎯 Trade Plan (Bullish Setup)
Strategy: Bullish triangular moving average breakout, aligned with Fibonacci 0.382 level.
Entry (Layered Style): Using multiple limit orders (Thief layering strategy). Example entries:
$2.900
$2.950
$3.000
(You may add more layers depending on your risk appetite.)
Stop Loss: $2.800 (Thief SL).
⚠️ Note: Adjust SL based on your own risk tolerance and strategy.
Target Zone: Major seller pressure expected near $3.400 — our escape target set at $3.200.
📌 Reminder: Take profit at your own discretion — you control your loot, not me.
❓ Why This Setup?
✅ Technical Basis: Bullish triangle breakout + Fibonacci 0.382 retracement signals continuation upside.
✅ Layered Entry Advantage: Reduces risk by scaling in across levels, catching volatility without FOMO.
✅ Market Structure: Current consolidation near $2.93 provides a solid base for accumulation.
✅ Sentiment Balance: Both retail & institutional lean bullish, supporting potential breakout momentum.
✅ Macro Tailwinds: Strong LNG export growth and expected winter heating demand underpin the long thesis.
This plan aligns both short-term technicals and long-term fundamentals, creating a high-probability swing/scalping opportunity.
🌟 Natural Gas (XNG/USD) Market Report - September 3, 2025 🌟
📊 Current Price Snapshot
Spot Price: $2.93 per MMBtu (Henry Hub benchmark) 📉
(Holding steady after recent dips, reflecting balanced supply/demand.)
😊 Trader Sentiment Outlook
Retail Traders: 55% Bullish 🟢 | 35% Bearish 🔴 | 10% Neutral ⚪
(Optimism from LNG demand + weather, but some concern on inventories.)
Institutional Traders: 60% Bullish 🟢 | 30% Bearish 🔴 | 10% Neutral ⚪
(Focused on exports & production stability, while cautious on oversupply.)
📌 Overall Mood: Mildly positive — upside potential if weather demand rises.
😨 Fear & Greed Index
Current Level: Neutral (Score ~50/100) ⚖️
Fear factors: Storage 5% above 5-year avg, mild summer demand.
Greed drivers: LNG exports + winter demand expectations.
Market vibe = balanced — neither panic selling nor euphoric buying.
📈 Fundamental & Macro Score
Fundamental Score: 7/10 🟢
Strong LNG shipments (31% growth expected).
Inventories manageable, production +3% YoY.
Key watch: Permian & Haynesville supply shifts.
Macro Score: 8/10 🟢
Rising global energy needs (AI, data centers).
Autumn cooling trend boosts heating demand.
Asia’s growth keeps exports flowing.
🚀 Overall Market Outlook
Bias: Bullish (Long) 🟢📈 — ~60% confidence.
Natural gas could push toward $3.60/MMBtu by late 2025 if balances tighten and exports expand.
Winter could spark extra upside rallies ❄️🔥.
🔗 Related Pairs to Watch
FXOPEN:XNGUSD
NYMEX:NG1!
ICMARKETS:XBRUSD (Brent Crude)
FOREXCOM:USOIL (WTI Crude Oil)
OANDA:XAUUSD (Gold for risk hedge)
TVC:DXY (US Dollar Index – inverse correlation play)
✨ “If you find value in my analysis, a 👍 and 🚀 boost is much appreciated — it helps me share more setups with the community!”
#XNGUSD #NaturalGas #SwingTrading #Scalping #CommodityTrading #EnergyMarkets #Fibonacci #BreakoutStrategy #LayeringStrategy #TradingViewAnalysis #ThiefTrader
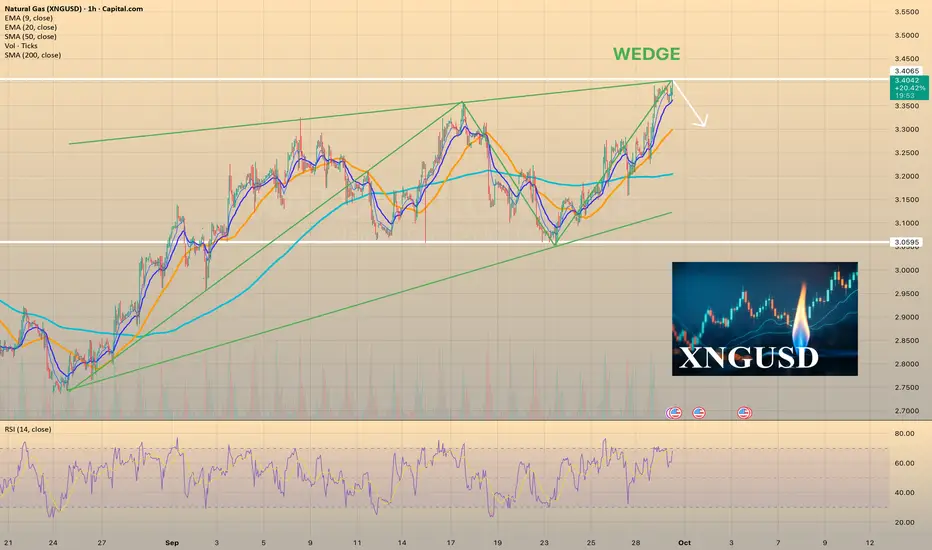
Natural Gas Price Hits 2.5-Month HighNatural Gas Price Hits 2.5-Month High
As the XNG/USD chart shows today, natural gas prices have risen above $3.600/MMBtu for the first time since mid-July.
According to media reports, the rise in gas prices has been driven by:
→ Weather models forecasting colder conditions, suggesting the heating season may begin earlier than expected;
→ An EBW Analytics Group note highlighting short-covering activity in the market, which has accelerated the rally (a short squeeze effect).
At the same time, chart analysis suggests that the upside potential may be limited.
Technical Analysis of the XNG/USD Chart
Three factors might restrict further price growth:
→ The RSI indicator signals extreme overbought conditions.
→ Price has moved above the upper boundary of the channel (which has been in place since August), indicating that natural gas may be overvalued.
→ If we view September’s moves as a 3.065–3.315 range, then the target following the breakout on 29 September should be calculated based on the range height — pointing to 3.645. This target has already been reached.
Thus, we could assume that the market is vulnerable to a pullback (for example, towards the median of the blue channel). At the same time, the steep upward trajectory (highlighted in orange) remains intact.
Therefore, we may see an attempt at a bullish breakout of the July high near the 3.65 level — although, given the factors mentioned above, such a breakout could well prove to be a false one.
This article represents the opinion of the Companies operating under the FXOpen brand only. It is not to be construed as an offer, solicitation, or recommendation with respect to products and services provided by the Companies operating under the FXOpen brand, nor is it to be considered financial advice.

U.S. Gas prices recoverU.S. Gas prices recover
On September 29, natural gas finished higher, reversing earlier losses. Prices had initially been pressured by forecasts of warmer-than-normal weather in the coming weeks, but later gained support from other factors — including data showing stronger export demand for U.S. natural gas.
According to EBW Analytics, the above-average warmth is expected to limit natural gas demand through the first half of October. Citing DTN’s temperature forecasts, EBW noted that U.S. storage is projected to grow by about 270 bcf between September 26 and October 16. This means that whenever colder weather eventually arrives, markets will be well supplied, which should help cushion any price spikes.
Now natural gas (XNGUSD) are trading at $3.39.
In Europe storage facilities across the EU have reached 82.5% capacity ahead of winter, according to Gas Infrastructure Europe (GIE). On September 28, EU countries injected 206 million cubic meters of gas into storage, while withdrawals declined to 28 million cubic meters. Total storage now stands at 90.9 billion cubic meters — the seventh-highest September level in the historical record.
Despite this progress, storage levels remain 6.9 percentage points below the five-year seasonal average and well under last year’s 94.2% mark for the same date. Under European Commission rules, member states must fill storage sites to at least 90% between October 1 and December 1 each year, though up to 10% flexibility is permitted under difficult conditions. These requirements are contributing to upward pressure on European gas prices.
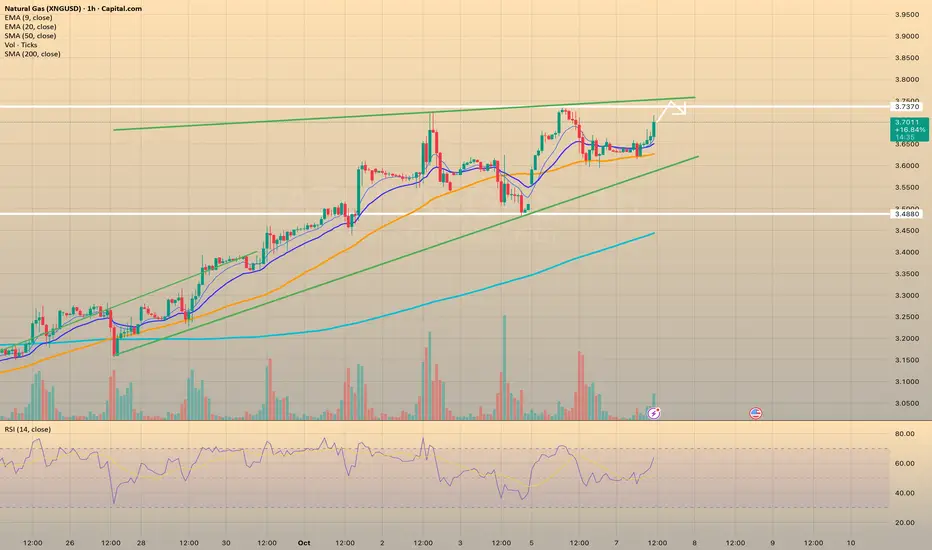
U.S. Natural Gas holds near 10-week highsU.S. Natural Gas holds near 10-week highs
U.S. natural gas futures hovered around $3.20/MMBtu, a ten-week high, supported by lower output. Production in the Lower 48 slipped to 107.4 bcfd in early September from a record 108.3 bcfd in August. The earlier supply surge fueled large storage injections, leaving inventories 6% above the five-year average and 1% higher year-over-year.
On the demand side, forecasts call for above-normal warmth into early October, while LNG feedgas flows averaged 15.7 bcfd—slightly below August levels.
Longer-term risks remain. Global LNG capacity is projected to expand 60% by 2030, with half of the new supply coming from the U.S. This raises the threat of oversupply, potentially pressuring prices in Asia and Europe. Still, strong domestic demand—driven by slower renewable deployment and rising AI-related power needs—may lend support to U.S. prices.
In Europe, gas inventories stand at 82.3% capacity, with France and Italy above 90% and Germany at 76.6%. Softer Asian demand due to milder cooling needs has freed up cargoes for Europe, helping push prices lower.
Geopolitical risks remain in focus. NATO–Russia tensions and potential sanctions on Russian energy—including Europe’s ban on seaborne imports by 2027—could disrupt supply and limit downside.

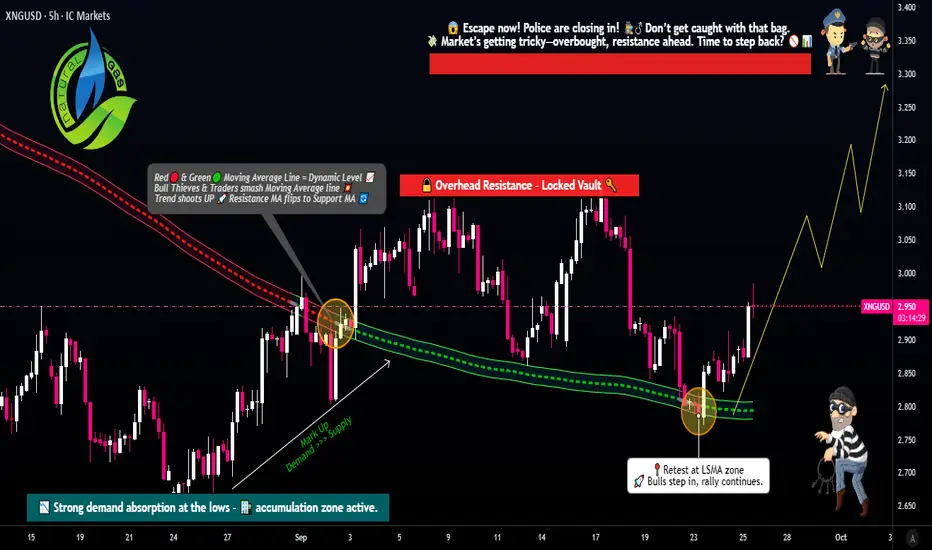
XNG/USD Swing Trade Plan – Entry, Stop, and Target Explained🚀 NATURAL GAS (XNG/USD) – Energies Market Wealth Strategy Map ⚡🔥
(Swing Trade Setup – Thief Layered Style)
📊 Plan
✅ Bullish confirmation spotted with LSMA pullback 🟢
✅ Thief’s unique layering entry strategy 🎭 — stacking multiple buy limit orders to sneak into the market like a pro.
Layered Entry Levels:
Buy Limit @ 2.800 🧩
Buy Limit @ 2.850 🧩
Buy Limit @ 2.900 🧩
Buy Limit @ 2.950 🧩
(Feel free to add more layers based on your own risk appetite.)
🛡️ Risk Management
Stop Loss (Thief SL): ⚠️ @ 2.750
(Note: Dear Ladies & Gentlemen – Thief OG’s – this SL is my style. Always set your own SL according to your risk.)
🎯 Target Zone
👮 Police Barricade spotted around 3.300 🚨
Here we have:
Strong resistance wall 🧱
Overbought signals 📈
Potential trap zone
👉 Take your profits before the market police catch you! Escape with your bags full 💼💨
(Note: Dear Ladies & Gentlemen – Thief OG’s – this TP is my style. Always set your own target according to your profit goals.)
🔍 Related Pairs & Correlations
FXOPEN:XNGUSD (Natural Gas) – our main thief play 🎭
BLACKBULL:WTI / TVC:UKOIL (Crude Oil & Brent) 🛢️ – often show energy sector momentum correlation
ICMARKETS:XBRUSD (Brent Crude) – watch for confirmation of energy strength 🔥
SP:SPX / TVC:DXY (S&P 500 & US Dollar Index) – dollar strength can pressure commodities
OANDA:XAUUSD (Gold) – safe haven vs energy volatility ⚡
Correlated markets can confirm direction or signal early reversals. Always watch the energy family together for big moves.
✨ “If you find value in my analysis, a 👍 and 🚀 boost is much appreciated — it helps me share more setups with the community!”
⚠️ Disclaimer: This is a thief-style trading strategy created just for fun & educational purposes. Not financial advice. Trade safe, trade smart.
#XNGUSD #NaturalGas #Commodities #SwingTrade #EnergyMarkets #LayeringStrategy #TradingCommunity #MarketThief #OGStyle