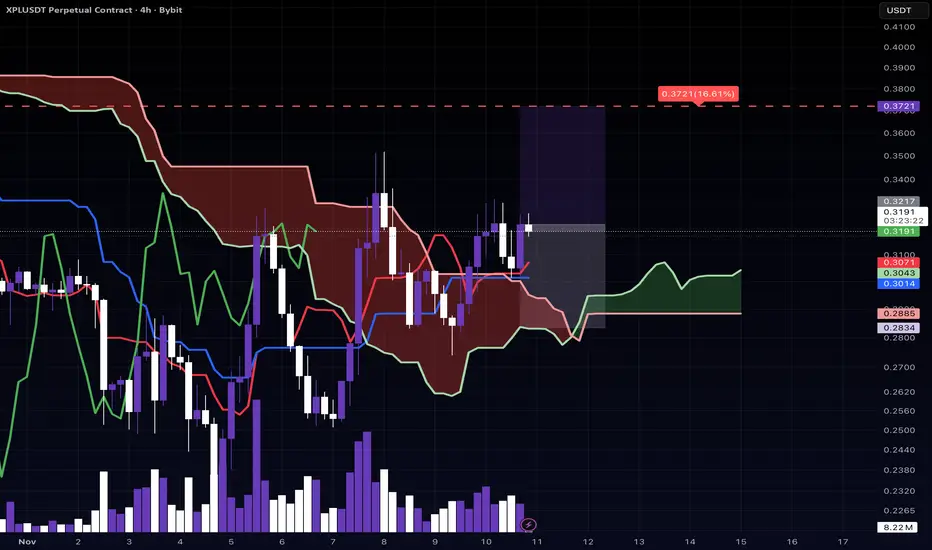
Do the Japanese Clouds Know Best? XPL Ready to Fly Ichimoku says “Go!” 🚀
XPL breaking above the cloud — Tenkan/Kijun ready to confirm.
Let’s see if the Japanese magic still works!
Xplusdt
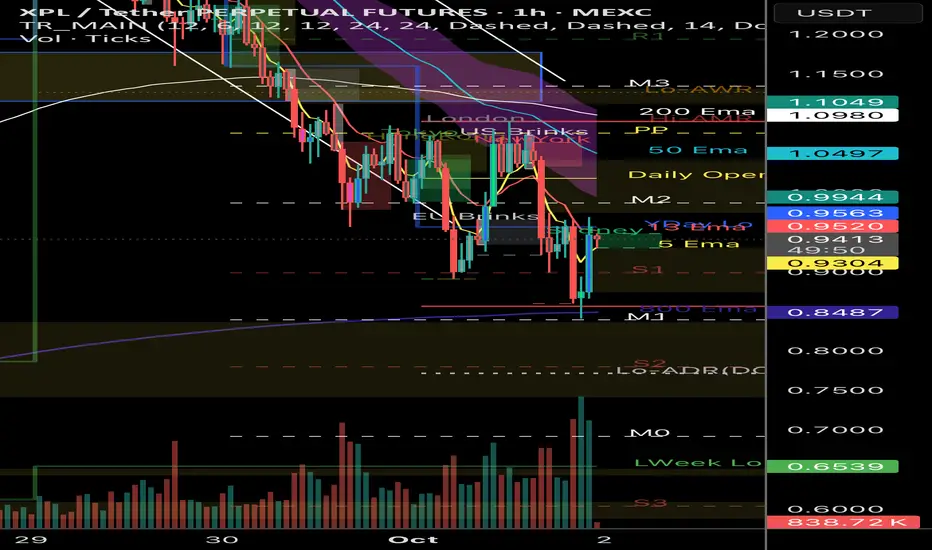
Plasma looking for support after a big fallXPL has been falling, and the only signs of support are on the H1. Looking for a market structure within this time frame has to be considered a quick move. The larger the structure, the better it is. However, given the stage of the market, anything can happen. Which means spot positions will give you the exposure you need without the added risk. At the moment, RR on 1h is healthy under the condition that the price continues to create a CHOCH.
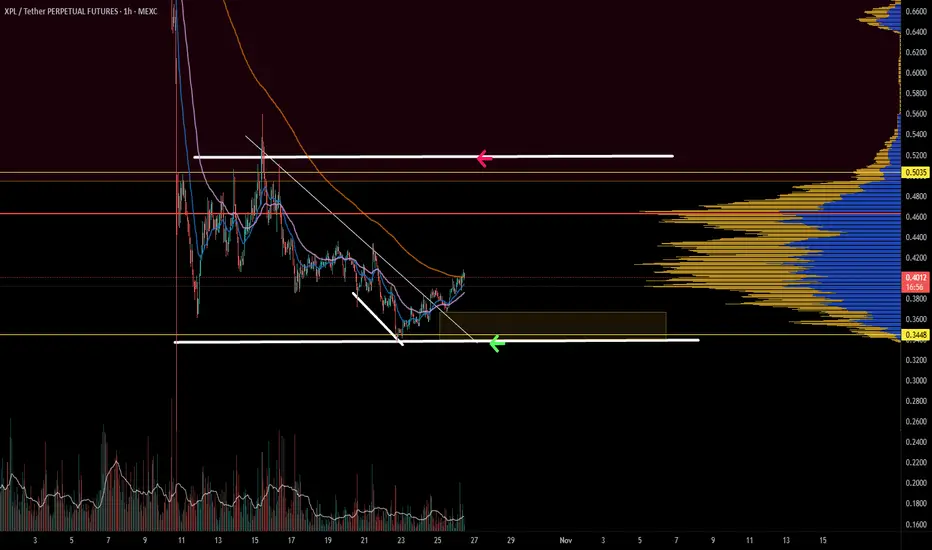
XPL : The rise of a star or an illusion?Hello friends
Technically, this currency has formed two important supports after its decline and a resistance level has been identified.
Note that for price growth, it is very, very important that resistance is broken, so don't go buying and then say why it didn't grow. We need volume for growth, and with volume, resistance is broken, and in that case, we can wait for the specified targets to move.
This coin is on the Swift blockchain in the DeFi space, which has attracted a lot of market attention, which could be very important, and many are investing in next-generation layer 1 networks and the powerful DeFi protocol instead of Ripple.
Of course, this project is very attractive on paper, but always observe capital management and avoid emotional decisions.
*Trade safely with us*

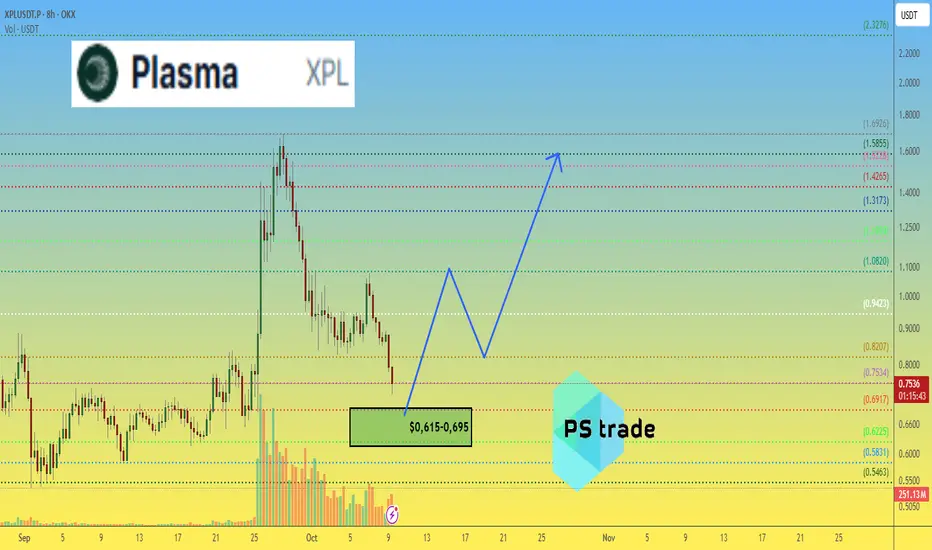
Plasma: A Fundamental and Technical Bet on Stablecoin PotentialToday we’re talking about Plasma, in my opinion the most interesting project in recent years. From a fundamental analysis perspective, it’s a must-have bet considering the potential of stablecoins in the near future and Tether’s involvement in the project. That said, from a technical analysis viewpoint, the price has bounced off the support created by Binance’s perpetual listing. I’d expect a quick acceleration toward $1.6, which is currently the most significant reversal point. At that moment, it will be crucial to see if the market is strong enough to break the all-time high and continue rising, or if the price will be rejected and fall back to the established support. In any case, the project has enormous potential, and at a $1 billion market cap, I believe it’s a great bet. Thanks to everyone for your attention.

Plasma XPL price analysis🤔 Hard to believe all this FUD around #XPL isn’t just a setup to let the big players buy cheaper 😏
🔹 The OKX:XPLUSDT chart has entered the previous consolidation zone — technically, it looks like the market is trying to build a solid base before the next move.
💎 Ideally, market makers and buyers won’t let the price drop below $0.6150–0.6950, which could become a perfect accumulation zone before the next wave up 🌊
🤔 What do you think — just short-term FUD or the start of a deeper correction
______________
◆ Follow us ❤️ for daily crypto insights & updates!
🚀 Don’t miss out on important market moves
🧠 DYOR | This is not financial advice, just thinking out loud
XPL Update📊 AMEX:XPL Update
AMEX:XPL is now approaching an important red resistance zone 🔴
A breakout above this key level is needed to signal a potential shift back to a bullish trend 📈

XPL - 20%+ UP!! Finally 🔥 Yesterday vs today: #XPL 22% up!
According to my plan:
TP3 hit ✅
TP4 ✅
Did you took this one?? 🤑
#DYOR

#XPL Falling Wedge📊 #XPL Falling Wedge 📈
🧠From a structural perspective, we are currently within the target zone of a bearish structure, so we should be looking for long positions in this area.
➡️From a chart perspective, the price has gradually compressed, forming a falling wedge pattern. We typically follow this pattern upwards, and it has already broken through the upper edge of the wedge and is currently undergoing a secondary test for confirmation.
Let's see if we can see another surge higher. 👀
🤜If you like my analysis, please like 💖 and share 💬
OKX:XPLUSDT.P

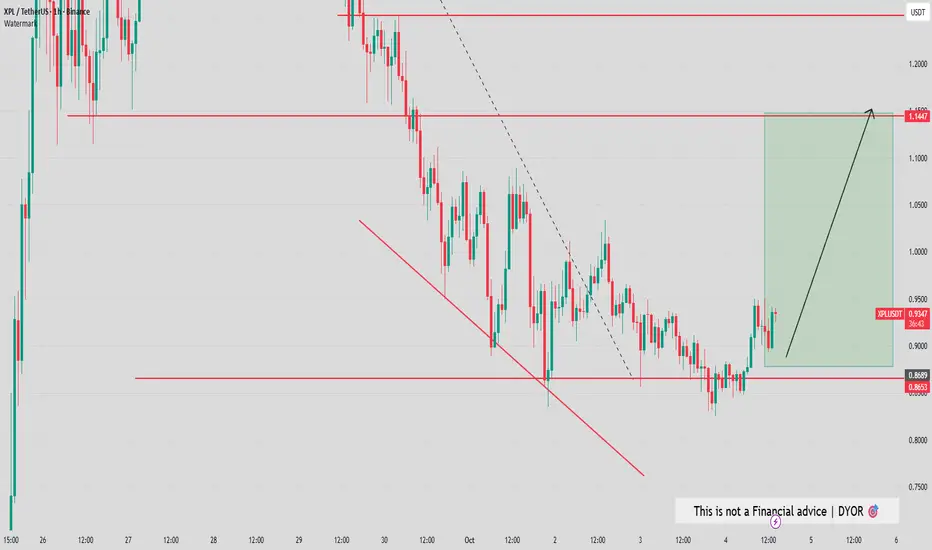
$XPL - Long Trade IdeaAMEX:XPL | 2h
Let's see if we can test the equilibrium here
Entry: .93-.90
Stoploss: below the low
Targets:
$1-$1.09
$1.16-$1.20
$1.24-$1.30

XPL - BULLISH REVERSAL IN PLAY! AMEX:XPL - I was right 2 days ago! Bottom is surely in! 🚀
Clean reversal wedge, bull div & breakout✅
Waiting for bulls to jump in 🚀
0.950🎯
1.00🎯
1.030🎯
1.080🎯
1.100🎯
1.160🎯
Invalidation: H4 candle close under 0.8450$
Told you yesterday',s NO INVALIDATION = No need to panic.
Respecting validation / invalidation trigger is a game changer! :)
#DYOR - not a financial advice

XPL / USDT Analysis
XPL/USDT Analysis (4H)
A descending wedge pattern is forming here — typically a bullish reversal setup.
Price has been consolidating tightly and is now testing the breakout zone around 0.87 USDT.
If the breakout confirms with volume, the potential upside target sits around 1.09 USDT, representing roughly a +22% move from current levels.
Key levels to watch:
Support: 0.84 – 0.86
Breakout Confirmation: Above 0.88
Target Zone: 1.05 – 1.10
Momentum is building — a clean breakout could trigger a short-term rally.
📈 Watch for confirmation before entering.

XPL - BIG WAVE LOADING?? AMEX:XPL chart looks very good and ready to fly on the daily basis! 📈
Double bottom daily ✅
Expect to see a 20%+ bull wave coming in soon!
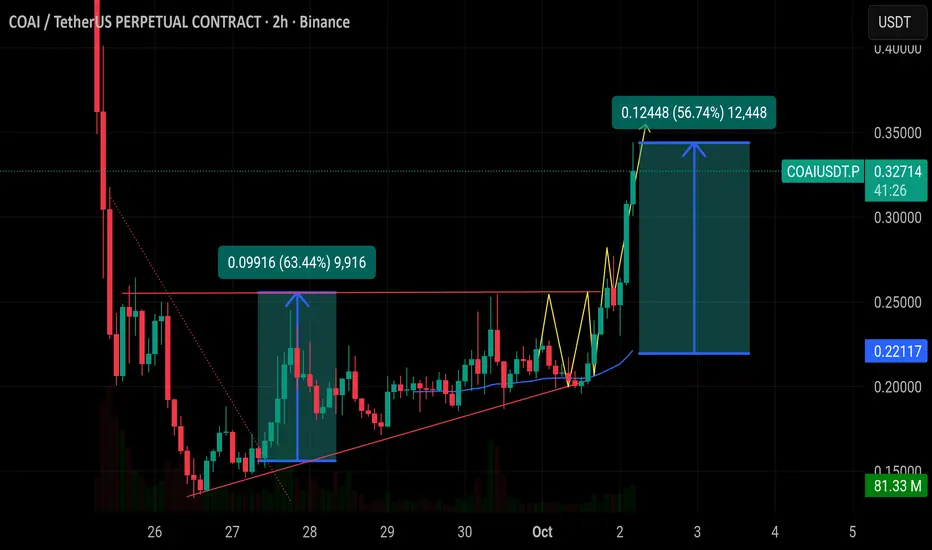
$COAI is pump 57% It broke out of a triangle pattern. $COAI is pump 57% It broke out of a triangle pattern. Now holding above the0.30 level. Support is around 0.25 for now. If this holds, next target is0.40. Trend is bullish with strong momentum. 🚀
BOTTOM IS IN FOR $XPL PLASMA Nice retrace after initial rally, time for next leg up in the coming days/weeks
Loaded up around $0.96 average
$XPL: Ready for another Leg Up?BINANCE:XPLUSDT | 1h
Crypto markets are heating up this week with significant action. Plasma’s launched its mainnet beta, securing over $2B in stablecoin liquidity and key integrations, positioning it as a top contender in the stablecoin Layer-1 space.
The chart shows a solid upward trend, surging to a local high of $1.69, and now consolidating around $1.50
Current resistance sits near $1.65; a rejection here could push prices toward support at $1.30–$1.40. Despite a 12.3% dip, the bullish structure remains intact. If bulls hold the $1.30–$1.40 zone, momentum could drive a breakout above $1.70. A break below $1.30 might see a retest of $1.12–$1.24 area.
XPL shows strong potential with no token unlocks until next year and a leading role in the stablecoin narrative, suggesting significant upside. Will XPL shrug off this dip for another rally, or will sellers take control?

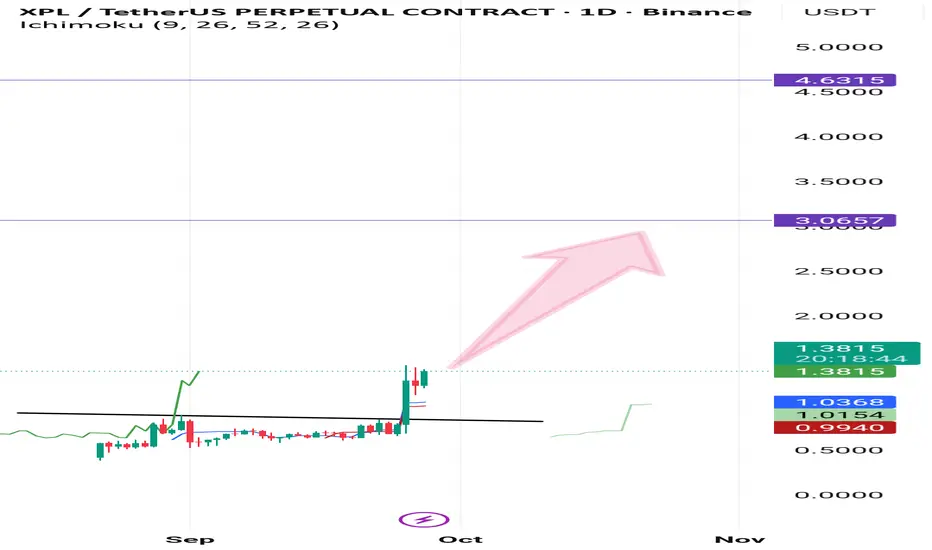
Long XPL/USDTXPL/USDT Trade Setup
Price is showing strong momentum and holding above key support. Current analysis suggests potential upside targets at 3.0 and 4.6.
Target 1: 3.0
Target 2: 4.6
As long as support levels hold, the bullish scenario remains valid. Traders should manage risk properly and adjust stops accordingly.
؟
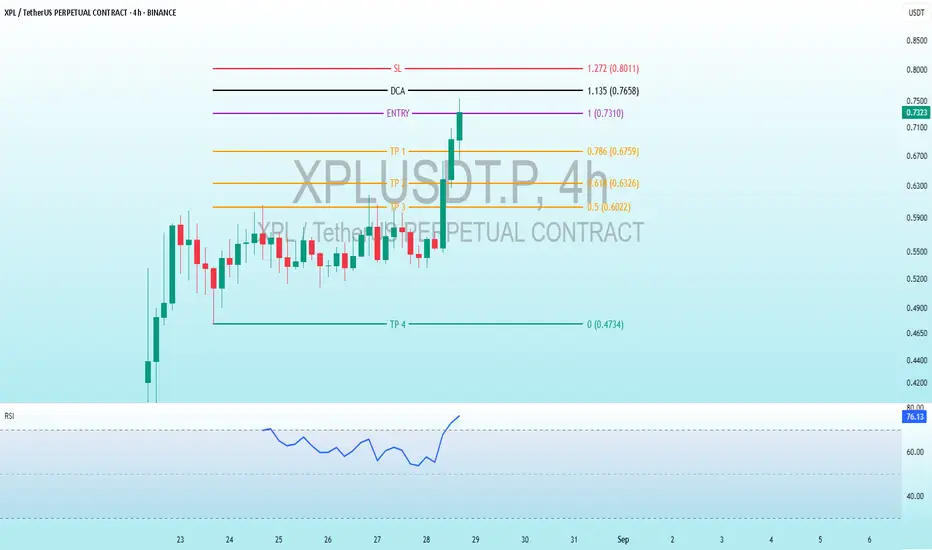
Big Breakout: $XPL Bullish Strategy for Your Gains!BINANCE:XPLUSDT.P
Big Breakout: AMEX:XPL Bullish Strategy for Your Gains!
Trading Levels
The chart indicates predefined levels for a trading strategy:
Entry: 0.7310 - 0.7330 USD - The point where the trader plans to enter the market.
SL (Stop Loss): 1.272 USD (0.8011) - A level to close the position at a loss, which seems high and might be a typographical error (could be 0.1272 or 0.7127, but clarification is needed).
TP (Take Profit): Four exit levels for profit:TP1: 0.786 USD (0.6759)
TP2: 0.618 USD (0.6326)
TP3: 0.5 USD (0.6022)
TP4: 0.4734 USD
DCA (Dollar Cost Averaging): 1.135 USD (0.7658) - A level for cost averaging, possibly for additional purchases if the price drops.
Price Analysis
The price has experienced a sharp decline earlier, reaching a low of around 0.47 USD, before recovering to the entry level (0.7310).
The current movement appears bullish, with a steady rise after a consolidation period, but the high RSI suggests a potential pullback or correction soon.
Interpretation
Strategy: The chart suggests a moderately risky strategy with good profit potential. The TP levels are set with a relatively balanced risk-reward ratio, but the high SL (1.272) seems unusual and might be an error.
RSI: The value of 77 - 76 indicates a condition nearing overbought, which may signal a pullback or correction toward levels like TP1 or TP2.
Trend: There are signs of a short-term bullish trend, but the proximity to overbought conditions might lead to consolidation or a slight decline.