Can XPT/USD Extend Its Uptrend After Multiple Pullback Tests?⚡ XPT/USD Platinum vs U.S. Dollar Bullish Breakout Blueprint 🎯 – Day & Swing Setups 🚀
🔥 Live Price Snapshot (XPT/USD):
Platinum Spot Price continues strong above ~$2,270 / oz & near multi-year highs — up sharply this year on persistent supply tightness and industrial demand strength.
📈 Trade Plan (Bullish Bias):
Setup: Confirmed bullish structure with price holding above rising trend support / major moving averages (triangle formation + multi-pullback retest yet to complete).
Bias: Bullish continuation if price maintains zone and re-tests support clusters — ideal for both day and swing traders.
Utilising Thief Layering Strategy: deploy multiple buy limit orders as price retraces into value zones (suggested layering):
🟢 Layers: 2200 → 2250 → 2300 → 2350 USD (extend further per personal risk preference)
📌 Your entries should be spaced strategically based on pullbacks to support/VA levels — this improves avg price and risk management.
🎯 Targets & Resistance:
Primary Target: 2650 USD / oz — key resistance cluster & overbought confluence zone (psychological zone + historical supply resistance).
Profit Taking: Scale partial profits as price approaches this zone — avoid holding full size into heavy resistance.
🛑 Stop Loss Guidance:
Core Stop: ~2100 USD
This protects the structure below key demand zone. Always customize based on preferred risk per share / asset exposure.
📌 Trader Notes:
Dear Thief OG’s — YOU decide your own profit exits & stop placements. My suggested zones are guides — your discipline manages real profits.
🔁 Correlated Pairs / Watchlist:
Track these alongside XPT for broader precious metals and USD strength insights:
XAU/USD (Gold) – often shows lead/confirmation moves in metals space.
XAG/USD (Silver) – sensitive to industrial demand shifts.
PALL/USD (Palladium) – cyclical pair with PGM demand overlap.
USD Index (DXY) – strong USD can dampen precious metal rallies.
Correlations help confirm trend strength or divergence setups.
📊 Fundamentals & Macro Drivers:
Bullish Macro Tailwinds for Platinum:
Supply Deficits Persist: Ongoing structural shortfalls due to concentrated mining supply issues & logistical constraints drive scarcity premium.
Industrial Demand: Automotive catalytic converters remain major demand drivers amid emissions regulation and industrial recovery trends.
Investment Flow: A shift to hard assets in uncertain markets supports precious metals — platinum gains outperforming peers.
Potential Headwinds / Risk Factors:
Analyst forecasts sometimes warn of robust drawdowns if supply/demand rebalances unexpectedly or if broader risk-off USD strength intensifies.
Geopolitical & mining-region risks can trigger sudden volatility.
📅 Key Economic Calendars to Watch (Market Impact):
U.S. CPI & PPI releases → influence real rates & precious metal valuations
Federal Reserve commentary / rate decisions → impacts USD direction & risk sentiment
Auto industry data (ISM, auto sales) → indirect drivers of platinum industrial demand
(Add precise London-time dates when available on your calendar)
💬 Trade Psychology / Notes:
Manage position sizing & layering risk systematically — avoid all-in at a single level.
Respect structural breaks — a clean break below major S/R invalidates bullish thesis.
XPTUSD

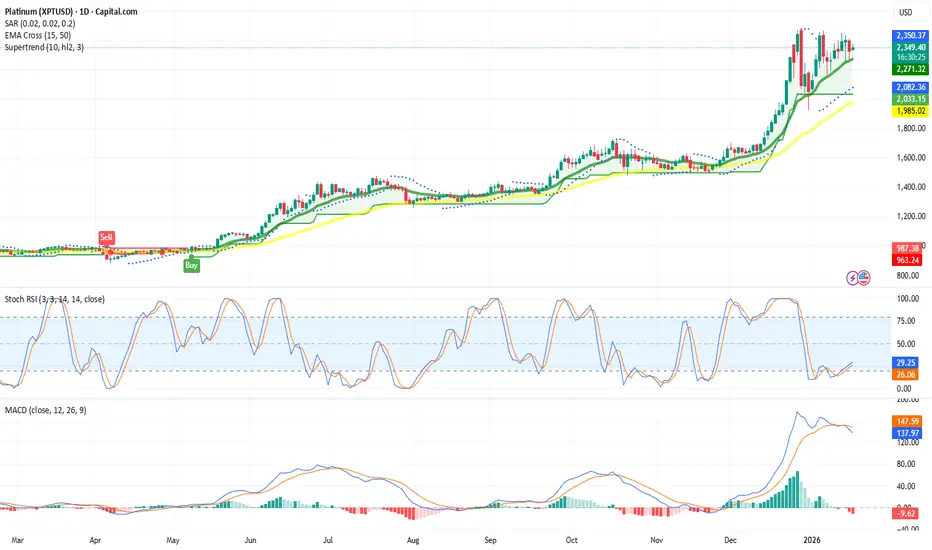
Platinum short term bullish 260119Platinum (XPT) going strong on the daily chart.
Short term indicators:
Par SAR: buy
EMA cross: buy
Supertrend: buy
Stoch RSI: buy
MACD: sell
Short term support at $2,002
Fundamentals are strong.
Long term (weekly, monthly charts) are also bullish.
Just like silver and gold:
Is the Metals Market Signaling a New Platinum Upswing?🏆 PLATINUM VS U.S. DOLLAR 📊 Metals Market Swing Trade Blueprint
━━━━━━━━━━━━━━━━━━━━━━━━━━━━━━━━━━━━━━━
📈 BULLISH SWING TRADE SETUP ⚡
Asset: XPT/USD (Platinum Futures)
Timeframe: Swing Trade (4H-Daily)
Strategy: Breakout Reversal
Risk/Reward Ratio: 1:2.85 ✓
━━━━━━━━━━━━━━━━━━━━━━━━━━━━━━━━━━━━━━━
🎯 TRADE SETUP PARAMETERS
💰 ENTRY ZONE
Primary Level: @1,620 (Post-Resistance Breakout Confirmation)
Trigger: Clear breakout above key resistance
Strategy Note: Enter ANY price level AFTER confirmed breakout candle closes above 1,620
🛑 STOP LOSS
Hard SL: @1,530 (Risk Buffer: $90 per contract)
⚠️ CRITICAL: Place SL ONLY AFTER breakout confirmation
📌 This is YOUR risk management choice - adjust per your position sizing & strategy
🎪 TARGET LEVELS
Primary TP: @1,720 (Resistance Trap + Overbought Zone)
Profit Taking: Strong resistance cluster + momentum divergence
📌 Exit strategy is YOUR choice - capture profits when conditions align
━━━━━━━━━━━━━━━━━━━━━━━━━━━━━━━━━━━━━━━
🔗 RELATED PAIRS TO MONITOR 📊
1️⃣ GC/USD (GOLD vs USD) 🥇
Correlation: POSITIVE (0.85+) - Precious metals move together
Key Point: If gold breaks above 2,050, XPT bullish bias strengthens
Watch: USD weakness = simultaneous gold/platinum rallies
2️⃣ SI/USD (SILVER vs USD) 🔶
Correlation: POSITIVE (0.78+) - Precious metals complex
Key Point: Silver acts as leading indicator; watch for breakout first
Watch: Industrial demand driver for platinum alternatives
3️⃣ DXY (US DOLLAR INDEX) 💵
Correlation: NEGATIVE (-0.82) - Inverse relationship
Key Point: Weaker dollar = stronger commodity prices
Watch: If DXY drops below 104.50, XPT uptrend likely accelerates
4️⃣ PALLADIUM/USD (PA/USD) 🔹
Correlation: POSITIVE (0.72+) - Autocatalyst/industrial metals
Key Point: Similar industrial demand patterns
Watch: Pd strength validates industrial commodity rally
5️⃣ CRB INDEX (Commodity Index) 📉
Correlation: POSITIVE (0.68+) - Broad commodity sentiment
Key Point: General risk-on environment supports metals
Watch: If CRB breaks resistance, XPT momentum likely continues
━━━━━━━━━━━━━━━━━━━━━━━━━━━━━━━━━━━━━━━
📋 TRADE MANAGEMENT CHECKLIST
✅ Wait for CONFIRMED breakout candle above 1,620
✅ Risk only what you can afford to lose
✅ Monitor USD weakness as bullish catalyst
✅ Watch gold (GC) for correlation confirmation
✅ Set alerts at key resistance levels
✅ Take partial profits at 1,720 resistance
✅ Trail stop after 50+ pips profit
✅ Review position during FOMC/economic data
━━━━━━━━━━━━━━━━━━━━━━━━━━━━━━━━━━━━━━━
🎓 KEY TAKEAWAYS
→ Platinum bullish bias on breakout above 1,620
→ Multiple precious metals correlations support uptrend
→ USD weakness = primary tailwind
→ Gold confirmation = higher probability setup
→ Target 1,720 resistance with proper risk management
Trade Smart. Trade Safe. Trade Responsibly. 🎯

XPTUSD (Platinum) — 1H Trade Plan | Multi-TF ConfluenceXPTUSD (Platinum) — 1H Trade Plan | Multi-TF Confluence
Multi-Timeframe Bias
• Daily: Strong bullish trend intact; price holding above 0.786 Fib → continuation structure
• 4H: Higher highs & higher lows; pullbacks respected Alligator support; no trend breakdown
• 1H (Execution): Bullish structure, higher lows, price accepted above key Fib & demand zone
➡️ Overall Bias: BULLISH CONTINUATION
⸻
Candle & Momentum Read
• 1H Candles: Bullish engulfing + strong continuation candles from demand
• RSI (1H): Holding above 50 (bullish regime)
• Divergence: ❌ No bearish divergence detected across H1 / H4
⸻
Key Levels
Resistance
• 2465–2485 (Daily high)
• 2500 (Psychological)
Support
• 2350–2340 (0.786 Fib + H1 structure)
• 2320–2300 (H4 demand zone)
⸻
🎯 Trade Plan (1H Execution)
🟢 Buy Setup – Trend Continuation
Entry (EP):
• Buy pullback 2350–2360
• OR buy H1 bullish confirmation above 2350 or aggressive entry at current level
Stop Loss (SL):
• Below 2320
• Conservative: 2290
Take Profits (TPs):
• TP1: 2415 if entering on pullback
• TP2: 2465–2485 from current level
• TP3 (Runner): 2500+
⸻
❌ Invalidation
• H1 close below 2320
• RSI breaks below 45
• Strong bearish engulfing with follow-through from resistance
⸻
✅ Checklist Scoring (Lecture Framework)
Daily Trend BULLISH
H4 Structure BULLISH
RSI Regime BULLISH
Candle Pattern BULLISH
Location (Fib + S/R) BULLISH
Divergence NIL
Score:
Bulls 5 / 6
Bears 0 / 6

Precious Metals Outlook for 2026Without any doubt, 2025 has largely been the year of precious metals (besides A.I).
Gold, silver, and later platinum dominated market narratives, with December standing out as a particularly explosive month — especially for silver and platinum.
And while making predictions for 2026 is inherently difficult — given how quickly fundamentals and geopolitics can shift — we can still extract a lot of insight from the charts and the broader technical context.
So let’s break down the current situation and outline the key scenarios going forward.
XAUUSD — Gold: A Sharp Correction Inside a Larger Bull Market
After printing a new All-Time High around 4550 on the second day of Christmas, the yellow metal faced a violent reversal.
On Monday, December 29th, the week opened with a major sell-off, and gold dropped nearly 2,500 pips from top to bottom.
Yesterday, the bulls attempted to regain control, but their efforts failed and the session closed as a continuation Pin Bar, signaling potential downside continuation.
At the time of writing, price is trading around 4320, testing and “flirting” with the rising trendline that started back in August.
If we see a genuine breakdown below this structure, the next technical downside targets could be:
- first zone: 4200
- extended correction target: 4050
These levels align with prior support clusters and psychological price areas.
However — and this is the key point — even if gold corrects toward the 4,000 zone, I do not expect a long-term trend reversal heading into 2026.
From my perspective, this move currently looks like:
👉 a healthy corrective phase inside a larger bullish cycle
Once gold finds a meaningful bottom and the correction runs its course, the most probable long-term scenario remains:
- trend continuation to the upside
- renewed bullish momentum during 2026
- and a potential move toward new All-Time Highs, possibly even above 5,000 zone, if market conditions align.
XAGUSD — Silver: Stronger Momentum & A More Explosive Upside Profile
November and December brought an extraordinary rally in silver, with price almost doubling in a very short period of time.
On Monday, December 29th, the market printed what looks very much like a blow-off top, followed by a sharp decline after reaching the 84 USD zone, a fresh ATH.
After such a dramatic rise — from 45 to nearly 85 in just two months — a correction is not only normal…
…it is healthy, necessary, and even welcome from a market structure perspective.
And as I have repeatedly stated over the past six months:
👉 My medium-to-long-term outlook remains more bullish on silver than on gold
Silver historically tends to outperform gold during later stages of a precious-metal bull cycle, and price behavior in 2025 fits that pattern quite well.
Once this corrective phase ends, I expect:
- the bullish trend to resume
- volatility to remain ETREMELY high
- momentum to shift back in favor of buyers
With a realistic upside projection toward:
➡️ 100 USD — or even higher — during 2026
For long-term investors and position traders, one key area I am watching closely (if the correction deepens) is the:
🔹 60–63 USD zone
This region may provide an attractive accumulation area for strategic long-term buying — assuming price stabilizes and confirms support there.
XPTUSD — Platinum: The Late-Year Explosion & A Deeper Pullback Zone
Platinum also delivered spectacular price action in December.
From around mid-month, price literally exploded upward, culminating in a new ATH near 2600.
At the moment, platinum is also inside a corrective phase — which is again perfectly normal after such an aggressive impulsive rally.
From my point of view, if the pullback extends further, a particularly interesting technical area to watch is:
🔹 around the 1600+ zone
This region may become a highly attractive level for long-term accumulation and potential buy-position setups — provided price confirms support and market conditions stabilize.
Final Thoughts — Corrections Don’t Cancel Bull Markets
Yes — corrections across precious metals currently look sharp and emotional.
But sharp corrections are a defining characteristic of major bull markets.
At this stage, nothing in the broader structure suggests a true long-term reversal. Instead:
- gold remains structurally bullish despite the pullback
- silver still shows stronger potential upside than gold
- platinum is entering what may become an attractive accumulation zone
2026 may still belong to precious metals — even if the path forward includes volatility, deep retracements, and periods of uncertainty.
As always, the market will have the final word — but technically, the broader narrative remains intact.
🚀
Happy New Year!
Mihai Iacob

Platinum’s Nuclear Breakout Is Loading | The Chart Doesn’t LiePlatinum (XPTUSD) — Long-Term Structural Analysis Integrating Elliott Framework, Institutional Order Flow, and Macro Cycles
Platinum’s multi-decade price behavior continues to display a well-ordered impulsive structure consistent with classical Elliott Wave theory, supported by recurring institutional accumulation patterns and strict adherence to Fibonacci geometry. The asset has progressed through a full secular cycle, characterized by deep corrective retracements into high-probability value zones and expansions that consistently terminate at key Fibonacci extension thresholds—behavior typical of markets driven by institutional liquidity flows rather than retail speculation.
Elliott Structure & Fibonacci Alignment
The historical impulse demonstrates strong proportionality across waves.
The initial secular Wave 1 advanced precisely into the 1.618 extension , confirming a minimum impulse threshold.
Wave 2 retraced cleanly to the 0.618 retracement , an area frequently associated with long-horizon institutional repositioning.
The subsequent Wave 3 extended toward the 2.618 level , consistent with the most statistically probable long-cycle expansion target.
Wave 4 repeated the symmetrical 0.618 retracement , reflecting renewed accumulation in a structurally discounted region .
The current multi-year breakout sequence is consistent with an emerging Wave 5 , with a macro-projection aligning toward the 3.618 extension , a historically validated termination zone for commodities in late-cycle impulsive phases.
Macro Market Structure
Platinum has spent an extended period in re-accumulation following a prolonged distribution phase that began after the prior secular peak. Internal structure has now transitioned from compression to early expansion, evidenced by successive breaks of multi-year structural highs and sustained acceptance above formerly capped liquidity zones. This structural shift suggests the market is transitioning from long-term value consolidation into a new secular markup phase.
Institutional Order Flow & Smart Money Dynamics (ICT/SMC Framework)
Price behavior across multiple cycles reveals consistent liquidity targeting:
Corrective waves repeatedly returned to deep discount regions within the 0.618–0.786 “golden pocket,” an area historically associated with institutional accumulation and mitigation of long-horizon order blocks.
Liquidity sweeps above major multi-year highs followed by sustained displacement signal a structural shift in institutional intent.
Current price action demonstrates displacement from an extended accumulation base, confirming that the dominant flow is now upward, with liquidity pools above the historical consolidation range serving as primary targets.
Price Action Context
The market has decisively exited its multi-year equilibrium, printing higher-high/higher-low structures consistent with early-stage impulsive behavior. Breaks of internal liquidity layers reinforce the expectation of continued expansion toward higher-order liquidity pools, aligning with the projected Wave 5 trajectory.
Fundamental Alignment
Underlying fundamentals - including tight supply dynamics, structural deficits within the PGM basket, and tailwinds tied to hydrogen economy applications - reinforce the technical outlook. The confluence of cyclical tightening, inventory compression, and strategic industrial demand supports a durable long-term appreciation phase.
What do YOU think happens next?
Breakout or fake-out? Drop your prediction below!
👇 We are replying to every comment - let’s talk charts .
Smash the 👍 if this helped, hit 🔔 to catch the next setup,
and FOLLOW for more high-probability wave + SMC plays.
⚠️ Disclaimer
This content is for educational and informational purposes only and does not constitute financial, investment, or trading advice. All analyses reflect personal opinions based on publicly available data and chart structures. Markets involve risk, and you should always perform your own research or consult a licensed financial professional before making any trading decisions. Past performance does not guarantee future results.
#Platinum #XPTUSD #CommodityTrading #Breakout #Wave5 #ElliottWave #SmartMoney #SMC #ICT #PriceAction #ParabolicMove #BullishSetup #MarketCycle #Fibonacci #Metals #Macro #TechnicalAnalysis #ChartAnalysis #TradingSignals #TraderCommunity #Investing

Platinum (XPTUSD) Holds Trendline — CPI Is the CatalystSummary:
Platinum remains in a clean bullish structure, printing higher highs and higher lows while respecting a rising dynamic support zone. Price reaction near the trendline suggests continuation is possible, but CPI news could be the volatility trigger.
Chart Analysis:
🟢 Market Structure: Clear uptrend with consistent higher highs & higher lows — buyers remain in control.
📐 Dynamic Trendline: Price is reacting well around the rising channel, acting as a key decision zone.
🔁 Pullback Logic: Recent dip looks corrective, not impulsive, indicating healthy trend behavior.
📰 Fundamental Risk: CPI news ahead — expect expansion in volatility and a potential breakout or fakeout.
Takeaway (Simple Trader Language):
➡️ Bullish as long as price holds above the rising trendline.
⬇️ Bearish only if we get a clean break and close below the dynamic support.
Hashtags:
#Platinum #XPTUSD #Commodities #TradingView #MarketStructure #TrendTrading #CPI 📊🔥

Precious metals lead the way: silver, platinum, and palladium!On December 2, FreshForex analysts had already highlighted the high potential of the metals market — and the market quickly confirmed this scenario with a sharp rise in prices: silver (XAGUSD) +12.89%, platinum (XPTUSD) +9.03%, and palladium (XPDUSD) +8.75% . Our metals forecasts not only played out — this segment confidently outperformed many other asset classes. Investors are moving away from the dollar and government bonds into real assets amid expectations of U.S. rate cuts. Prices are also being fueled by news of supply deficits and rising industrial demand for these metals. Against this backdrop, interest in precious metals is growing among both retail and large institutional investors.
Growth Drivers:
Silver (XAGUSD) is rising due to a supply shortage : demand from the solar energy sector and electronics is increasing, while inventories are declining. For investors, silver is also a more affordable alternative to gold .
Palladium (XPDUSD) is supported by limited supply and geopolitical risks : the market depends heavily on Russia and South Africa, while demand for palladium in automotive catalysts and electronics remains strong. As a result, even rumors of sanctions or export restrictions can sharply push prices higher.
Platinum (XPTUSD) is gaining value amid mining disruptions in South Africa , which remains a key global supplier. At the same time, demand from industry and hydrogen-related projects keeps the market tight, meaning any news from the mining sector is quickly reflected in prices.
If a dovish Fed policy and a weak dollar persist, interest in precious metals as a “hedge against currency devaluation” is likely to remain high. Silver receives an additional boost from the “green” agenda — the development of solar energy and electric vehicles, where it is used in virtually every component.
Platinum and palladium continue to depend on a limited number of supplier countries, making any disruptions in mining or logistics powerful price triggers. In this environment, even minor news about production cuts or new restrictions can spark another wave of growth. As long as the market sees a supply deficit and no quick way to significantly increase output, the bullish scenario retains strong potential.
FreshForex analysts note that in the coming months, the performance of silver, platinum, and palladium will largely depend on the Fed’s rate-cut trajectory, the pace of the global “green” transition, and mining-related news from key regions — primarily South Africa and Russia. Investors are advised to maintain strict risk management and closely monitor the macroeconomic calendar.

XPT/USD Breakout Explained: Smart Entry, SL, and TP Guide🔥 PROFESSIONAL TRADINGVIEW DESCRIPTION (XPT/USD – PLATINUM)
🌐 Asset: XPT/USD “PLATINUM VS U.S. DOLLAR”
📈 Market: Metals Market – Swing / Day Trade Opportunity Guide
🚀 Trade Plan – Bullish Breakout Confirmation
✨ Platinum is showcasing a strong bullish continuation after clearing a major resistance zone, signaling renewed buyer strength and momentum expansion.
🟢 Entry:
Enter at any price level after a clean breakout retest, ensuring price holds above the previous resistance-turned-support.
Look for stable candles, reduced volatility spikes, and sustained volume power before entering.
🛡️ Stop Loss Strategy 🔐
Stop Loss: “Thief SL” @ 1600
Dear Ladies & Gentlemen (Thief OG’s), kindly adjust your SL based on your personal risk tolerance, exposure, and strategy framework.
➡️ This is not a mandatory SL — manage your risk in the way that protects your capital and suits your trading system.
🎯 Target Zone – Profit Taking Guidance
A strong resistance cluster + overbought behaviour + possible trap zone + correction probability ahead.
📌 Target (TP): 1720
Dear Ladies & Gentlemen (Thief OG’s), this TP is not a compulsory target — your profit-taking should always match your style, system, and comfort level.
🔍 Related Pairs to Watch & Key Correlations
Tracking correlated assets helps confirm the strength or weakness in Platinum’s current breakout phase:
1️⃣ OANDA:XAUUSD (Gold vs USD)
Often moves in similar directional flow to Platinum.
A strong bullish push in Gold can signal broad metals market risk-on sentiment.
2️⃣ OANDA:XAGUSD (Silver vs USD)
Silver reacts faster to volatility.
When Silver surges with Platinum, it confirms metals sector momentum alignment.
3️⃣ $XPTXAU (Platinum/Gold Ratio)
A rising ratio signals Platinum outperforming Gold, supporting bullish Platinum continuation.
Helps validate strength behind XPT’s breakout.
4️⃣ TVC:DXY (U.S. Dollar Index)
Metals typically move inversely to USD.
Weakening DXY adds fuel to bullish XPT/USD scenarios.
5️⃣ Copper ( OANDA:XCUUSD )
Industrial metals correlation:
When Copper is strong, it reflects economic optimism, indirectly supporting Platinum demand sentiment.
📊 Liked this idea? Follow for more metal/forex trade setups!
💬 Comment your entry & exit strategies below – let’s share insights!
👍 If you found this useful, smash that LIKE button and SHARE with your trading community!
#TradingView #Platinum #XPTUSD #MetalsTrading #Breakout #Commodities #Forex #SwingTrading #DayTrading #Bullish #TradeSetup
Happy Trading, and may the pips be with you! 💰✨

PLATINUM The Bull Cycle still has some room to go.Platinum (XPTUSD) has been trading within a Channel Up since the March 16 2020 market bottom. With the support of the 1W MA50 (blue trend-line), it's been on its technical Bullish Leg since the April 07 2025 Higher Low.
The previous Bullish Leg peaked on a +135.93% rise. With the 1D RSI sequences among the two Bullish Legs similar, we also expect the current one to have one final push to give before completing a +135.93% rise at the top of the Channel Up. Our Target before that happens is $2000.
---
** Please LIKE 👍, FOLLOW ✅, SHARE 🙌 and COMMENT ✍ if you enjoy this idea! Also share your ideas and charts in the comments section below! This is best way to keep it relevant, support us, keep the content here free and allow the idea to reach as many people as possible. **
---
💸💸💸💸💸💸
👇 👇 👇 👇 👇 👇

Metals on the Rise: Is Gold and Copper Ready to Surprise?In November, clients most actively traded metals such as #XAUUSD, #XAGUSD, #CUCUSD, #XPTUSD, and #XAUEUR — these instruments showed the highest share of profitable trades. Today’s review focuses on the outlook for precious metals and copper: investor demand, industrial consumption, mining news, and rate expectations are shaping the sentiment for December and the final stretch of 2025.
Growth Prospects for Metals Through the End of 2025
#XAUUSD — Gold is supported by central bank purchases and heightened demand during periods of uncertainty. The softer the Fed and the lower the yields, the more logical it becomes to buy on pullbacks.
#CUCUSD — Copper: disruptions at mines and rising demand (energy transition, power grids, data centers, transportation) increase the risk of a supply deficit. Against this backdrop, copper pullbacks look like buying opportunities.
#XPTUSD — Platinum: limited supply and stable industrial demand support prices. With a calm news cycle, pullbacks may provide a chance to catch up with more popular metals.
#XAUEUR — Gold in EUR: market volatility and strong demand for safe-haven assets continue to support gold prices in euros. Even at elevated levels, traders still use pullbacks for buying.
#XAGUSD — Silver: industrial demand (solar energy, electronics) combined with gold’s dynamics supports silver. If market sentiment turns, pullbacks may rebound upward.
According to FreshForex analysts , a softer Fed stance, strong safe-haven and industrial demand, and potential supply-side risks create a supportive environment for buyers of gold, silver, platinum, and copper, pointing to gradual price growth. Under these conditions, it makes sense to closely watch pullbacks and key levels for phased position building — while maintaining strict risk control.

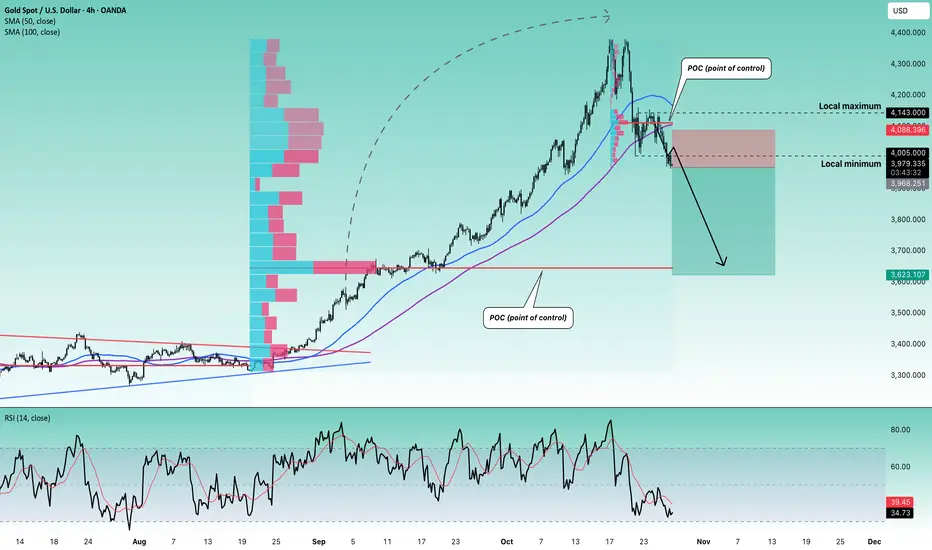
Stop!Loss|Market View: GOLD🙌 Stop!Loss team welcomes you❗️
In this post, we're going to talk about the near-term outlook for GOLD ☝️
Potential trade setup:
🔔Entry level: 3992.755
💰TP: 3853.896
⛔️SL: 4067.971
"Market View" - a brief analysis of trading instruments, covering the most important aspects of the FOREX market.
👇 In the comments 👇 you can type the trading instrument you'd like to analyze, and we'll talk about it in our next posts.
💬 Description: Gold is moving in line with the previous sell scenario, and this medium-term trade remains relevant. In the shorter term, additional selling below the point of control (POC) level, around 3992.755, could also be considered. An alternative short-term scenario is selling near 4100, where the last accumulation is located. The downside target is currently considered to be in the 3800-3900 area, but a decline to 3600-3700 remains possible.
Thanks for your support 🚀
Profits for all ✅

Xrp - last stop until valhallaCan you see it?
IH&S
On the 4th leg down (5 we break)
In a decending channel
Sitting on monthly pivot
Etf's
Iso20022 incoming
...
I mean.. Never say never, but, this train is leaving!

Stop!Loss|Market View: SILVER🙌 Stop!Loss team welcomes you❗️
In this post, we're going to talk about the near-term outlook for SILVER ☝️
Potential trade setup:
🔔Entry level: 52.10719
💰TP: 48.72093
⛔️SL: 53.72120
"Market View" - a brief analysis of trading instruments, covering the most important aspects of the FOREX market.
👇 In the comments 👇 you can type the trading instrument you'd like to analyze, and we'll talk about it in our next posts.
💬 Description: The price is currently potentially forming a double-top reversal pattern. There's a large accumulation of buyers near 53-54, and if they manage to maintain the price at these levels, silver will rise toward 56. However, if the price reaches 52, we can expect a pullback to 48-49, from where, in the longer term, a decline to 40-42 is possible.
Thanks for your support 🚀
Profits for all ✅

Stop!Loss|Market View: SILVER🙌 Stop!Loss team welcomes you❗️
In this post, we're going to talk about the near-term outlook for SILVER ☝️
Potential trade setup:
🔔Entry level: 50.07771
💰TP: 45.90144
⛔️SL: 51.62853
"Market View" - a brief analysis of trading instruments, covering the most important aspects of the FOREX market.
👇 In the comments 👇 you can type the trading instrument you'd like to analyze, and we'll talk about it in our next posts.
💬 Description: As noted earlier regarding gold, despite the aggressive short-term strengthening of metals, medium- and long-term selling pressure remains. Both gold and silver are trading near key resistance levels, indicating a potential reversal. A further approach to 52 is not ruled out for silver, so shorter-term selling is looked for if the price approaches 50, and it's best to wait for the price to close below 50.
Thanks for your support 🚀
Profits for all ✅
❗️ Updates on this idea can be found below 👇

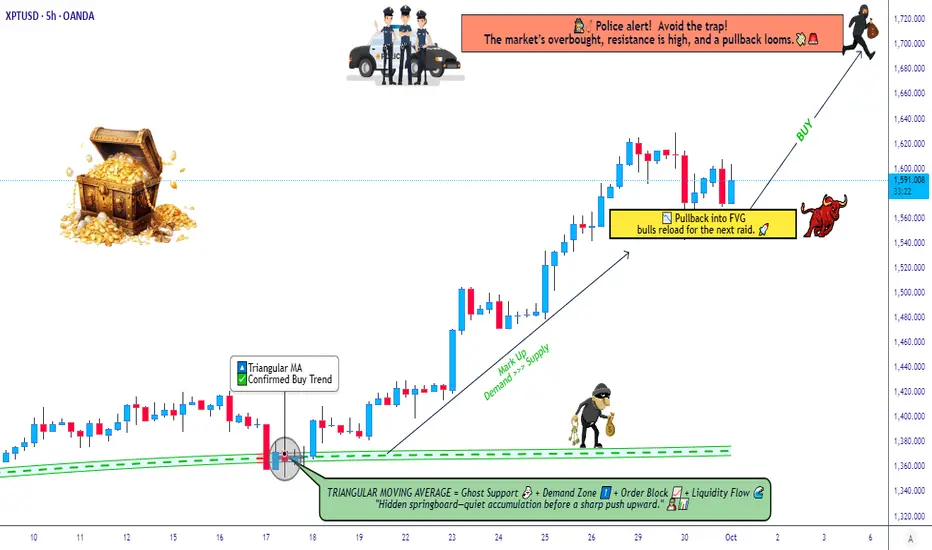
Bullish Momentum Confirmed on $XPT/USD!💎 PLATINUM vs U.S DOLLAR | Wealth Strategy Map (Swing/Day Trade) 💎
Plan:
📈 Bullish plan confirmed ✅ with pullback retest in triangular moving average + re-accumulation at neutral zone.
Entry:
💰 YOU CAN ENTER AT ANY PRICE LEVEL — Thief Layer Strategy.
Stop Loss:
⛔ This is Thief SL @1500
⚠️ Note: Dear Ladies & Gentlemen (Thief OG's), I do NOT recommend using only my SL. Your choice, your risk — make money responsibly.
Target:
🎯 @1720 → Police barricade zone: strong resistance + overbought + trap alert 🚨
💎 Preferred escape target: @1700
⚠️ Note: Dear Ladies & Gentlemen (Thief OG's), I do NOT recommend using only my TP. Your choice, your risk — take profits as you see fit.
🔗 Related Pairs to Watch & Key Points
$XAU/USD (Gold vs USD): Often shows strong correlation with Platinum. Watch Gold for leading/confirming bullish momentum.
$PALL/USD (Palladium vs USD): Platinum & Palladium can diverge in industrial demand cycles. Check for divergence alerts.
AMEX:USD Index (DXY): Strong USD = pressure on XPT/USD; weak USD = tailwind. Key macro driver.
Key Points:
1️⃣ Pullback retest on triangular MA shows strong buying interest.
2️⃣ Re-accumulation at neutral zone signals continuation of bullish trend.
3️⃣ Keep an eye on overbought conditions near $1720 — possible profit-taking zone.
4️⃣ Cross-asset signals (Gold/Palladium) strengthen conviction for swing/day trades.
✨ “If you find value in my analysis, a 👍 and 🚀 boost is much appreciated — it helps me share more setups with the community!”
Disclaimer:
⚠️ This is Thief-style trading strategy just for fun. Trade responsibly and at your own risk.
#XPTUSD #Platinum #ForexTrading #SwingTrade #DayTrade #BullishSetup #TradingStrategy #ThiefStyleTrading #MetalsMarket #TradingViewIdeas
Stop!Loss|Market View: GOLD🙌 Stop!Loss team welcomes you❗️
In this post, we're going to talk about the near-term outlook for GOLD ☝️
Potential trade setup:
🔔Entry level: 3968.251
💰TP: 3623.107
⛔️SL: 4088.396
"Market View" - a brief analysis of trading instruments, covering the most important aspects of the FOREX market.
👇 In the comments 👇 you can type the trading instrument you'd like to analyze, and we'll talk about it in our next posts.
💬 Description: Metals have broken the lower border of previously identified accumulations. For gold, this is the price range of 4005 - 4143, indicating a highly probable downward impulse previously anticipated toward the 3600 - 3700 region. Currently, the main scenario is a breakout and entry around 3970. If the stop loss is triggered, re-entries can be considered.
Thanks for your support 🚀
Profits for all ✅
❗️ Updates on this idea can be found below 👇
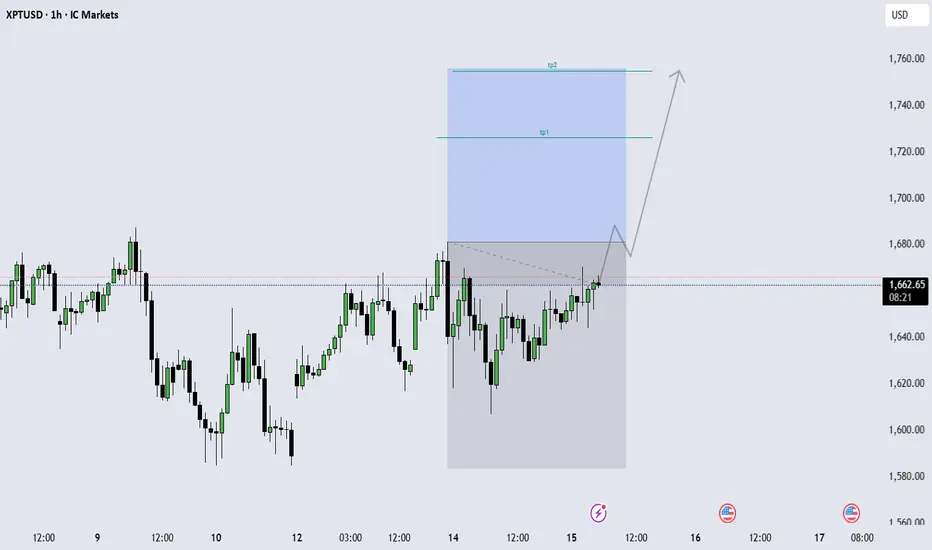
Platinum Swing Setup: SMA Pullback + Hull MA Breakout!🎉 Platinum Heist: XPT/USD Bullish Breakout Plan
Asset: XPT/USD (Platinum vs. U.S. Dollar)
Trade Type: Swing/Day Trade
Vibe: Thief-Style Market Raid with a Bullish Twist! 🚨
Get ready, Thief OG's! We're plotting a slick move on the Platinum market, using a layered limit order strategy to sneak into profits. Let’s break down this heist with a polished, professional, yet fun approach to maximize views and likes on TradingView! 😎
📊 The Setup: Bullish Confirmation for the Win!
Here’s the plan to pull off this Platinum Profit Pathway:
🟢 Bullish Confirmation: Price pulling back to the Simple Moving Average (SMA), setting the stage for a breakout.
🕯️ Heikin Ashi Power: A bullish Doji candle confirms the upward momentum—our signal to strike!
📈 Hull MA Breakout: Price smashes through the dynamic resistance of the Hull Moving Average (HMA), screaming bullish vibes.
⚠️ Market Mood: Overbought conditions and strong resistance lie ahead, so we’ll need to be quick to escape the police close-in (aka profit-taking zone).
The Thief Strategy: Layered Limit Order Entry
We’re not just diving in—we’re layering our entries like a master thief stacking their loot!
Entry Plan: Place multiple buy limit orders to catch the price at key levels:
🎯 $1400
🎯 $1410
🎯 $1420
Pro Tip: Feel free to add more layers based on your risk appetite—customize your heist!
Why Layering?: This sneaky strategy spreads your entries to reduce risk and maximize your chance of catching the move.
🛑 Stop Loss: Protect Your Loot!
Thief SL: Set at $1390 to keep the cops at bay.
Note: Dear Thief OG's, this SL is my suggestion, but it’s your heist! Adjust based on your risk tolerance—take the money and run at your own discretion.
🎯 Target: Escape with Profits!
Profit Zone: Aim for $1460, where strong resistance + overbought conditions signal a potential trap.
Escape Plan: The police (market reversal) might close in, so lock in profits quickly!
Note: Dear Thief OG's, this TP is my call, but you’re the boss of your trades. Secure your gains when you feel the heat!
🔗 Related Pairs to Watch
Keep an eye on these correlated assets to spot market clues:
OANDA:XAUUSD (Gold vs. U.S. Dollar): Gold and Platinum often move in tandem due to their precious metal status. A bullish Gold trend could support our XPT/USD heist.
OANDA:XAGUSD (Silver vs. U.S. Dollar): Silver’s volatility can signal broader metal market sentiment—watch for bullish confirmation here too.
USD Index ( TVC:DXY ): A weaker USD often boosts precious metals. If DXY weakens, it could fuel our Platinum breakout.
Key Correlation Insight: Platinum tends to follow Gold’s lead but can be more volatile due to industrial demand. Monitor XAU/USD for confirmation and DXY for USD strength/weakness.
📝 Disclaimer
This Thief-Style Trading Strategy is just for fun and educational purposes! Trading is risky, and past performance doesn’t guarantee future results. Always do your own research and manage your risk carefully. I’m not a financial advisor—just a fellow market thief sharing the plan! 😜
✨ “If you find value in my analysis, a 👍 and 🚀 boost is much appreciated — it helps me share more setups with the community!”
#TradingView #XPTUSD #Platinum #SwingTrading #DayTrading #ThiefStrategy #BullishBreakout #TechnicalAnalysis

Stop!Loss|Market View: GOLD🙌 Stop!Loss team welcomes you❗️
In this post, we're going to talk about the near-term outlook for GOLD ☝️
Potential trade setup:
🔔Entry level: 3995.914
💰TP: 3646.967
⛔️SL: 4195.976
"Market View" - a brief analysis of trading instruments, covering the most important aspects of the FOREX market.
👇 In the comments 👇 you can type the trading instrument you'd like to analyze, and we'll talk about it in our next posts.
💬 Description: The current accumulation of 4005 - 4143 has formed the basis for a further decline toward 3600 - 3700. Two sell scenarios are being looked for, the more likely of which involves a potential trade on a breakout of the lower border. An alternative scenario involves the formation of a false breakout at the upper border of this accumulation.
Thanks for your support 🚀
Profits for all ✅
❗️ Updates on this idea can be found below 👇

Stop!Loss|Market View: SILVER🙌 Stop!Loss team welcomes you❗️
In this post, we're going to talk about the near-term outlook for SILVER ☝️
Potential trade setup:
🔔Entry level: 46.91212
💰TP: 41.26205
⛔️SL: 50.07903
"Market View" - a brief analysis of trading instruments, covering the most important aspects of the FOREX market.
👇 In the comments 👇 you can type the trading instrument you'd like to analyze, and we'll talk about it in our next posts.
💬 Description: Metals have fixed intraday decline records early this week. For now, the likelihood of continued declines is higher, and a reversal is more likely. A strong factor for continued declines in silver would be the formation of an accumulation between levels 47 and 48. In this case, a drop to level 38 could be expected. The declines in metals are explained with profit-taking, thereby strengthening the USD.
Thanks for your support 🚀
Profits for all ✅
❗️ Updates on this idea can be found below 👇

Stop!Loss|Market View: GOLD🙌 Stop!Loss team welcomes you❗️
In this post, we're going to talk about the near-term outlook for GOLD ☝️
Potential trade setup:
🔔Entry level: 4330.320
💰TP: 4023.981
⛔️SL: 4544.296
"Market View" - a brief analysis of trading instruments, covering the most important aspects of the FOREX market.
👇 In the comments 👇 you can type the trading instrument you'd like to analyze, and we'll talk about it in our next posts.
💬 Description: Gold has been showing signs of a possible "double top," but an update of the high may happen. While gold is testing its all-time high once more, silver and platinum have not yet recovered from their decline at the end of last week. Given that the USD index has been rising alongside gold since mid-September, it can be assumed that gold's current rally is a culmination of retail buying. The likelihood of a downward reversal has increased.
Thanks for your support 🚀
Profits for all ✅
❗️ Updates on this idea can be found below 👇

XPTUSD: Buy setup if you get confirmationXPTUSD: Buy setup if you get confirmation. wait for a breakout and buy.
Platinum- While everyone is chasing Gold’s rally, I’ve got my eyes on Platinum.
- That doesn’t mean Gold is a bad investment, it just means it’s already had its moment.
- Platinum feels “delayed,” but its time is coming.
- Observe closely, this simple graph reveals a tightening triangle.
Remember my first rule: Buy the blood, not the moon.
Stay sharp. Diversify. Never go all in.
Happy Tr4Ding
