XRP Dips UNDER $2 - Are we Heading BACK TO $1 ??Have you been watching XRP lately?
I was quite surprised that it held above the $2 as long as it did, to be honest.
But now, as the entire market dips, XRP drops... and it is notoriously know to dump and lose all bullish season gains.
Apart from all the controversy, if and I say IF you managed to held the $1 bag up until now - you would be in profit. Buying over $2 would have been high risk, and now we are likely approaching another few key buy zones, depending on where the price finds a bounce. The questions is.... worth it to accumulate or not?
Seeing price action in the 4h under the moving averages is always bearish for the SHORT term, which we do:
The massive wick in July 2025 already indicated the beginning of the bear market, and the lower moving averages is likely where we will find major support - 1.40 ish.
Xrp

XRP CONSOLIDATES WITH THE MARKET 🔥 As of January 27, 2026, XRP is experiencing a consolidation phase, trading around the $1.88 - $1.90 range after failing to decisively break above the $2.00 psychological resistance. The market is displaying "extreme fear" (Fear & Greed Index at 20-29), with traders weighing short-term bearish pressures against long-term bullish institutional adoption.
🔥 Here's some quick information on our Price Action and Technicals Jan 27, 2026
🔥 Current Price: Approximately $1.88, struggling to reclaim the $2.00-$2.10, with some data showing a 1.4% to 2.9% drop in 24 hours.
🔥 Support/Resistance: Crucial support is being tested near $1.80-$1.86, while resistance lies at $2.10-$2.30.
🔥 Technical Indicators: Daily charts show a "Strong Sell" signal based on moving averages (MA5-MA200), with 14-day RSI (46) indicating a neutral-to-weak position.
Pattern: Some analysts believe a descending triangle or "descending wedge" pattern is forming, which could lead to a final, short-term low before a potential reversal.
Key Drivers and Sentiment
🔥 ETF Inflows vs. Outflows: While ETFs have absorbed over $1.2B in historical inflows, recent data shows volatile daily movements, including significant outflows from some funds on Jan 20-21, followed by a slight rebound in interest, showing mixed sentiment.
Institutional Adoption: Ripple is actively partnering with banks (e.g., Riyad Bank) to modernize financial systems and push RLUSD, maintaining bullish sentiment for long-term holders.
🔥 Concerns: The upcoming 1 billion token unlock from escrow on Feb 1, 2026, and general market weakness (Bitcoin consolidation) are weighing on prices.
🔥 Short-Term Outlook: Analysts are divided, with some expecting further consolidation in the $1.50-$1.80 range, while others believe the "coiled spring" will eventually break upward 🔥towards $2.50 but for now things stand neutral until bulls can decisively regain that 200 EMA.
🔥 I've also added this highlight to show our descending channel that's been dragging us down so looking for an exit out of that and we can see XRP with that v shaped recovery as we just avoided falling below $1.80 before bouncing backup showing the support. That being said things look more like the market taking a breath instead of a full on reversal so hoping we can get a strong push soon to regain our EMA's but till then I'll keep my eyes peeled and keep you all posted.
🔥 As always, thanks for tuning in, appreciate the support and wishing all the best till next.
Best regards,
~ Rock '

Why You Should Backtest (Before You Trust Any Strategy)Most traders ask the wrong question.
They ask:
“Does this strategy work?”
The better question is:
“When does this strategy stop working?”
Backtesting exists to answer that.
1. A Single Backtest Is Not Proof
One profitable run does not mean a strategy is good.
It means it worked once, under one set of assumptions.
Markets change.
Volatility changes.
Behavior changes.
Backtesting across parameters, symbols, and timeframes shows whether performance is structural or accidental.
2. Drawdown Matters More Than Profit
Profit attracts attention.
Drawdown determines survival.
Two strategies can both make money.
Only one lets you stay disciplined long enough to compound.
Backtesting reveals:
Worst historical drawdown
Length of drawdowns
Recovery behavior
If you don’t know those, you don’t know the strategy.
3. Most Strategies Fail From Fragility
Many strategies look great until you:
Change RSI length by 2
Shift timeframe slightly
Switch from BTC to ETH
If performance collapses from small changes, the edge isn’t robust.
Backtesting exposes fragility before the market does.
4. Backtesting Protects You From Yourself
Most trading mistakes aren’t technical.
They’re emotional.
Backtesting:
Sets realistic expectations
Reduces overconfidence
Prevents panic exits during normal variance
Confidence comes from data, not conviction.
5. Backtesting Is About Risk, Not Prediction
Backtesting doesn’t predict the future.
It defines boundaries.
It tells you:
What’s normal
What’s abnormal
When something is truly broken
That’s the difference between trading and guessing.
Final Thought
Strategies don’t fail because they’re bad.
They fail because traders never tested their limits.
Backtesting isn’t optional.
It’s the cost of taking trading seriously.

XRP 1,890% profits potential with 10X leverage —LONG tradeI think timing is very important when it comes to trading with high leverage. If the timing is right, even a rookie can get it right. If timing accuracy is missing, then it all falls back to capital allocation/position size/risk control.
Timing is perfect right now, so you can forget about all those.
Full XRPUSDT leveraged trade-numbers below:
_____
LONG XRPUSDT
Leverage: 10X
Potential: 1890%
Allocation: 3%
Entry zone: $1.80 - $1.95
Targets:
1) $2.05
2) $2.22
3) $2.49
4) $2.71
5) $2.94
6) $3.25
7) $3.66
8) $4.10
9) $4.38
10) $4.83
11) $5.55
Stop: Close weekly below $1.75
____
Thanks a lot for your support all those years. I hope you find the timing awesome for this trade.
This is a high probability chart setup.
Thank you for reading.
Namaste.

XRP/USDT 1D Chart Review🔎 Market Structure (Most Important)
The market is in a clear downtrend.
The price is moving within a descending channel (the upper and lower boundaries are well respected).
Each uptrend ends with a lower high.
➡️ The trend remains bearish until the channel breaks out to the upside.
📐 Downtrend Channel
Upper channel line = dynamic resistance
Lower channel line = demand/bounce zone
Price:
has been rejected from the upper band of the channel
is currently moving back down.
This is classic behavior in a downtrend.
🟢 / 🔴 Key Levels
🟢 Resistance (sell zone)
2.38 USDT – very strong resistance (previous support)
2.26 USDT
2.10 USDT
👉 Any return to these areas = potential short/distribution
🔴 Support (buy reaction, not long confirmation)
1.91–1.89 USDT – current fight zone
1.80 USDT
1.76 USDT
1.57 USDT – last strong base (capitulation if broken)
⚠️ These are reaction zones, not automatic longs.
📊 Stochastic RSI
Oscillator has broken out of overbought
Direction: down
No bullish divergence
➡️ Momentum favors continued declines
🧠 Scenarios (specific)
🔻 Baseline scenario (most likely)
Price loses 1.90 USDT
Test:
1.80
then 1.76
If there is no strong volume, a drop to as low as 1.57
➡️ Continuation of the downtrend
🔄 Corrective scenario (short-term bounce)
Bounce from 1.89–1.80
Pullback to a maximum of:
2.10
2.26 (ideal short zone)

XRP / USDT – Daily & 8H AnalysisThe previous bullish FVGs, formed by the aggressive upside move, are now fully filled, removing earlier upside magnets and shifting focus back to structure and key levels.
On the 8H timeframe, price remains within a bearish structure, with the current move up still corrective. Price is consolidating in a pennant formation, suggesting compression rather than confirmation.
The reaction from the 0.75–0.786 retracement zone is technically valid, but without a reclaim this setup leans toward continuation rather than reversal.
For any bullish continuation, XRP must break out of the pennant and reclaim the 2.00 level, preferably with strong 8H closes.
Failure to do so keeps the risk of a lower high and renewed downside liquidity open.
Key focus
Bullish FVGs filled
Pennant = compression, not confirmation
8H structure remains bearish
Reclaim required for continuation
Like & comment if this level gets reclaimed or rejected — structure decides the next move.
MrC

XRP Global Trend. Ascending Channel. Triangle. January 2026Logarithm. 1-month time frame. Linear chart without market noise. Designed for visual understanding of long-term trend direction.

XRPUSD It can't even make a 1D MA200 test??XRP (XRPUSD) has been on a Bear Cycle since its July 18 2025 All Time High (ATH). Technically its whole Bear Cycle so far has been a Channel Down, which along with the majority of high caps, has been testing for the past 30 days the 1W MA100 (red trend-line) as Support.
Having already started its new Bearish Leg following the January 06 Lower High, it appears that the price is unable to even test the 1D MA200 (orange trend-line) for a technical rejection and continuation of the Bear Cycle. As long as it fails to do so, the current Bearish Leg eyes the 1W MA100 and if broken, may complete a -40.24% decline (similar to both previous Bearish Legs) at 1.4500.
---
** Please LIKE 👍, FOLLOW ✅, SHARE 🙌 and COMMENT ✍ if you enjoy this idea! Also share your ideas and charts in the comments section below! This is best way to keep it relevant, support us, keep the content here free and allow the idea to reach as many people as possible. **
---
💸💸💸💸💸💸
👇 👇 👇 👇 👇 👇

XRP RoadMap (1D)Let's take a look at Ripple to see what fluctuations it may experience over the next month or two.
We considered the upward move in 2024 as Wave A, the following correction as Wave B, and the third rise as a terminal 5-wave structure.
The sharp downward move is considered a post-pattern terminal, and now the waves we are in are regarded as a bearish cycle, forming an expanding/diametric/symmetrical triangle.
Whatever the larger pattern is, in aggregation it seems that the price will move downward from the red zone to the short-term targets marked on the chart.
The targets are marked on the chart.
A daily candle closing above the invalidation level will invalidate this analysis
For risk management, please don't forget stop loss and capital management
When we reach the first target, save some profit and then change the stop to entry
Comment if you have any questions
Thank You

XRP - Decision Time at Support!XRP is currently retesting a strong support zone, and this is where things usually get interesting.
After the sharp impulse higher, price slipped into a falling wedge, which is a typical corrective structure rather than pure weakness.
For now, sellers still have short-term control, but they are losing momentum as we grind into support.
The key for the bulls is simple 🔑
👉 A clean break above the falling wedge.
That breakout would signal that the correction is done and that buyers are ready to step back in, opening the door for a bullish continuation from this base.
📈 Bulls take over above the wedge.
📉 Failure to break keeps XRP corrective.
⚠️ Disclaimer: This is not financial advice. Always do your own research and manage risk properly.
📚 Stick to your trading plan regarding entries, risk, and management.
Good luck! 🍀
All Strategies Are Good; If Managed Properly!
~Richard Nasr

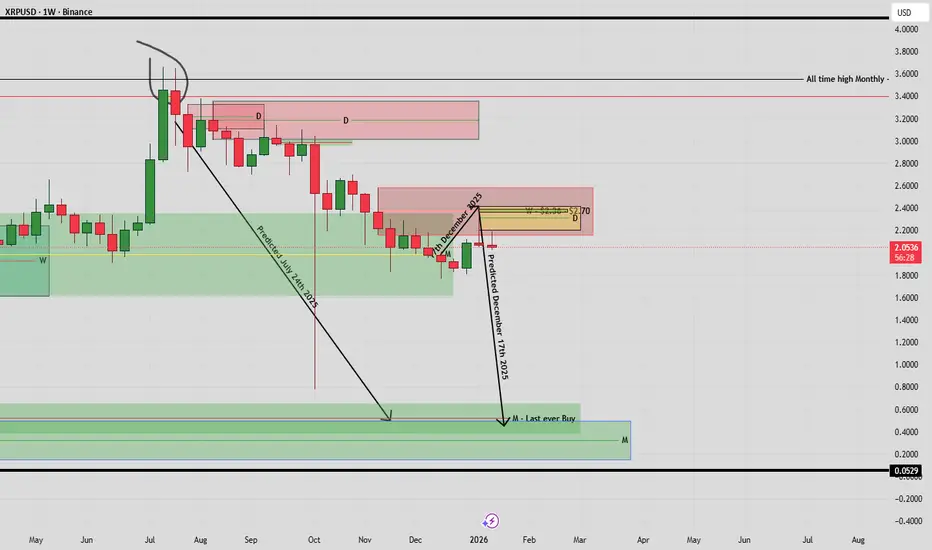
XRP has been BEARISH since JULY 24th 2025! IT STILL IS!BINANCE:XRPUSD
Back in July 2025 , when XRP was at all time highs, nobody could see that XRP was in a Veraxis zone to the downside.
Price was screaming bearish whilst price was allegedly bullish. To back up my call, i added a note on Tradingview notes, dated 24th July 2025 to make an embedded receipt of this prediction. My note said:
"XRP must go down to AT LEAST $1.50 and potentially to 0.50c, as we are now in a HEAVY sell."
Roll on October 10th 2025, the so called " Crypto Crash " zoomed price to 0.77c, which shocked the crypto space. To me, this was just the beginning.
The black arrows on my chart annotate on the days i wrote the notes.
THIS MOVE IS NOT OVER.
As price progressed, many Veraxis zones to the downside were created and were respected, however the most recent one printed 10th November 2025, and on 17th December 2025 i embedded another receipt/note to say:
"XRP will now continue its journey down to AT LEAST 0.50c, with potential to go down to 0.38c. Resistance may have to be hit first at $2.36 - $2.60 before it happens."
And as you can see from the annotated arrows, price retraced EXACTLY to that price 19 days later. The journey is now continuing down.
For context. When a Veraxis zone prints, price 9 times out of 10 MUST return back to it. I call the price of 0.50c - 0.38c as this is an untouched Veraxis zone.
One caveat as it's price over everything: Price is currently in a Veraxis zone to the upside which is contradictory to my prediction of lower prices, and price 'could' move up from here.
However, my back testing has trumped this move up in my opinion, as the Veraxis zone at 0.50c below current price, must be touched FIRST . If price does indeed spike up from this current Veraxis zone of $2.05, then i will temporarily adapt to price, but with always the expectation that 0.50c MUST be then touched in future.
SAFE MY PEOPLE!
(This analysis is built on the Veraxis framework — a methodology shaped from first principles and refined through extensive independent research. Veraxis, derived from Latin for “The True Pivot Point,” reflects a unique approach to market structure that isn’t sourced from external strategies or conventional teachings. It represents my own interpretation of how price truly pivots, reacts, and reveals intent.
As always, this is not financial advice. Trade safely, stay disciplined, and let the data speak.
)
Will #XRP Finally Recover or Is This Just Another Trap? Yello Paradisers! Are you keeping your eyes on #XRP? While most traders are zoning out, the next move might catch the crowd sleeping. Let's view #Ripple trading setup:
💎Over the past few weeks, #XRPUSDT has been trading inside a textbook falling wedge pattern on the 4H chart. Just recently, we saw a liquidity sweep below the descending support trendline, an early signal that smart money could be accumulating before a breakout move.
💎The price is currently hovering just above a strong demand zone around $1.73, with a clear descending resistance capping price action. A clean breakout above that resistance, especially if followed by a successful retest and the 50EMA flipping into support, would significantly boost the probability of a bullish move.
💎If this scenario plays out, the first minor resistance for #XRPUSD stands near $1.95, which could act as an initial profit-taking zone. Beyond that, momentum could accelerate toward $2.1951, marked as moderate resistance. But the ultimate upside target is at $2.4175, a strong resistance level with a high volume node, where aggressive sellers are likely to show up.
💎However, caution is key here. If #XRP fails to hold above the current support zone and closes below $1.7366, the bullish setup would be invalidated. That would likely trigger more downside toward $1.70 and possibly lower, especially as weak hands start exiting the market.
Trade smart, Paradisers. This setup will reward only the disciplined.
MyCryptoParadise
iFeel the success🌴

XRP, 200EMA rejection, local uptrend intactCRYPTOCAP:XRP
🎯Price printed a bullish engulfing 3 white knight candle pattern, reclaiming the daily pivot now being tested as support. The daily 200EMA served as resistance as price was swiftly rejected. Overcoming this is the goal for the bulls.
📈 Daily RSI negated bearish divergence, RSI is resting quickly, a good sign for the bulls.
👉 Analysis is invalidated below the swing low $1.8, keeping the downtrend alive.
Safe trading


XRP QUICK BULLETPOINT ANALYSIS 🗣️ Hope this finds you all well, here with a quick summary and analysis of things today for XRP and what we're looking at along with some factors and influences to take into consideration, thanks.
🗣️ Current Price: As of right now we've got XRP trading around that $2.05-08 range showing some stability after our pullback from the recent high of $2.20
🗣️ Current sentiment and trend: Crypto Fear and Greed Sentiment sits at a cool 50 / 50 marking the continuation of a mixed sentiment following up from our previous idea in which we noted the market was moving hesitantly thanks to that horizontal channel as we fought to keep the 200 EMA while trying to keep and sustain price action above the $2.00 mark.
🗣️ Key Levels: For the short term our key levels stand with resistance at $2.10-$2.13, with a breakout from that horizontal channel required in order for us to target higher levels, especially with the mixed sentiment. Downside risk would be the solid support level we have near $2.00-$2.03.
🗣️ Technical Signals: Open interest in XRP futures has surged by ~12%, signaling heightened volatility and active speculative interest as we've noted in our last idea with ETF inflow climbing demonstrating a bullish sentiment in the long term. On the local we've got this bearish technical signal with that 50 EMA having converged with our 20 EMA as we lost the 200 EMA on the hourly. But then again we are dealing with the mixed channel so bears and bulls are both tugging to win.
🗣️ Descending Channel: I've noted with two parallel markings our descending channel which was dragging prices down before we exited that thus bulls do stand a better chance at regaining a hand if they play the cards right but till we get a breakout, we'll have to stand above $2.00 and wait for either side to break before setting any higher targets.
🗣️ Catalysts: Increased on-chain activity and strong, consistent inflows into spot XRP ETFs are providing a positive backdrop, with some analysis anticipating a potential move toward $3–$4 later in the year
🗣️ Current Concerns: Heavy selling emerged near $2.13, suggesting traders are taking profits, and some analysts believe the price could remain range-bound in the near term.
Leaving things at that for now, wanted to keep this short and simple. Appreciate everyone and all the support as always, keep tuned for more and let's see what the future holds in store for us. Thanks and all the best.
Best regards,
~ Rock '

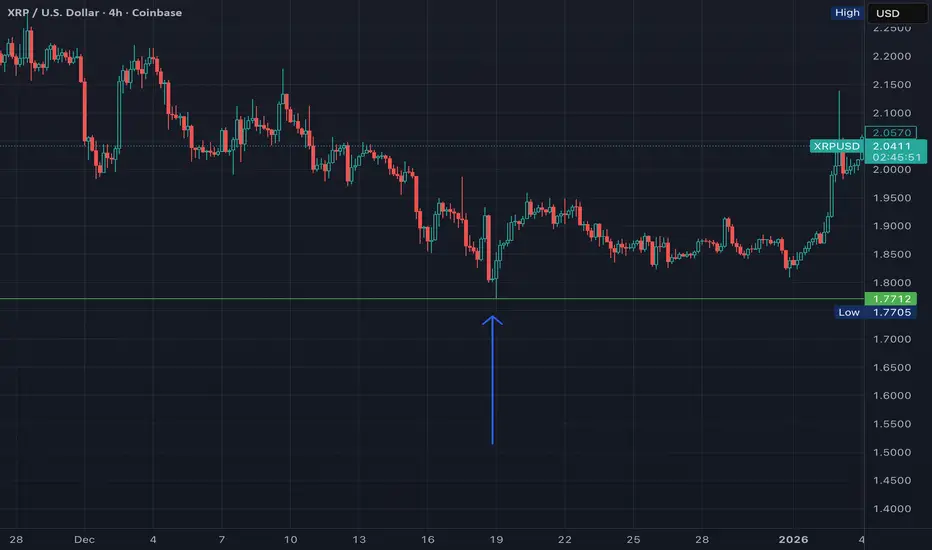
very bullish scenario for XRP (and XRPT 2x daily long etf)I'm expecting an explosive move on XRP over upcoming weeks. From what I see, the final low has now been made on XRP after it took out the lows on 4 hr triple consecutive bearish candle at 1.77 on 12/19/25 (those are often retested for liquidity). This is now the final retracement of the bullish structural breakout zone on 4 hr tf at 2$ range so next comes the steady progression to 7$, 10$ & then 24-26$ likely in 2027. A break above 4$ will reinforce this bullish thesis. I think it's likely to have some continued volatility/choppiness as we progress higher but overall expecting buyer control & bullish dominance at least to 24$ level. (could still have another steep retracement on monthly tf back to 12-13$ range after 24$ is reached so will definitely exit XRPT at those levels out of caution)
Perfect scenario for buying XRPT imo given the immense upside potential on what would be considered a very early entry on a large buy cycle. I would typically not entertain the idea of swinging leveraged ETFs that long but I believe this setup will not disappoint for those open to incorporating some higher volatility instruments for outsized profits.
BMEX – The OG Perps Token Coiling for a Violent Mean-ReversionBitMEX birthed the perp casino long before Binance, Bybit and the rest. Its token has done what most neglected OGs do after launch: bleed inside a clean descending channel while nobody cares.
Now:
• Price has been grinding along the lower half of the channel and just put in a rounded base near the lows.
• Each push down is getting shallower, while bounces are stretching further – classic late-stage compression.
• A reclaim of the mid-channel (dotted line) opens the door for a full channel mean-reversion, with room toward the upper boundary and beyond if we see real FOMO.
In a market where new shiny memes keep rug-pulling, I’m watching the forgotten infra plays – and BMEX fits that bill: OG perp venue, tiny cap, ugly chart that finally looks ready to flip.
I’m not chasing green candles here; I’m stalking the channel break + retest for confirmation. Until then, this sits on my “potential face-melter” list.
As always: not advice, just the map. Trade your own plan.


XRP - Waiting for the Market to Confirm the Next Move!XRP is currently sitting at a key area of interest.
Price is holding around a strong demand zone, right on top of the $2.00 round number. That combination alone is enough to grab attention, especially after the recent impulsive move higher.
For now, this area is where buyers are expected to defend. That’s why my focus is on buy setups, not chasing price.
That said, I’m not jumping in blindly.
The last major high marked in green is the line in the sand. A clean break and hold above that level would confirm that bulls are taking control, and that’s when I’d look for entries with more confidence.
⚠️ Disclaimer: This is not financial advice. Always do your own research and manage risk properly.
📚 Stick to your trading plan regarding entries, risk, and management.
Good luck! 🍀
All Strategies Are Good; If Managed Properly!
~Richard Nasr

Lumens Back up to a Quarter each in 2020inflation mechanism is gone, and the bottom barrel supply distribution is complete
nowhere to go but UP when everyone is either a FOMO buyer in the money, or a bagholder along for the reunion tour

XRP PRICE SEES MIXED SIGNALS ABOVE $2 ⚡️ Happy Sunday, as usual gonna keep this short and quick, got a bit going on with our markets today so let's check things out.
⚡️ Following the recent rally XRP experienced up to that $2.40 mark we can see that things indeed have reversed as we're getting some pretty mixed signals for the market above $2 with the market us showing a lot of caution right now.
⚡️ While it's great we got the rally it's clear the market wasn't able to sustain that upward momentum, especially after our 20, 50 EMA's converged prompting the reversal and ultimately setting us up for the horizontal channel we're dealing with currently. I'll add a chart below for reference:
⚡️ If your not familiar with a horizontal channel it's just a channel that forms when price consolidates and the market isn't too certain what the next move may be to sum it up in short term. We want that breakout but just as we can get the breakout to the upside, the same logic applies to the downside and as I write this it looks like we're getting this bearish confirmation and that exit out of the channel now.
⚡️ The 20, 50 EMA's have also converged on the 30 minute timeframe and it seems we're losing the 200 EMA on the hourly which would likely prompt some more selling, especially without a good support or some change in demand. This may also trigger some liquidations or stop losses if we break that $2 mark so definitely set tabs and an alert in case that happens.
⚡️ I'm confident as always in XRP, just last week alone XRP ETF's hit a trading volume of over $219 million marking a double from the week prior highlighting just how much interest the asset is pulling and it's only a matter of time before things kick into gear, whatever happens now is just the noise. I'll be waiting for the performance if you get what I'm saying.
⚡️ Anyway, I have to go but set that alert for $2 and keep in mind we're focused on the future, not the noise, and as always thanks for everything and wishing all the best till next!
Best regards,
~ Rock '

"Bear Flag" - The Lazy Bitcoin Pattern Every Dog KnowsIt always surprises me how lazy technical analysis has become. What has TA turned into? Google image search "bearish pattern" → draw two parallel lines → post for engagement.
Let's go candle by candle since nobody else will:
Within this "bearish pennant" - which depending on how you draw your trendlines is ALSO clearly a rising wedge - there are about 80 different patterns unfolding. But sure, let's talk about the one pattern your dog could identify.
Here's what kills me: Did anyone mention the micro head and shoulders forming inside this structure? No? Just lazy bear flag posts? Nobody's talking about the patterns within the pattern.
THE STRUCTURE:
Cup & Handle, inverses etc forming inside a Rising Wedge
Inside a Rounded Triple Bottom
Forming the right shoulder of a macro Inverse Head & Shoulders
Micro H&S within the current consolidation
Neckline sits at 97.5K
Broken uptrend now acting as a MAGNET - price will hug this line on the way back up
THE LEVELS (since nobody else gave you any):
Invalidation: 94,266 - Break this and the micro H&S fails
Target 1: 95K - Within 7 days
Target 2: 105K - Within 30 days if structure holds
If bearish plays out: 76,556 zone - If that micro H&S breaks down, there's room for one more push lower
THE REALITY:
In this market you have to adapt like water. If 94,266 breaks and the micro H&S plays out bearish, there's room for a final push down. I'm not married to a direction - I'm married to levels and structure. The market will tell you what it wants to do.
But here's what I know: if you're posting bear flags, you better be short. Post your positions or don't post at all. It's complete nonsense if you can't stand on what you post.
I'm long here.
That's the difference. I'm telling you my position, my invalidation, and my targets. Where's yours?
To the bear flag crowd:
Go take your shorts. Post your entries. Show me your stop loss. Explain the logic behind your actual bearish formation beyond "it looks like the picture I googled."
Give me specific invalidation levels. Tell me where you're wrong. Otherwise you're just posting for likes while real traders are positioning.
95K in 7 days. 105K in 30. I'm long.
Your move.

XRP (1D): Price Consolidation with On-Chain ActivityXRP has moved into a consolidation phase following a large expansion move. Price is currently trading well above the prior base, but below the cycle high, with volatility compressing on the daily timeframe.
At the same time, several on-chain metrics have continued to trend higher.
Observations from the chart
Price remains elevated relative to the long consolidation period prior to the breakout
The 1-year active supply percentage has increased, indicating more coins are moving on-chain compared to earlier periods
Active addresses have shown multiple spikes during and after the expansion, followed by normalization rather than collapse
New funded addresses increased sharply during the breakout phase and remain higher than pre-breakout levels
Total value locked rose materially during the advance and has retraced modestly while remaining above earlier levels
These metrics suggest broader participation compared to the pre-breakout period, even as price consolidates.
Interpretation
The current structure shows price stabilizing after a rapid repricing, while on-chain activity remains elevated relative to historical baselines. This points to redistribution and network usage rather than complete disengagement.
Price is no longer moving with the same momentum as during the expansion phase, but participation metrics have not reverted to prior lows.
What to monitor
Whether active supply and address activity remain elevated during consolidation
Whether price holds above the prior breakout area
Any renewed expansion in on-chain activity accompanying directional price movement
A decline in both price and on-chain participation would weaken this structure.
Summary
XRP is consolidating after a large move higher. On-chain metrics indicate higher engagement than during the prior base, while price trades within a defined range. Further direction likely depends on whether participation expands again or continues to level off.
