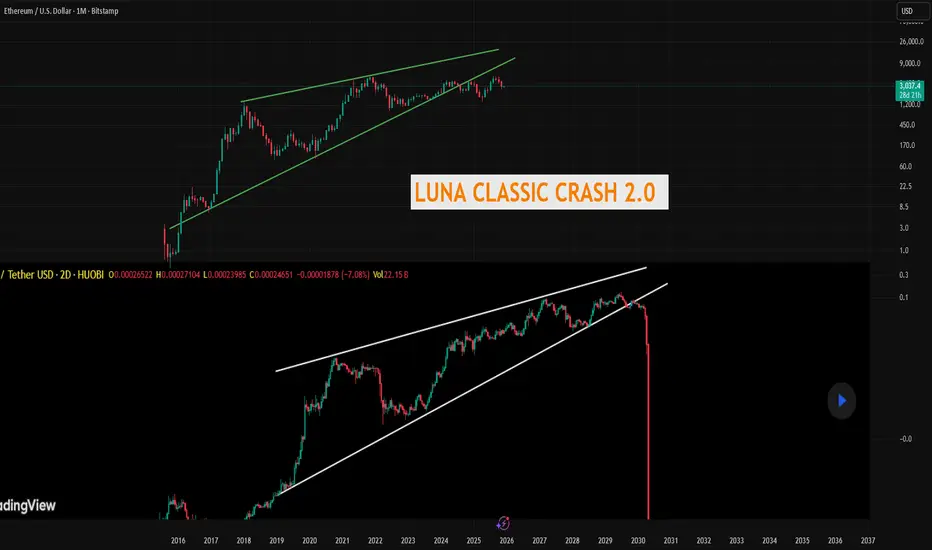
IS ETH ABOUT TO CRASH LIKE LUNA CLASSIC?I pointed this out a couple years ago you can fins my chart in my profile but I think ETH might crash like Luna Classic did. Look at the similarities with the massive rising wedge. ETH is actually outdated, clunky, the fees are stupid high, and its extremely overvalued, in my opinion. I called the Luna Classic crash down to about 50 cents from when it was at its high around 70 dollars, Ill link it below, it went waaay below even my crazy target. People thought I was crazy, go read the comments.
I think the same is on tap for Ethereum. Its already broken below if it cant get back above, I see a waterfall of red candles. What the narrative will be who knows but its coming.
The chart I added of Luna you cant even find it anymore on here this is a screenshot of that chart from my previous ideas.
Not financial advice just my opinion.
Xrp
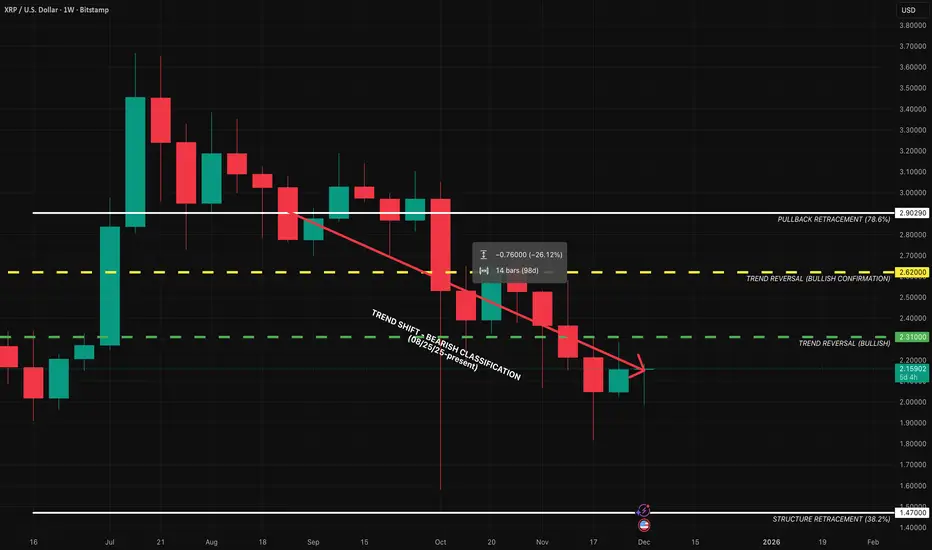
XRP — WEEK 49 TREND REPORTCRYPTOCAP:XRP — WEEK 49 TREND REPORT
Ticker: BITSTAMP:XRPUSD — 12/02/2025 @ 2.15$
Timeframe: WEEKLY
This is a reactive structural classification of XRP based on the weekly chart as of this timestamp. Price conditions are evaluated as they stand — nothing here is predictive or forward-assumptive.
⸻
1) Current Trend Condition
• Trend Duration: +14 weeks (Bearish)
• Trend Reversal Level (Bullish): 2.31$
• Trend Reversal Level (Bullish Confirmation): 2.62$
• Pullback Support: 2.90$
• Structural Support: 1.47$
⸻
2) Structure Health
• Retracement Phase:
Testing Structure (approaching 38.2%)
• Position Status:
Unstable (price below both structural layers)
⸻
3) Temperature
Cooling Phase
⸻
4) Momentum
Bearish
⸻
Author’s Note
This analysis is fully reactive, not predictive. Market conditions, trend structure, and behavior are classified as they appear in real time. The objective is to identify where directional shifts first occurred, where structural integrity remains intact, and where it would begin to weaken if key levels were breached.
Predictive analysis projects outcomes that do not exist yet. Without price confirmation, prediction is built on baseless assumptions. This framework avoids that entirely by responding only to verified structural changes and live conditions.
The levels shown simply identify where the current trend structure first shifted and where it would begin to lose integrity if breached. Recognizing these boundaries allows for clearer interpretation of market behavior without relying on forward guarantees, speculative projections, or unsupported assumptions.
⸻
Methodology Overview
This classification framework evaluates directional conditions using internal trend-interpretation logic that references price behavior relative to its structural layers. These relationships are used to identify when price movement aligns with the framework’s criteria for directional phases, transition points, or regime shifts. Visual elements or structural labels reflect these internal interpretations, rather than explicit trading signals or preset indicator crossovers. This framework is observational only and does not imply future outcomes.
XRPUSD — WEEK 49 TREND REPORT (2D)XRP — WEEK 49 TREND REPORT
Ticker: COINBASE:XRPUSD BITSTAMP:XRPUSD — 12/01/2025 @ 2.02$
Timeframe: 2D
This is a reactive structural classification of XRPUSD based on the 2D chart as of this timestamp. Price conditions are evaluated as they stand — nothing here is predictive or forward-assumptive.
⸻
1) Current Trend Condition
• Trend Duration: +3 BARS (bearish)
• Trend Reversal Level: 2.06$
• Trend Reversal Level ( Confirmation ): 2.26$
⸻
2) Structure Health
• Retracement Phase:
• Testing Structure (approaching 38.2% @ 1.64$)
• Position Status:
• Unstable (price below both structural layers)
⸻
3) Temperature: Cooling Phase
⸻
4) Momentum: Bearish
⸻
Author’s Note
This analysis is fully reactive, not predictive. Market conditions, trend structure, and behavior are classified as they appear in real time. The objective is to identify where directional shifts first occurred, where structural integrity remains intact, and where it would begin to weaken if key levels were breached.
Predictive analysis projects outcomes that do not exist yet. Without price confirmation, prediction is built on baseless assumptions. This framework avoids that entirely by responding only to verified structural changes and live conditions.
The levels shown simply identify where the current trend structure first shifted and where it would begin to lose integrity if breached. Recognizing these boundaries allows for clearer interpretation of market behavior without relying on forward guarantees, speculative projections, or unsupported assumptions.
⸻
Methodology Overview
This classification framework evaluates directional conditions using internal trend-interpretation logic that references price behavior relative to its structural layers. These relationships are used to identify when price movement aligns with the framework’s criteria for directional phases, transition points, or regime shifts. Visual elements or structural labels reflect these internal interpretations, rather than explicit trading signals or preset indicator crossovers. This framework is observational only and does not imply future outcomes.

XRP 4H – Rejected Again, Liquidity Grab Incoming?XRP continues to respect the multi-week descending trendline, forming a clear sequence of lower highs (R1 → R2 → R3). The most recent interaction was a triple confluence: trendline rejection, 50/100 EMA rejection, and a fail at the 0.5–0.618 Fib retracement. The circled area confirms a clean break + failed retest, showing sellers maintaining control.
Price is currently sitting on top of FVG 1 and a small demand pocket. A reactionary bounce toward FVG 2 or the EMA cluster is possible, but the structure remains decisively bearish unless XRP can reclaim the trendline and hold above the golden pocket.
Below, the $1.8476 liquidity line is the major inefficiency. If current demand fails to produce sustained higher lows, a liquidity sweep into that level becomes the high-probability continuation target.
Bias: bearish structure, EMA alignment down, repeated trendline rejections, Stoch RSI resetting for potential continuation.

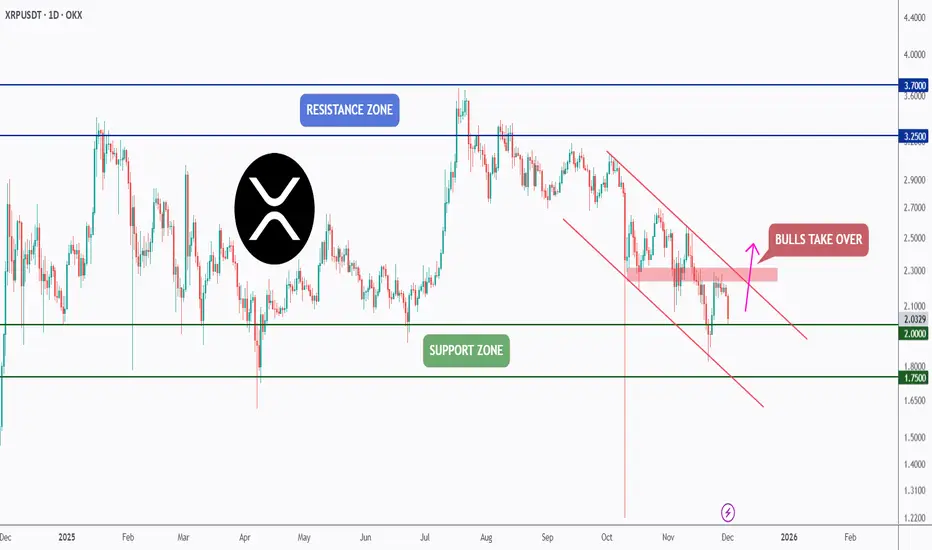
XRP - Support First, Breakout Second!📦XRP has been holding well above its key support zone , and as long as this level continues to act as a floor, we will be looking for long setups. Buyers have defended this zone multiple times, making it a critical area for a potential bullish reaction.
🏹However, for the bulls to fully take over, XRP needs more than just a bounce. A confirmed break above the falling channel and the last major high in red is needed to shift the momentum and open the door for a larger bullish leg.
Until then, the plan remains simple:
Support holds → look for longs.
Structure breaks → bulls take control.
Will XRP finally break free from this falling channel? 🤔
⚠️ Disclaimer: This is not financial advice. Always do your own research and manage risk properly.
📚 Stick to your trading plan regarding entries, risk, and management.
Good luck! 🍀
All Strategies Are Good; If Managed Properly!
~Richard Nasr
XRP Breakdown Risk: Triangle + Resistance = DropXRP( BINANCE:XRPUSDT ) is moving within a resistance zone($2.32-$2.19) and has shown notable reactions to the resistance line and the Potential Reversal Zone(PRZ) .
From a technical analysis perspective, it seems that XRP has formed a Symmetrical Triangle Pattern. If the lower line of this pattern is broken, it would align with our analysis.
Additionally, from an Elliott Wave theory standpoint, we expect the next corrective wave for XRP, and a break of that lower triangle line would confirm this expectation.
I expect that in the upcoming hours, XRP will begin a downward trend and test the support zone($2.16-$2.11). If it breaks through that support, we can expect further declines toward the next support zone($2.04-$2.00) and Cumulative Long Liquidation Leverage($2.04-$2.02).
First Target: $2.133
Second Target: $2.069
Third Target: $2.043
Stop Loss(SL): $2.330
Cumulative Short Liquidation Leverage: $2.30-$2.25
Cumulative Long Liquidation Leverage: $2.16-$2.13
💡 Please respect each other's opinions and express agreement or disagreement politely.
📌 XRP Analyze (XRPUSDT), 1-hour time frame.
🛑 Always set a Stop Loss(SL) for every position you open.
✅ This is just my idea; I’d love to see your thoughts too!
🔥 If you find it helpful, please BOOST this post and share it with your friends.

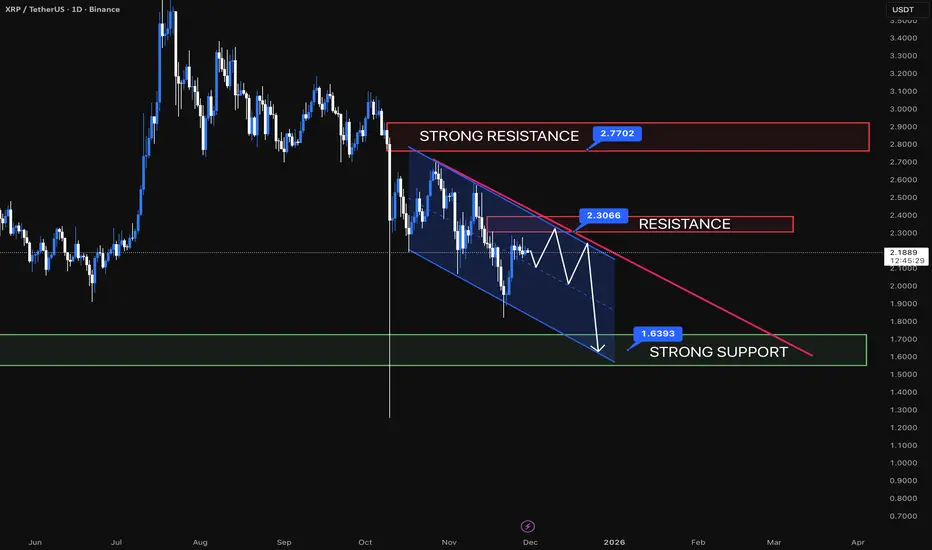
XRPUSDT /// 30NOVRipple, a project often surrounded by controversy, appears to have entered another period of low momentum. The $2.30 resistance may continue to cap price for an extended period, and an even stronger supply zone exists around $2.77, where sellers have historically shown significant activity. If price were to revisit that area, it could once again trigger downward pressure toward the $2.00 region or lower.
Overall, XRP is currently trading within a micro-channel structure, where the downward bias appears stronger than the bullish momentum. This raises an important question for long-term followers of the project:
Where could a potential investment zone be considered?
Based on the chart, the $1.40–$1.60 area could be a reasonable region for a speculative, swing-oriented entry—provided that the structure and quality of the move into that zone become clear. Observing the nature of the decline will be essential to determine whether XRP has the potential to recover from that level or if it is likely to remain in a prolonged low-volatility phase.
As always, these scenarios depend on broader market conditions and the strength of momentum as price approaches key levels.
XRP Update🚨📊 XRP Update
XRP is testing the red resistance zone right now 🔴.
If price manages to break out above this red level,
the first target will be the green line level 🟢 —
the next key zone on the chart.

XRP/USD LONG SET UP TRADETitle: XRP/USD (RIPPLE) BUY
Asset: Crypto
Symbol: XRP/USD
Market Entry Price 1: $2.19
Stop Loss: $2.14
Take Profit 1: $2.24
Take Profit 2: $2.28 (close 25 %)
Take Profit 3: $2.34 (close 50%)
Take profit 4: $2.45
Status: ACTIVE

Catch XRP's Run EarlyThis is the 3 month timeframe for XRP but it shows a clear pattern of support along the upper line of the Gaussian Channel indicator
A breakout has already begun but there is potentially more to this run if you compare it to the first bull run.
Support will be found above the broken trend line in red

XRP RoadMap (1D)Let's take a look at Ripple to see what fluctuations it may experience over the next month or two.
We considered the upward move in 2024 as Wave A, the following correction as Wave B, and the third rise as a terminal 5-wave structure.
The sharp downward move is considered a post-pattern terminal, and now the waves we are in are regarded as a bearish cycle, forming an expanding/diametric/symmetrical triangle.
Whatever the larger pattern is, in aggregation it seems that the price will move downward from the red zone to the short-term targets marked on the chart.
The targets are marked on the chart.
A daily candle closing above the invalidation level will invalidate this analysis
For risk management, please don't forget stop loss and capital management
When we reach the first target, save some profit and then change the stop to entry
Comment if you have any questions
Thank You

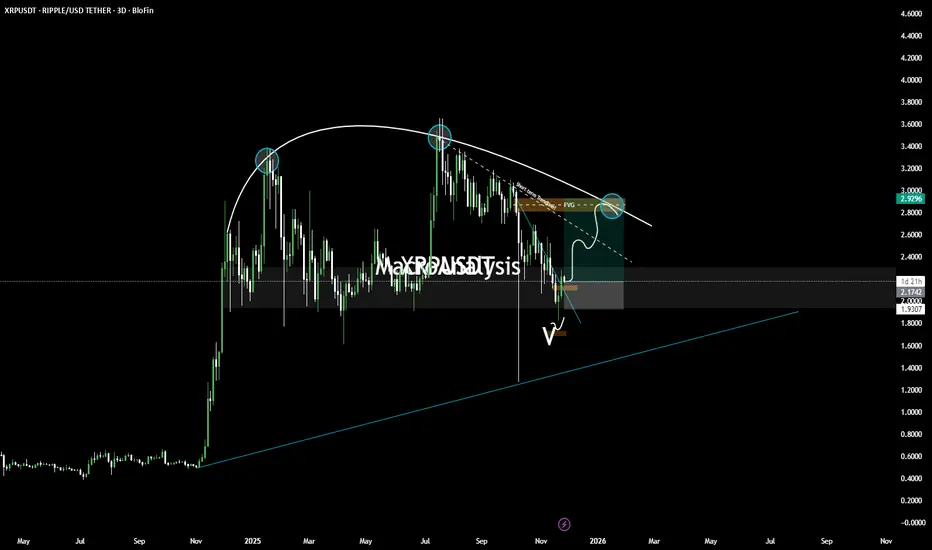
XRP — Major Macro Reversal Loading? XRP is completing a long-term structural pattern that has been developing for months. This setup includes a rounded top distribution, a full breakdown into major demand, and a potential reversal structure forming at the bottom.
This idea outlines both bullish and bearish pathways based on higher-timeframe confluence.
🔍 1️⃣ Rounded Top Distribution Completed
XRP formed a clear rounded top on the macro chart, with three major distribution points (highlighted).
Each point shows diminishing momentum and repeated rejection from the declining macro trendline.
This structure typically precedes:
Liquidity sweep lower
Long accumulation phase
Then high-timeframe reversal
We’re now entering the second phase.
🔍 2️⃣ Price Now Sitting in Major Higher-Timeframe Demand
Price has dropped directly into a large daily/3D demand block that held all previous macro corrections.
This zone aligns with:
Old imbalance fills
Breaker structure retest
Long-term ascending trendline below (blue line)
This is where macro buyers have stepped in before — and may do so again.
🔍 3️⃣ Bullish Scenario (Blue Path)
If price confirms demand strength, the bullish pathway is:
Sweep of local V-shaped liquidity
Retest of micro trendline (white dashed)
Break above the short-term breaker + FVG layer
Move toward the $2.95–$3.10 area (macro rejection zone)
This is the first major upside target.
A full reclaim above this level opens the door for a much larger trend reversal.
🔍 4️⃣ Bearish Scenario (White Path)
If demand fails, watch for:
Deviation above micro resistance
Rejection from FVG / breaker
Breakdown of V-swing formation
Deeper move toward long-term trendline support below
This would create a deeper macro accumulation before any major bullish cycle.
🎯 Summary
XRP is at a macro inflection point
We have:
Completed distribution
Full retest of long-term demand
Early signs of reversal structure
Clear upside targets and invalidation levels
This is a high-timeframe educational structure outlook, not a signal.
📘 Disclaimer
This post is for educational purposes only and reflects personal market analysis. It is not financial advice or a trade signal. Always DYOR and manage your own risk.
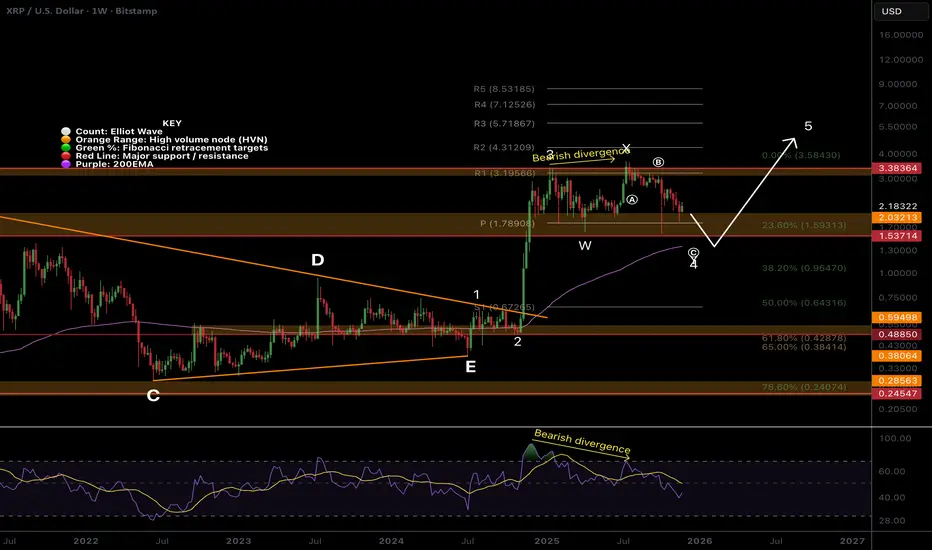
$XRP count changed, wave 4 underwayCRYPTOCAP:XRP Wave 4 appears to be a flat correction defined by the poke above the all-time high. Wave 4 is expected to end at the 0.382 Fibonacci retracement, also the weekly 200EMA ~$1.2.
The multi-year triangle is a penultimate move, so continuation in wave 5 to price discovery is my preferred count. For no,w price is stuck in a range aboev the weekly pivot.
🎯 Terminal target for the business cycle could see prices as high as $4.31 based on the weekly pivots
📈 Weekly RSI is bearish with room to fall after printing bearish divergence
👉 Analysis is invalidated if we fall below $0.64, as wave 4 can not go below 0.55 Fibs
Safe trading
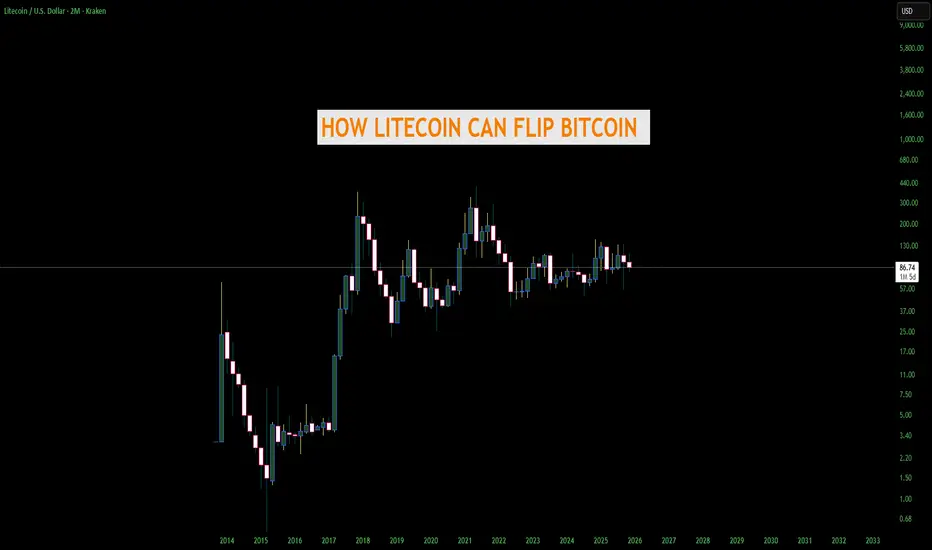
THE DAY LITECOIN FLIPS BITCOIN AND BECOMES #1 - AND HOWGrok helped me with this but regardless this is a great read. Not financial advice
1. Bitcoin fees explode again (> $50–$200 per transaction)
LTC stays under 5¢ and 4× faster → merchants & users flee to “digital silver” for actual payments
-Historical precedent: May 2017 & Dec 2017 fee madness → LTC pumped from $4 → $375 in weeks; repeated in May 2021 → $410 ATH
2. Bitcoin blocks stay full for months (Ordinals / Runes / BRC-20/ and now unlimited SPAM clog the chain again)
People rediscover Litecoin as the cheap, fast, on-chain alternative that actually works for daily spending
-Historical precedent: 2023–2024 Ordinals era → LTC quietly 3×–4× while BTC was practically unusable for small amounts
3. Major nation/state bans or heavily restricts Bitcoin mining or self-custody
LTC is smaller, less of a political target → miners add Scrypt rigs, capital rotates
-Historical precedent: China 2021 mining ban → Litecoin hashrate and price both spiked hard in the following months
4. A confirmed 51% attack or large double-spend actually happens on Bitcoin
Trust in BTC’s immutability shatters overnight → Litecoin (merged-mined with Dogecoin) suddenly has higher combined attack cost and looks safer
-Historical near-miss: 2018–2019 51% attack fears on smaller chains sent LTC up +150% in pure rotation plays
5. Credible quantum-break announcement or real progress scare (2026–2030 timeline moves up)
Litecoin’s MWEB addresses are already quantum-resistant + dev team can soft-fork faster than Bitcoin’s politics allow
-Historical precedent: 2023–2024 quantum FUD alone gave privacy coins and quantum-ready projects 3–10× pumps
6. Litecoin ETF (e.g., Canary Capital's) faces post-launch outflows or SEC-mandated tweaks due to BTC ETF dominance, while Bitcoin ETFs pull in record inflows
BTC ETFs become the unchallenged "institutional safe bet," capping BTC's retail upside → sidelined investors, retail traders, and altcoin funds rotate into the now-proven LTC ETF as the "next logical step" for legacy alts (with Canary/Grayscale already live and showing strong early volume)
-Historical precedent: ETH ETFs in 2024 saw initial outflows vs. BTC's inflows → ETH still 2–3×'ed on rotation; SOL's 2025 ETF launch pumped despite similar early teething issues
7. Lightning Network suffers major centralization scandals, hub failures, or routing collapses
People remember Charlie Lee’s original pitch: simple, fast, cheap, on-chain money with no layer-2 headaches
-Historical precedent: 2023–2025 Lightning UX complaints repeatedly drove spikes in LTC daily transaction volume and price
8. Bitcoin loses the “first-mover narrative” to a new nation-state adoption
Example: a major country (Brazil, Argentina, Indonesia, etc.) announces it will use Litecoin instead of Bitcoin for remittances or reserves because LTC is 4× faster and 100× cheaper.
-Precedent: El Salvador 2021 BTC adoption pumped Bitcoin; a “Litecoin country” would do the same or more for LTC.
9. PayPal, Venmo, Cash App, or Stripe re-activates Litecoin for instant zero-fee withdrawals/deposits
They all supported LTC years ago and dropped it only because of 2018 bear market. One click to flip it back on → instant 50–100 million new users.
-Precedent: PayPal adding BTC in 2020 → +300 % pump in weeks; LTC would explode harder because it’s actually usable on their rails.
10. Dogecoin merges fully with Litecoin (merged-mining → full auxiliary chain)
-Precedent: DOGE pumps in 2021 dragged LTC up 4–6× every single time. A real technical merger would be 10× stronger.
11. Major exchange or custodian loses billions in Bitcoin (think FTX 2.0 but only BTC exposed)
Users rush to self-custody the one big coin that still has sub-$0.01 fees and 2.5-minute confirmations → Litecoin.
-Precedent: FTX collapse 2022 → LTC was one of the only coins people could actually withdraw fast and cheap.
12. SEC or European regulator classifies Bitcoin as a “security” or “commodity with special rules” but explicitly says Litecoin is a commodity/currency
Institutions that were forced to sell BTC rotate the exact same thesis into LTC overnight.
-Precedent: XRP SEC case resolution in 2023 caused instant 3× pump; same mechanics.
13. Bitcoin Core development stalls or splits again (Blocksize Wars 2.0)
Big-blockers and users frustrated with ossification move money and hashrate to the chain that kept Charlie Lee’s original “faster, lighter” vision alive.
-Precedent: 2017 Bitcoin Cash hard fork → LTC price went parabolic as the “peaceful middle ground.”
14. Global remittance giants (Western Union, MoneyGram, Wise) quietly switch backend rails to Litecoin
They already tested LTC in 2017–2019. A single press release announcing “instant global transfers for pennies” using Litecoin would add billions in real volume.
-Precedent: Ripple/XRP partnerships in 2018 caused 10× pumps even when adoption was tiny. Real adoption would be insane for LTC.
BTC Cup and Handle Still Not CompleteAs you can see the SPX broke out of the cup and handle and completed the measured move. It then corrected back down to the top of the handle and resumed its uptrend. This is what is coming for Bitcoin. Bitcoin has only half way completed the cup and handle. Measured move to around 300k before correcting back down to 70k and then back off to the races. Hold onto your hats. That would be the most epic move of all time a straight shot from here to 300k no pullback then slam back down to 70k and then back up to 500k. Could happen fast dont underestimate Bitcoin.
Just my opinion not financial advice.

Litecoin LTC/USD Buy The Fear Sell The EuphoriaI haven't made a Litecoin chart in a while. We've been sideways and uneventful, figured I would wait till something eventful happens. Well here it is folks , the moment before we actually move up everyone is selling except for a few smart hands. This fractal says it all in my opinion. fractals are usually very similar but not exact. Where we are now in price for Litecoin around 83 is really close to the bottom of this pullback. It washed out and cleaned up all the leverage, a very common occurrence in this market before large moves up. The move will be absolutely explosive and probably no meaningful pullback until we break the all time high. I see a pullback to retest the high before the next massive leg up.
Right now in my opinion is the worst place to sell. I know this "bear market" is not a real bear market because of how many people are saying it is. The whole world says its a bear market right now, every youtube grifter has pivoted to bear market recently with this drop, every news channel is saying it is. Thats why its not, most have sold already and now the price I believe will rebound so fast it'll shock everyone and the ones who sold will be in denial waiting for the "next low". When that low doesn't come and we break the highs they will all pile back in.
Everyone says oh this moving average, or this indicator, or this RSI. Look its all helpful stuff but its also all imaginary lines. Who says that we MUST be in a bear market because we broke a 200 day moving average. Who says because RSI is overbought we must go down. RSI has infinite different adjustments so whos to say that the 14 length is correct? These indicators will begin to fail over time as more and more people look at them. Right now there is more traders and wanna be traders in the world than ever before so if everyone is looking at the same thing all the time then most likely those will start to fail. Oh its happened every time before , I know , I know. Come on at the end of the day Bitcoin is still in its infancy. I dont buy the four year cycle, or seasonality crap, its foolish and betting your portfolio on those factors alone is a recipe for BROKE! I still stand by my previous long term predictions. Obviously its taking much longer than I expected but timing these things is nearly impossible on the long term time frame. While all the youtube grifters flip flop weekly I listen to the Billonaires and people who MAKE the markets. Saylor said three days ago the pullback is almost over and hes buying. Blackrocks Robbie Mitchnick says this is a good buying area and thats just a couple theres dozens of big wigs saying the same thing.
So to wrap this up I believe we are at the point of rocket ship. Look at economic factors, liquidity worldwide is expanding, stimulus is coming, tightening is ending, rates are coming down. Fiat currencies worldwide are about to go into hyperinflation and certain cryptos will reap the benefit of that. Bitcoin and Litecoin being the top gainers in this next phase of hyperinflation in my opinion. This is just my opinion and not financial advice. Thank you

TradeCityPro | XRP Bulls Eyeing Key Support for Surge👋 Welcome to TradeCity Pro!
In this analysis, I want to review the XRP coin, one of the oldest cryptocurrencies, with a $124 billion market cap, currently ranked 4th on CoinMarketCap.
⏳ 4-Hour Timeframe
After the recent market decline, XRP was one of the coins that managed to recover well. It was supported at 1.8733, and with the activation of the 2.0383 trigger, the price made an upward move.
✔️ Currently, the price is at a very important support zone, and as you can see, it is reacting to this level.
💥 The RSI oscillator has moved close to the overbought zone. If it enters this zone, the momentum of this coin will increase significantly, and the price could continue its bullish movement, potentially reaching higher levels.
✨ If the support zone holds, we can open a long position.
For a more accurate trigger, it's better to wait until the price touches this level a few more times and then activate the trigger.
🔔 The next resistance zones for XRP are 2.3404 and 2.5508, which can be used as targets.
The main trigger for confirming the bullish trend on higher cycles will be the break of 2.5508.
🔍 If the price gets rejected from this level and moves back toward 1.8733, we can open a position if volume starts to increase, using a candlestick setup. Otherwise, we can enter with a break of 1.8733.
📝 Final Thoughts
Stay calm, trade wisely, and let's capture the market's best opportunities!
This analysis reflects our opinions and is not financial advice.
Share your thoughts in the comments, and don’t forget to share this analysis with your friends! ❤️

XRP Approaching Key Supply Zone: Break or Reject?Hi!
Bullish Scenario
A bullish continuation becomes likely only if price breaks and closes above the $2.12–$2.18 S&D zone.
If that happens:
Buyers regain control
A retest could confirm support
Next target -> descending trendline at $2.35–$2.45
Conclusion:
Break S&D -> Long toward the descending trendline.
Bearish Scenario
If price rejects from the S&D zone and fails to reclaim $2.12–$2.18:
Momentum shifts back to the downside
Price may retest the $1.90–$1.92 zone, the most recent low
Further breakdown could lead to new cycle weakness

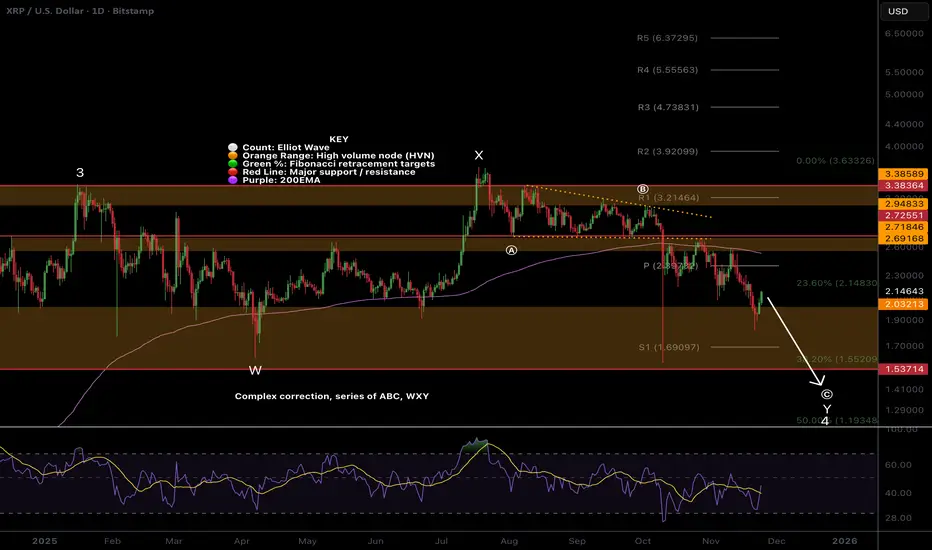
XRP count changed, wave 4 underwayPrice appears to have completed a WXY after the Oct 10th flash crash, but further downside is possible to complete wave 4.
Wave (B) completed a barrier triangle, which suggests the thrust down was the final move before reversal. Price has revisited the wick- expected price behaviour, and we are now looking for a bottom.
Price is below the daily 200EMA and pivot, which is bearish.
📈 Daily RSI reached oversold with no divergences
👉 Continued downside brings up the $1.75 High Volume Node EQ
Safe trading
Bitcoin Time-Channel CyclesYellow = 1064d expansion
Green = 658d mean node
Blue = 364d compression
This chart documents a repeating BTC time-channel structure built from prior cycle highs and lows. The goal here is not to force a price prediction, but to show that Bitcoin has been respecting a consistent rhythm in time and slope across multiple market regimes. When the previous major ATL is used as the anchor, the next macro expansion phase has repeatedly aligned with a ~1064-day duration. That expansion window is displayed as the larger corridor, and it has now shown up cleanly from the 2015 ATL into the 2017 ATH, from the 2018 ATL into the 2021 ATH, and again from the 2022 ATL into the 2025 ATH..
Inside each 1064-day expansion corridor, a secondary time node appears at roughly 658 days, which is the golden-ratio contraction of the full expansion cycle. What’s notable is that price has not been randomly positioned at this midpoint in time. Instead, it has repeatedly migrated back to the mean of the rising channel near the 658 day mark, acting like a structural equilibrium reset within the broader uptrend. This “mean hit” behavior is visible across cycles and is one of the main reasons to watch time geometry alongside price geometry. After the mean-hit, the market has historically rotated into the final leg of the expansion phase before completing the cycle high.
Following each macro high, the bearish compression phase has clustered around ~364 days, shown as the blue corridor. These reset windows are materially shorter than the expansion windows, which matches the observed tendency for bullish advances to build over years while bearish phases compress into faster, more volatile declines. The expansion to compression ratio is close to 3:1, reinforcing the idea that the market “inhales” slowly and “exhales” quickly in time. The important takeaway is that the model is not asking price to obey a specific number; it’s showing how price has behaved inside repeating time-based corridors, with the mean of the channel acting as a magnet around the 658 day node.
This framework is shared as a structural study, not a guarantee. Markets can mutate, and no historical symmetry is permanent. However, when a time-channel sequence repeats cleanly across multiple cycles, it becomes a useful way to frame expectation, especially for identifying where equilibrium touches and regime shifts are statistically more likely to occur. If this rhythm continues to hold, future cycle windows can be mapped the same way, with the emphasis placed on time-based decision zones and mean reactions rather than on any single price target.

LTC Litecoin Poised For Something Big Macro Style I still see lots of people selling and capitulating. Thats ok that cant be prevented, most have no idea how markets work and those same people are afraid of their own shadow. The capitulation is almost over. I just want to point out the confluence of various indicators on the macro long term time frame pointing to a massive bull run for Litecoin. This is not financial advice just my opinion. Like and follow for more updates.
XRPUSDT.P - November 22, 2025The chart for XRPUSDT shows a sustained downtrend, confirmed by a descending trendline and a consistent pattern of lower highs and lower lows. Price action is currently consolidating below the trendline, with resistance around 1.95 and key support marked near 1.72 and 1.32. Momentum remains bearish; a failed recovery above resistance could trigger a sharp move down to the next support zone. If buyers regain control and break above the trendline, a short-term reversal toward 1.95 is possible, but overall trend structure favors sellers.

Market Outlook: Bitcoin Path to $150KThe broader structure on Bitcoin still points toward a long-term expansion into and possibly above the $150K region, but the chart is showing as always that we won’t get there in a straight line.
Just like when I previously predicted Bitcoin’s move to $108K (See my 2021 Bold but slightly off in timing call here: ), the current setup is following the same pattern of exhaustion → correction → expansion. The signs are repeating and becoming clear again: momentum is slowing, resistance is rejecting harder and faster than ever, and volume is now tapering off. When this happens, the market usually needs a deeper reset before the next major leg to the upside.
A pullback into the $70K–$75K zone looks not only possible but healthy, not just for Bitoin but the entrie crypto market. If i was a first time investor and this played out this level would be where I steadily start to invest slowly week by week across the major favorites like Ethereem, XRP, Litecoin, Solana, Cardano, Chainlink, etc
This pullback area below 75k aligns with:
• A major liquidity pocket that has not been tapped
• The previous breakout zone needing a retest
• An ideal discount region for larger institutions to reload
• A level that would wipe out overleveraged longs and rebalance the crypto market
The drop have been and will feel even more painful to longer term investors, especially for new buyers or late comers wo came in above these numbers, but this kind of correction is exactly what fuels the next macro wave or what we like to call the next BULL RUN.
Once BTC finds support in the $70K–$75K range and reclaims that zone, the next bullish impulse opens up and that’s where we get the continuation toward the $150K macro target. The structure, liquidity map, and long-term momentum all support this trajectory.
In short:
Short-term: a deep corrective pullback.
Mid-term: stabilization and accumulation.
Long-term: the trajectory remains intact for a push toward $150K in the coming few months to couple years, just like that 2021 $100K call.
Stay Ready!
