XRP Is Ready For Blast Off!I foresee a big pump coming for XRP. When support is found, the big picture accumulation pattern should take us soaring to new all-time highs in a mass adoption phase. I am very excited about this coin and firmly believe we will see a strong run. Based on fractal analysis, it looks very similar to its first accumulation fractal.
As always, stay profitable.
- Dalin Anderson
Xrp

XRP | Looking for All-Time HighsXRP | Looking for All-Time Highs
📊 Market Sentiment
Overall sentiment remains bullish, supported by expectations of a 0.25% rate cut in the upcoming FOMC meeting. A weakening USD and increasing global risk appetite are creating favorable conditions for further upside in crypto assets.
📈 Technical Analysis
Price ran liquidity at $2.81 and closed above with a strong reaction.
A 4H demand zone formed after the break of structure, and price found support there.
Currently, price is moving towards the bearish trendline.
If price breaks and closes above this bearish trendline, I will be looking for long entries targeting new highs.
📌 Game Plan
I will wait for price to break and close above the bearish trendline.
Then, I will look for a retest and bounce slightly below or at the trendline before entering.
🎯 Setup Trigger
A 1H market structure shift will be my confirmation for entry.
📋 Trade Management
Stoploss: 1H swing low confirming the BOS
Targets: TP1: $3.14 | TP2: $3.38
💬 Like, follow, and comment if you find this setup valuable!
⚠️ Disclaimer: This content is for informational and educational purposes only and does not constitute financial, investment, or trading advice. Always do your own research before making any financial decisions.

XRP/USD 1D Chart ReviewFormation
The chart shows a narrowing symmetrical triangle (orange lines).
The price is now in the lower part of the triangle, with support around $2.80–2.79.
If the price breaks out of this consolidation, we could see a larger trend move.
Supports
$2.80–2.79 – local support (lower line of the triangle).
$2.63 – strong horizontal support, reinforced by the earlier rebound.
$2.46 (SMA200) – key intermediate-term level.
Resistances
$3.00–3.08 (SMA50) – first major resistance.
$3.17 – next barrier.
$3.42 – strong resistance from July.
Indicators
MACD: below the 0 line, negative histogram → bearish signal, but no strong downward momentum yet.
RSI (41): close to the oversold zone, but still neutral-weak – no clear divergence.
SMA50 (red) is falling and is above the price → selling pressure.
SMA200 (blue) is rising and acting as medium-term support.
Scenarios
Bullish – a rebound from the lower boundary of the triangle (2.80) and an attack on $3.00–3.08. A breakout from the upper boundary of the formation will open the way to $3.42.
Bearish – a breakout below the $2.80–2.79 zone → a test of $2.63 and deeper into $2.46 (SMA200).
Summary
The market is at a critical juncture – price is squeezed within the triangle, indicators are neutral-weak, and volume is decreasing. A breakout from this consolidation (most likely in early September) will set the course for the next move.
👉 If you're trading short term, maintaining the $2.80 level is key.
👉 If you're trading medium/long term, only a break above $3.08–3.17 will provide a strong bullish signal.

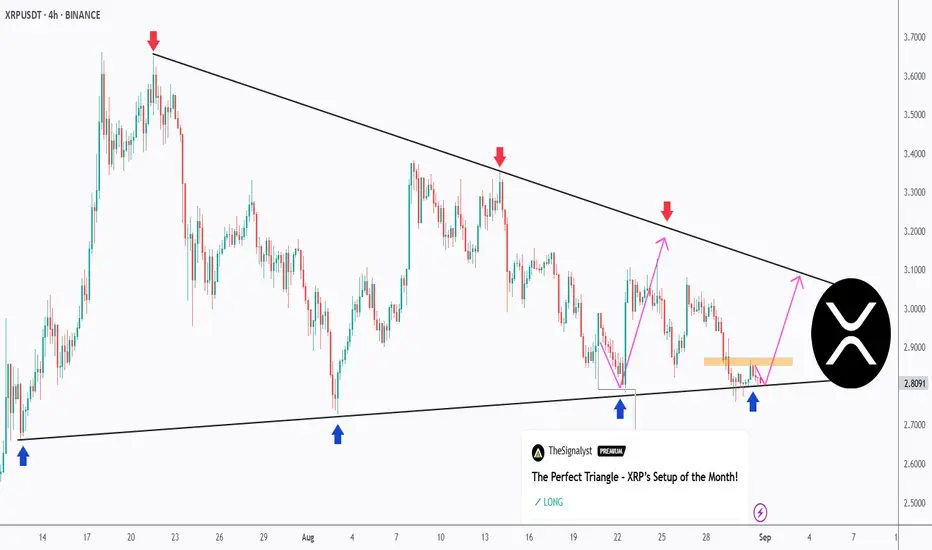
Let’s Do It Again – XRP Retests the Triangle Support!XRP continues to coil inside a textbook symmetrical triangle on the 4H timeframe.
🔻 Sellers remain active at the descending trendline (red arrows).
🔹 Buyers are once again stepping in at the rising support (blue arrows).
📉 Price is now retesting the lower bound of the structure. As long as this zone holds, we can anticipate another potential bounce toward the upper boundary.
🚀 For the bulls to take full control, a break above the last high marked in orange is needed. A confirmed breakout from this triangle will likely define XRP’s next major move — either continuation higher or a bearish breakdown.
This clean and well-defined triangle keeps XRP among the most exciting setups to watch right now!
⚠️ Disclaimer: This is not financial advice. Always do your own research and manage risk properly.
📚 Stick to your trading plan regarding entries, risk management, and trade execution.
Good luck!
All Strategies Are Good; If Managed Properly!
~Richard Nasr
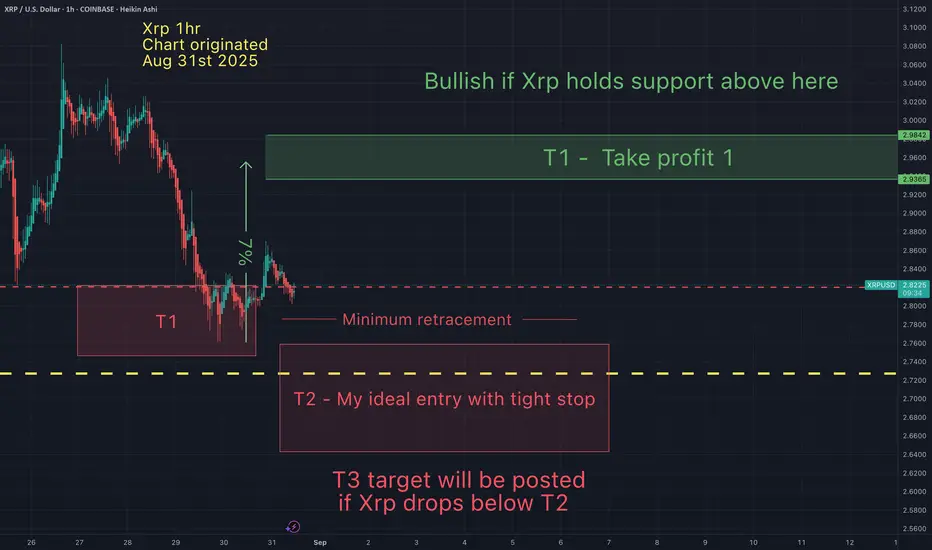
Xrp - Support and resistance & my take profitsThese are my Xrp support and resistance & my take profits. I've been patiently waiting for price to come to me. Now that my T1 has been hit, I'm hoping for a swipe of those lows for my ideal entry. I am cautiously bullish, because there is a chance Xrp goes one leg lower. For now I will chance a long from T1 and T2 (with tight stops) and take profit at my green T1 box.
Ripple ( $XRP ) is literally the reflection of 2017The current wave movements of XRP appear to be a reflection of the period from 2013 to 2017. We are in a re-accumulation phase before the next major upward wave.

XRP LABOR DAY SALEXRP HIT A CRITICAL SUPPORT ZONE BETWEEN $2.80-$2.76
Xrp can head back towards $3 to test resistance. If xrp breaks $3 it can head to $3.50 and breakout towards $5 on the weekly charting
This is not financial advice. Good luck!
-R2C

XRP will retest the support line ┆ HolderStatBINANCE:XRPUSDT on the daily chart shows a consolidation breakout, now retesting the 3.26 resistance. A false break scenario may fuel bullish continuation toward 3.50–3.80. Strong support remains near 2.80, keeping the higher-low structure intact.

$XRP: Ripple’s Rocket – Ready to Soar or Facing Turbulence?(1/9)
Good evening, everyone! 🌙 CRYPTOCAP:XRP : Ripple’s Rocket – Ready to Soar or Facing Turbulence?
CRYPTOCAP:XRP ’s up 8.4% despite a crypto crash, with SEC rumors fueling hope—but will adoption or regulation steer this rocket? Let’s dive in! 🔍
(2/9) – PRICE PERFORMANCE 📊
• Recent Trend: Gained 8.4% despite a crypto market down 20.57% in Feb, per U.Today 📈
• 2025 Context: Speculation of SEC appeal dismissal boosts sentiment 📏
• Sector Trend: Crypto market down, but CRYPTOCAP:XRP bucks the trend 🌟
It’s a fighter, shaking off the bears! ⚙️
(3/9) – MARKET POSITION 📈
• Ranking: Remains a top 10 cryptocurrency, per CoinMarketCap 🏆
• Use Case: Leading in cross-border payments with RippleNet ⏰
• Trend: Regulatory clarity hopes rise, potentially unlocking more adoption 🎯
Firm, a key player in the altcoin arena! 🚀
(4/9) – KEY DEVELOPMENTS 🔑
• SEC Case: Closed-door meeting Feb 27 fuels dismissal talk, per Ripple CEO’s X post 🔄
• Adoption: RippleNet partnerships expand, with new banks joining for faster payments 🌍
• Market Reaction: Up 8.4% amid market turmoil, showing resilience 📋
Adapting, with legal and adoption catalysts! 💡
(5/9) – RISKS IN FOCUS ⚡
• Regulation: SEC case uncertainty persists, appeal process ongoing 🕳️
• Market Volatility: Crypto market’s unpredictable swings can hit hard ❄️
• Competition: Other blockchain platforms vying for cross-border payment dominance ⚖️
Tough, but risks are part of the game! 🛑
(6/9) – SWOT: STRENGTHS 💪
• Resilience: Up 8.4% when others fall, showing strong investor confidence 🥇
• Utility: RippleNet’s fast cross-border payments attract banks and institutions 📊
• Community: Robust support from holders and Ripple’s strategic partnerships 🔧
Got fuel in the tank! 🏦
(7/9) – SWOT: WEAKNESSES & OPPORTUNITIES ⚖️
• Weaknesses: SEC case not fully resolved, adoption slower than hoped 📉
• Opportunities: Potential ETF approval, expanding CBDC projects, and new partnerships 📈
Can it break free and soar? 🤔
(8/9) – 📢 CRYPTOCAP:XRP ’s up 8.4% despite market crash, SEC buzz grows, your take? 🗳️
• Bullish: $3+ soon, legal win sparks rally 🐂
• Neutral: Steady, risks balance ⚖️
• Bearish: Below $2, regulation stalls 🐻
Chime in below! 👇
(9/9) – FINAL TAKEAWAY 🎯
CRYPTOCAP:XRP ’s resilience amid a market crash shows its mettle 📈, but SEC uncertainty and competition pose challenges 🌿. Volatility’s our friend—dips are DCA gold 💰. Grab ‘em low, climb like pros! Gem or bust? S

XRP is moving inside the triangle ┆ HolderStatBINANCE:XRPUSDT on the 16h chart shows a triangle formation developing after a recent high at 3.48. The market is compressing between support and resistance, building energy for the next move. Holding above 2.80 keeps the bullish structure intact, with 3.30 as the breakout level to watch.

#XRPUSDT - UniverseMetta - Analysis#XRPUSDT - UniverseMetta - Analysis
Setup for potential wave 5 continuation
📆 W1 – Weekly Timeframe
🔹 Price has spent over a month in a corrective structure following the completion of wave 3
🔹 A continuation of the 5th wave in the broader uptrend is possible — if price breaks and closes above the trendline
🔹 A down fractal may serve as a key trigger for the next bullish impulse
🎯 Medium-term structure target: $4.32 (Wave 5 — 2.618 Fib from Wave 1)
📉 D1 – Daily Timeframe
🔹 Price has formed a triangle consolidation — signaling potential breakout soon
🔹 Breakout of the upper trendline could lead to a strong upward continuation
🔹 If the move extends as part of a broader correction, we may see targets up to $5.17 (2.618 Fibonacci extension)
🎯 Key resistance zones:
• $4.32
• $5.17
🎯 Trade Idea:
#XRPUSDT #BUY
Entry: 3.1275
Take Profits (TP):
• 3.5193
• 3.7917
• 4.0420
• 4.4544
• *5.1642
Stop Loss: 2.7723
‼️ Risk exposure should not exceed 1–3% of your portfolio
This signal/idea is not financial advice

XRP to $5.50XRP is in its 5th wave, and based on this weekly bull flag, it could reach $5.50 after breaking the resistance line.

TOTAL - total cap crypto "this looks bad," Not saying I've done trivial work in effort to determine the end of an Elliott wave phase peak; so, the chart looks like an Elliott wave does it not? The previously major halving did not have a similar chart where an Elliott wave 1,2,3,4,5 happened. This time it does look like that. Is it possible to have 6,7 phase inclusive to the chart albeit from the idea that Elliott wave means nothing to the new community of virtual currency digital money defi tropes meme derivative foreplay variable online meta landscape of the future? If I was betting on history repeating itself and the looks of the chart here for all cryptocurrency I would say this is not good looking for me, a guy who has made literally no money on cryptocurrency since the last halving despite trying so many times. The world is against me, the trends are fake, the people in society are all brainwashed by propaganda war machine rhetoric political asylums and the minority reports of mainstream majority peoples. Why now? Why not? I'm not looking forward to losing more money then I already have. I haven't made money. Online news doesn't help. Content creators don't help. My family does not help. These indicators which I feel I have a strong understanding of, do not help. Cryptocurrency is too volatile and unpredictable in ways that prevents mathematical decision making becoming profitable. The major players that control the phases of time are established based on the backs of working class people, and savings. We created a monster(s). Now those monsters are eating cryptocurrency for lunch. Cryptocurrency ≠ main course.

XRP 4H – Golden Pocket Rejection, Can Support Zone Hold?XRP is consolidating between major Fibonacci levels and clearly defined supply/demand zones. Price has rejected the golden pocket (0.618–0.786) around 3.15–3.25, leaving resistance stacked above near 3.30–3.35.
The downside focus is now on the support zone at 2.85–2.90, which has provided reaction in recent sessions. A breakdown beneath this box could open further downside, while a successful defense could keep XRP ranging under the golden pocket.
Key levels to watch:
Resistance: 3.15–3.35 (Golden Pocket + Supply Zone)
Support: 2.85–2.90
Until one of these boundaries breaks, price remains locked in a range with Fib retracements providing the roadmap.

XRP New Higher Low and Break of Structure, LONG PlayThe 45min chart is powerful for Crypto, and is showing a new Higher Low.
Break of structure to the upside. (See "bos" horizontal lines).
An upward channel is present on 45min chart and 1h chart.
Bull Pennant Pattern is showing on my candle times, including 4h and daily. These usually break bullish.
On the 45min chart the 200ma has just crossed above the 314ma. In my methodology that's a bullish MA cross.
ADX/DI and Squeeze and Wadda indicators are favorable on the lower time frames including 4h's.
This is slightly high octane speculation, but mostly TA with a slight bit of front running and TIGHT stop loss.
Overall looks like the ALT market is green today for many pairs against USD and USDC on Coinbase. If nothing else today should offer a stop loss in the green while XRP makes a move.
Which of these alt coins do you think is the strongest?I constantly monitor how each altcoin is doing compared to Btc (and compared to other alts). It's easy to get "married" to an altcoin and ride or die that coin until the end. I have no favorite coin. My favorite horse in any race is the fastest one.

Xrp - I was wrongFor the first time in the last 50+ charts I was wrong about (initial) direction. I believed Xrp would hit my bullish (take profit) target 1st... then hit my beasrish T2 target. But the opposite occured. I like to keep stats on my calls and be transparent when I wrong. Errors can always be a learning opportunity.
The upshot is that my support and resistance were spot on (and profits were taken within less than 1% of my take profit target). TA works!
Published yesterday (Aug 25th):
May the trends be with you.
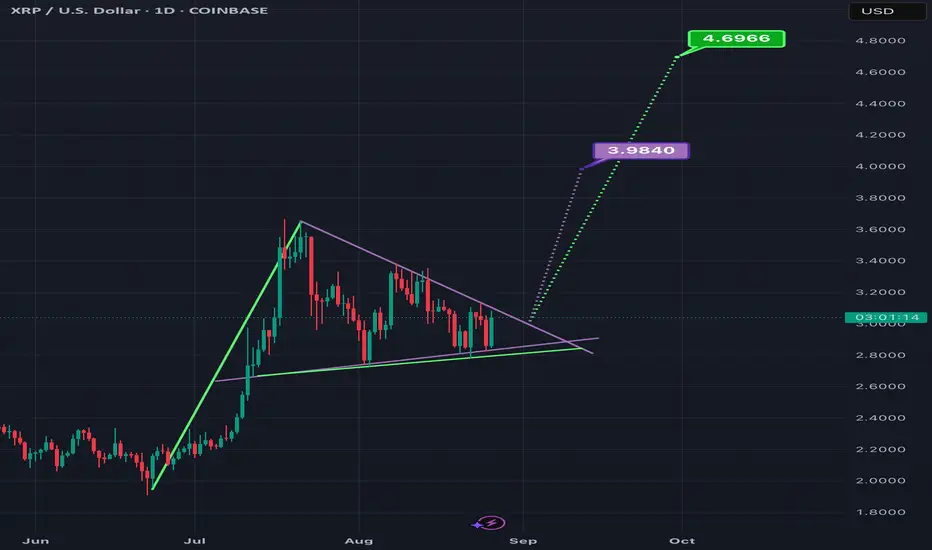
Symmetrical Triangle/ Bull Pennant on XRPUSD Nearing its ApexThe bottom trendline of this triangle definitely seems to have finally been narrowed down to this purple line and green line with multiple touch points to back that up. *not financial advice*

XRPUSDT📊 The BINANCE:XRPUSDT is correction-trend. I think the short-term downtrend has come to an end.
🟢 Best support: 2.8640$
🔴 Targets: 3.2060$ - 3.6020$
⚠️ Please control risk management.

XRP will break the resistance lineBINANCE:XRPUSDT on the 1D chart shows extended consolidation after a breakout from a larger triangle. The current sideways action near $3.48 indicates buyers are absorbing supply before the next move. A breakout above $3.48 could extend gains toward $3.80 and $4.00, with $3.20 acting as the key support level.

XRP Above Support · 5X Lev Trade-Numbers · Mid-Range (PP: 388%)XRP is trading above support. We can see EMA34 (green) being safe on the chart and not yet tested, a signal of strength. Our "support" range is also unmolested on the second drop. So far, support holds.
You know what we always say: "Sell at resistance, buy at support."
This looks like a good chart setup now but it can go wrong. You can have a good trade do bad, just like a bad decision can end up yielding good results. Our goal is to make the right decision all of the time and produce positive results more often than not.
At support, we have lower risk for a drop and higher chance for reversal. If we go deeper and look for other signals, we can wait for a stronger chart setup. Not all chart setups are the same.
Some trades have higher risk, others lower. Some trades move fast others slow. Some trades are a win; certainly, some other trades are a loss.
Our focus is not necessarily on winning once but on producing a positive outcome consistently. Can we achieve or goals? Can we reach success?
This chart setup is bullish but also a mix, prices have been dropping but again, we are looking at support.
Prices have been dropping since 18-July, more than a month. Why would a retrace go for longer? Is it necessary?
I don't know. XRP has been rising since November 2024 and is likely to resume going up. It will do so within hours or days. It will do so within weeks. You can decide to jump now or maybe later, there is no reward without risk.
Go ahead and take the plunge. We are ready for the bullish jump.
______
LONG XRPUSDT 5X (PP: 388%)
ENTRY: 2.73 - 2.95 (STOP: 2.65)
TARGETS: 3.08, 3.30, 3.46, 3.66, 4.02, 4.28, 4.59, 4.85, 5.17
______
You can notice some difference in the trade-numbers compared to previous posts. This is because we have different methods for extracting targets and it all depends on the goals and the timeframe. A daily chart setup will not give you the same targets as a weekly or monthly one.
Normally, I using the long-term targets for all ranges. These targets have been extracted with the mid-term range. But the move can cover a long space.
I am wishing you health, wealth, good luck, profits and success.
Namaste.

XRP BULLISH CONTINUATION ! XRP has been consolidated between the areas of $3.30 and $2.82. The SEC has finally concluded its appeal and settled on a fine on Ripples end. Immediately after, about 7 ETF’s were filed on behalf of XRP, as well as SWIFT announcing the introduction of XRP and HBAR in cross border payments. As mentioned in recent posts, XRP should be headed above the resistance at $3.31 and break towards $4, $5 and possibly above. I believe this will be a quick and solid crypto season, before a possible exhaustion in this next wave.
This is not financial advice.
Good luck! -R2C
