DeGRAM | XRPUSD held the $2.8 level📊 Technical Analysis
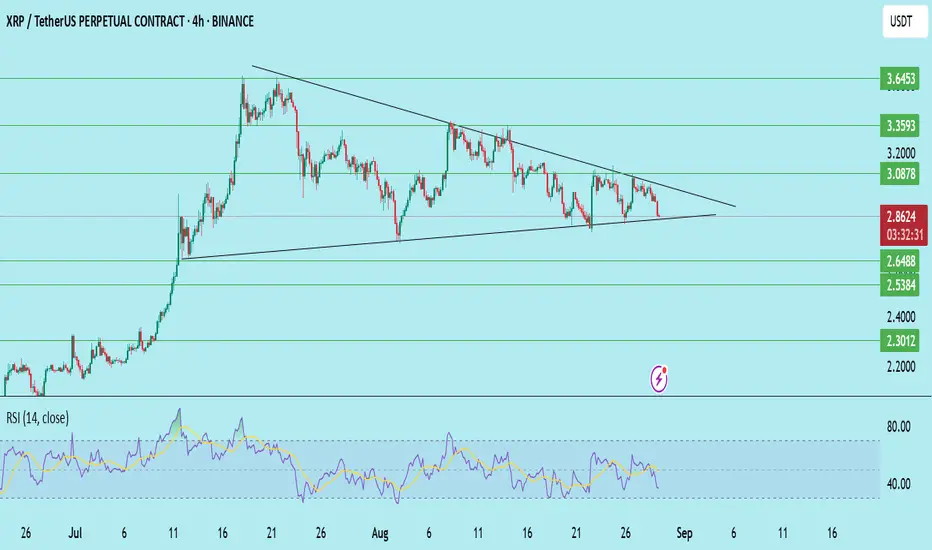
● XRP rebounded strongly from the 2.76 support line, rejecting the breakdown and signaling a bullish reversal.
● Structure shows a recovery setup within the ascending channel, with upside potential toward the 3.67 resistance zone.
💡 Fundamental Analysis
● Ripple benefits from sustained optimism in institutional adoption, while easing regulatory concerns support medium-term investor confidence.
✨ Summary
XRP defends 2.76 support, pointing to continuation higher with 3.67 as key resistance. Structure favors medium-term bullish momentum.
-------------------
Share your opinion in the comments and support the idea with a like. Thanks for your support!
Xrpusdsignal

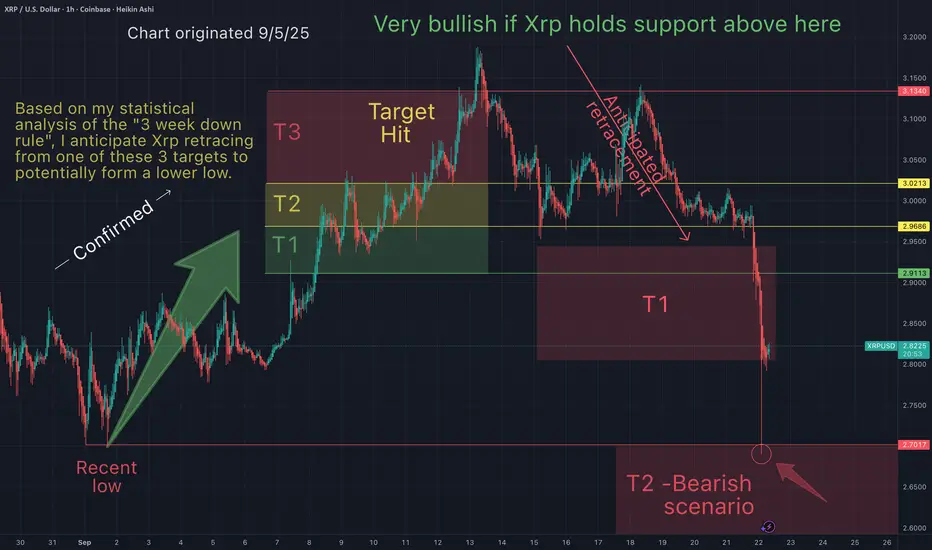
You will ask yourself, "how did he know Xrp would do that"?On Sept 5th I suggested that Xrp would bounce up to one of my 3 targets, then retrace to a lower low. This prediction was based on the "3 Red Week Down Rule". Things are going according to what I had expected.
Congratulations to everyone who have been making gains here based on what I have been outlining on my charts.
By applying historical data, statistical analysis and technical analysis, it becomes easier to forecast price action. The most important thing is to have a strategy and these strategies have made incredible gains here across the board.
May the trends be with you.
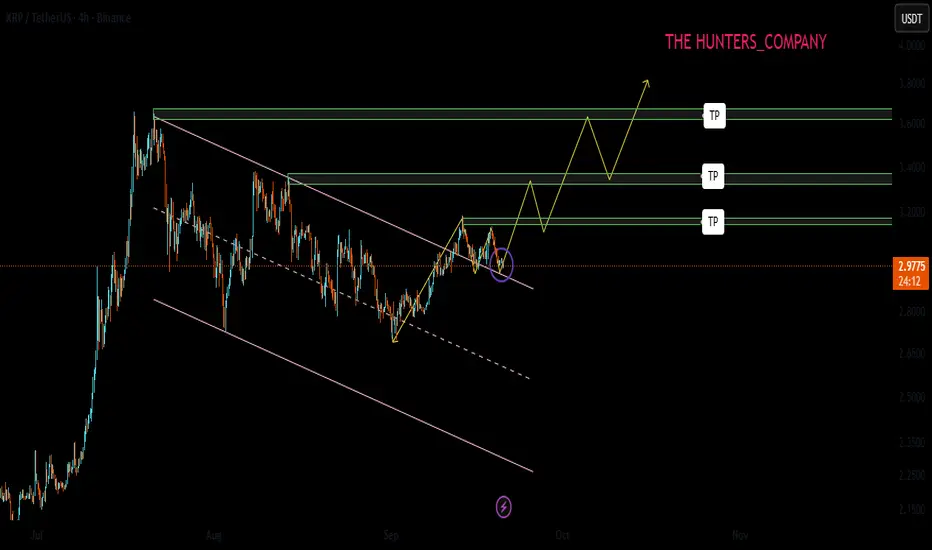
XRP; The double top pattern is fake!!!Hello friends
Regarding the price channel we had, after a long time this channel has been broken and now a double top pattern has formed which looks fake and wants to trap sellers.
If the price continues to move upwards, it can move to the specified areas.
If the formed pattern really wants to act and we have a price drop, the bottom of the channel and its midline are good supports.
*Trade safely with us*
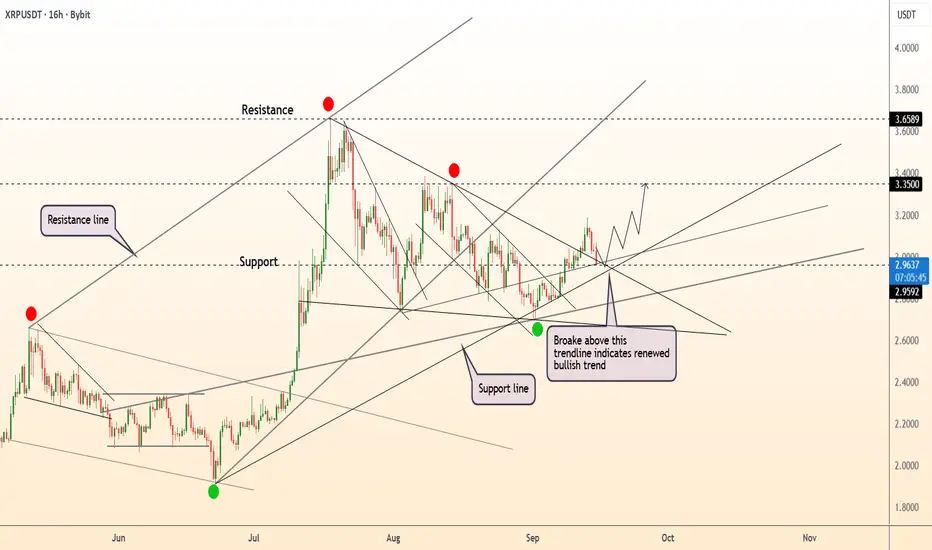
DeGRAM | XRPUSD is testing the support📊 Technical Analysis
● XRP/USD broke above the descending trendline, signaling renewed bullish structure and confirming support near 2.95.
● Price is coiling for continuation, with upside targets at 3.35 and potentially 3.65 if momentum extends.
💡 Fundamental Analysis
● Optimism for altcoins is supported by improved market liquidity and steady institutional inflows, while XRP’s active participation in cross-border payments continues to bolster adoption outlook.
✨ Summary
Bullish above 2.95; targets 3.35 → 3.65. Invalidation on a close below 2.95.
-------------------
Share your opinion in the comments and support the idea with a like. Thanks for your support!
DeGRAM | XRPUSD reached the support📊 Technical Analysis
● XRP/USD is stabilizing above 2.72 support, showing reversal signs with higher lows forming near the channel base.
● A breakout over 3.00–3.20 would confirm renewed bullish momentum, opening the way toward 3.53 resistance and potentially higher.
💡 Fundamental Analysis
● Positive sentiment is reinforced by growing institutional flows into altcoins, with XRP seeing increased derivatives activity and improved liquidity on major exchanges.
✨ Summary
Bullish above 2.72; targets 3.20 → 3.53. Invalidation on a close below 2.72.
-------------------
Share your opinion in the comments and support the idea with a like. Thanks for your support!

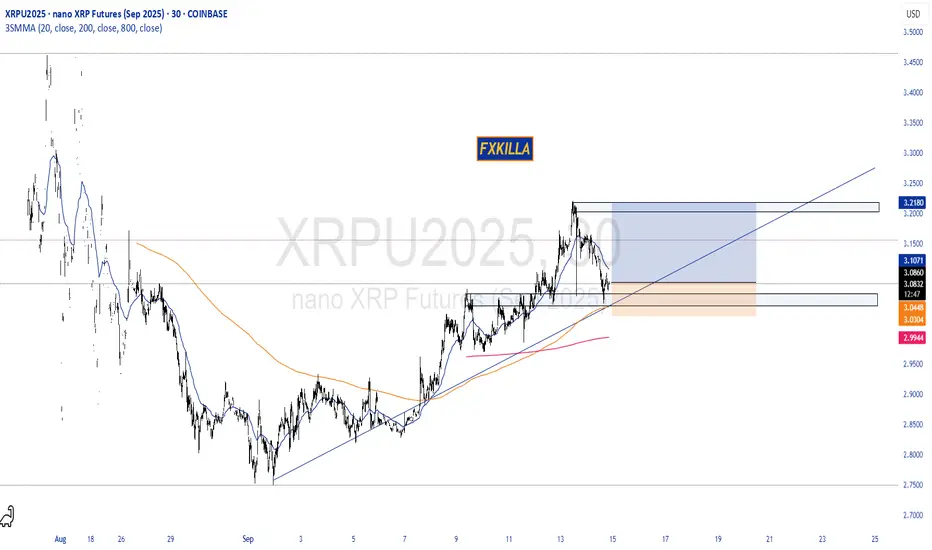
XRP HIGH PROBABILITY SETUP SOON!!!🚨 XRP HIGH PROBABILITY BUY SETUP 🚨
* Here We Can See Clearly The Next Potential Move For XRPUSD Coming Hours/Days.
* Keep Your Eyes Close On Your Trading Positions.
* Happy PIP Hunting Traders.
FXKILLA.
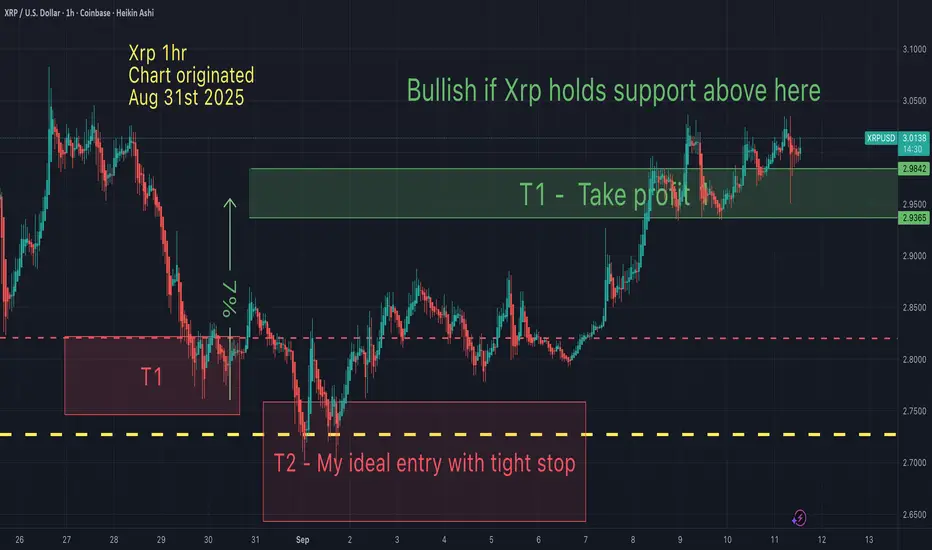
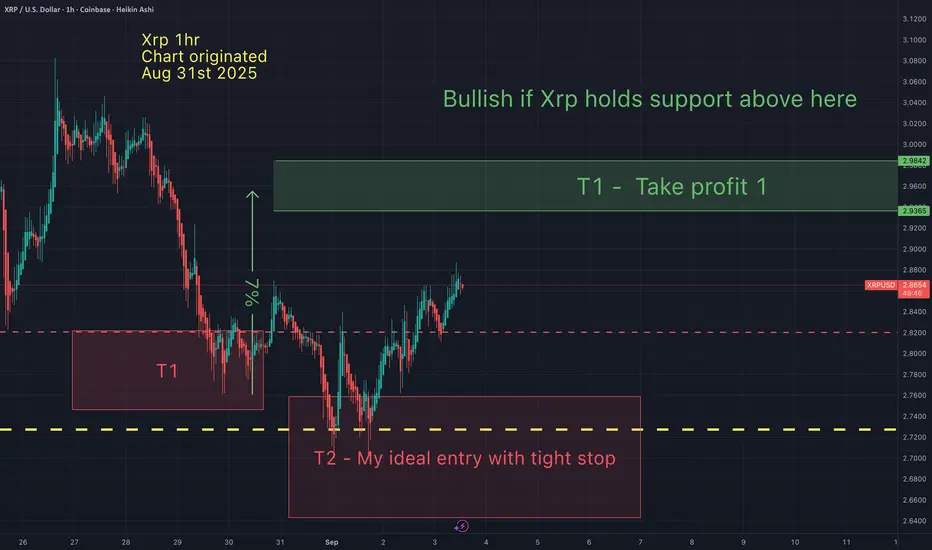
XRP - Take profit targets On Aug 31st I suggested that Xrp would drop lower (to T2) then bounce to my 1st take profit. That played out perfectly. Now the question remains, what next?
Taking some profits at this level is not a bad idea, although I do have 2 other targets slightly higher where I anticipate taking all profits. Until the 3 week down rule plays out, I continue to remain cautious.
I will post these 2 other targets in a chart to follow soon.
May the trends be with you.
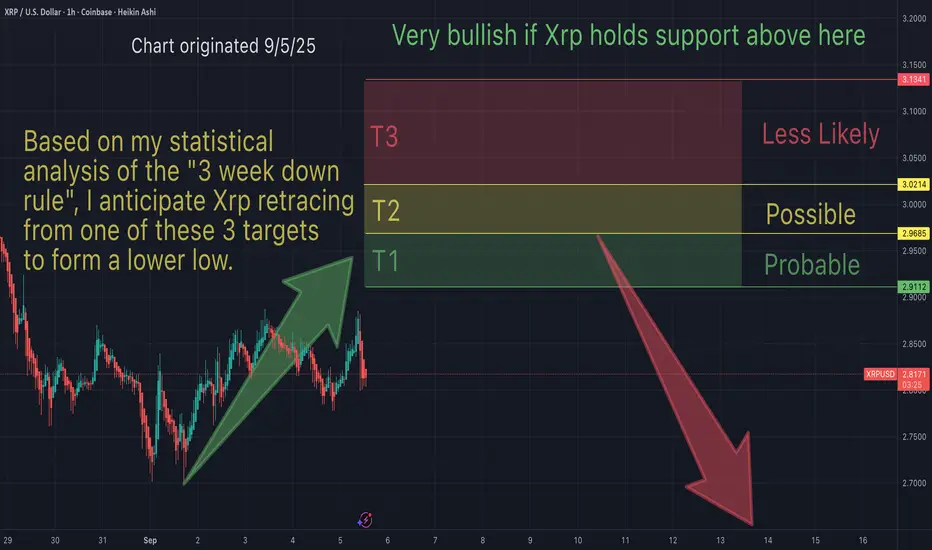
Xrp - support and resistance & take profit targetsBased on my statistical analysis of the "3 week down rule", I anticipate Xrp retracing from one of these 3 targets...to form a lower low.
I hope I'm wrong, but I'm just following the historical data and considering the statistical analysis. I can only follow the stats to anticipate price action.
This trade idea gets invalidated above T3. Although less probable, if Xrp breaks above T3 (and holds support), I become super bullish.
May the trends be with you.
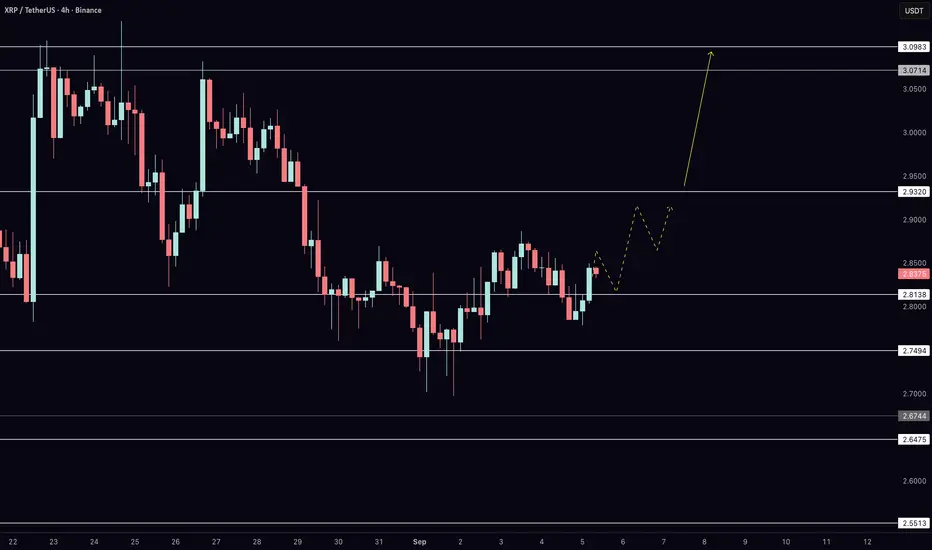
XRP Ready? NFP Volatility+Bitcoin Rally Could Drive XRP to $3.10In today’s XRP update, we analyze the 4-hour chart as price consolidates just under key resistance. After defending $2.75, buyers have managed to push XRP back toward $2.87 and $2.93. These are the levels that will decide whether momentum shifts in favor of the bulls. If $2.93 is reclaimed, the path opens toward $3.09 and possibly higher. On the downside, supports remain at $2.81 and $2.75, with deeper zones at $2.67 and $2.65 if selling pressure increases.
This update also comes on a major day for global markets, with the U.S. Non-Farm Payrolls release driving volatility across assets. Bitcoin has already shown bullish attempts on the 4-hour chart, which I covered in detail earlier today on the channel. The big question now is whether XRP can align with that strength by breaking its own resistance barriers.
XRP Price Update: Next Targets $2.93 and $3.19In today’s XRP update, we focus on the 4-hour chart where price is consolidating between $2.81 and $2.87. After defending the $2.75 level yesterday, XRP is trying to build a recovery structure. The big question now is whether buyers can reclaim $2.87 and push toward $2.93. A breakout there would open the path to $3.09, which is the key resistance on this timeframe.
On the downside, immediate support is at $2.81. If lost, pressure shifts back to $2.75, and below that the deeper buyer zones at $2.67 and $2.65 come into focus. My bias remains for upside, but confirmation comes only with resistance breakouts. Watch these levels closely as the short-term structure develops.

Xrp - My ideal entry target was hit. Now approaching take profitMy ideal entry at T2 was hit, as anticipated. Now approaching take profit 1.
I unfortunately don't expect this rally last long before a retrace (or possibly a reversal). I hope I'm wrong. Either way, I will soon be taking profits at the indicated targets.
May the trends be with you.
Bearish vibes on $XRPXRP’s decline from $2.48 has already begun, and the charts suggest continued downward pressure. Selling pressure has dominated recent price action, with rallies failing to gain traction. The market structure points to further weakness ahead, with lower price zones likely coming into play as the downtrend continues to unfold.

XRP Price Struggles Below $3 As Outflows Reach 9-Month HighAt the time of writing, BINANCE:XRPUSDT trades at $2.87, remaining stuck under the $2.95 resistance level. The altcoin has attempted to reclaim the $3.00 threshold for the past two weeks but has repeatedly failed to close above it, highlighting the weakness in bullish momentum.
The Chaikin Money Flow (CMF), a metric tracking capital inflows and outflows, has dropped to a nine-month low. This decline confirms that outflows are currently overwhelming inflows, a bearish sign for XRP's short-term outlook .
Given these conditions, BINANCE:XRPUSDT could face further declines. A drop toward $2.74 remains likely if selling pressure continues, with the asset consolidating above this zone.
If investor sentiment shifts, BINANCE:XRPUSDT could attempt recovery. Reclaiming $2.95 as support would provide momentum to test higher levels. A successful breakout above $3.07 and later $3.12 would invalidate the bearish thesis.

XRP/USDT – Breakdown & RetestCRYPTOCAP:XRP recently broke below its key trendline and has now retested the level, showing rejection — a strong bearish continuation signal.
Structure
Breakdown of the ascending trendline
Retest rejection confirms selling pressure
Supports stacked below at key levels
Trade Plan
Entry: After rejection near the trendline retest
Stop Loss: Above broken trendline
Targets: 0.3540 → 0.3422 → 0.3310 → 0.3240
Bias
Bearish unless XRP reclaims the trendline with a strong close. If reclaimed, the short setup is invalid.
Trading Insight
This is a classic breakdown + retest setup, often signaling continuation to lower support zones. Manage risk with SL.
DYOR | Not Financial Advice
Which of these alt coins do you think is the strongest?I constantly monitor how each altcoin is doing compared to Btc (and compared to other alts). It's easy to get "married" to an altcoin and ride or die that coin until the end. I have no favorite coin. My favorite horse in any race is the fastest one.

Xrp - I was wrongFor the first time in the last 50+ charts I was wrong about (initial) direction. I believed Xrp would hit my bullish (take profit) target 1st... then hit my beasrish T2 target. But the opposite occured. I like to keep stats on my calls and be transparent when I wrong. Errors can always be a learning opportunity.
The upshot is that my support and resistance were spot on (and profits were taken within less than 1% of my take profit target). TA works!
Published yesterday (Aug 25th):
May the trends be with you.
XRPUSDT📊 The BINANCE:XRPUSDT is correction-trend. I think the short-term downtrend has come to an end.
🟢 Best support: 2.8640$
🔴 Targets: 3.2060$ - 3.6020$
⚠️ Please control risk management.

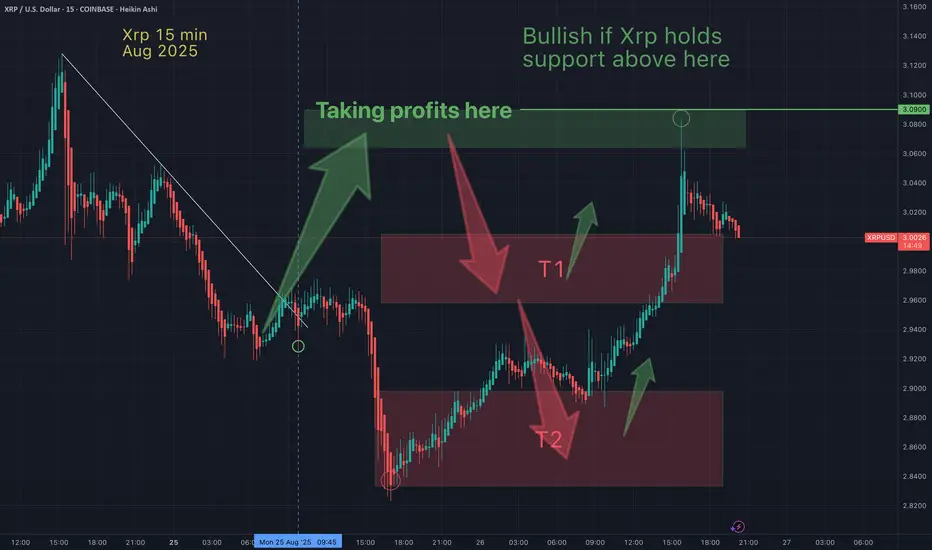
Did Xrp just print a local bottom? My take profit targets...Xrp just put in a local low at $2.9 today and going in heavy on the retrace (off that low) was a good idea. I expect my Bullish T1- take profit zone, to be hit relatively soon. I then anticipate a retrace to my bearish targets. My ideal target will be in my red T2 box. I remain cautiously bullish after Xrp spends some time developing this bottoming range. Lower lows are welcome as the provide excellent re-entry points for me.
May the trends be with you.

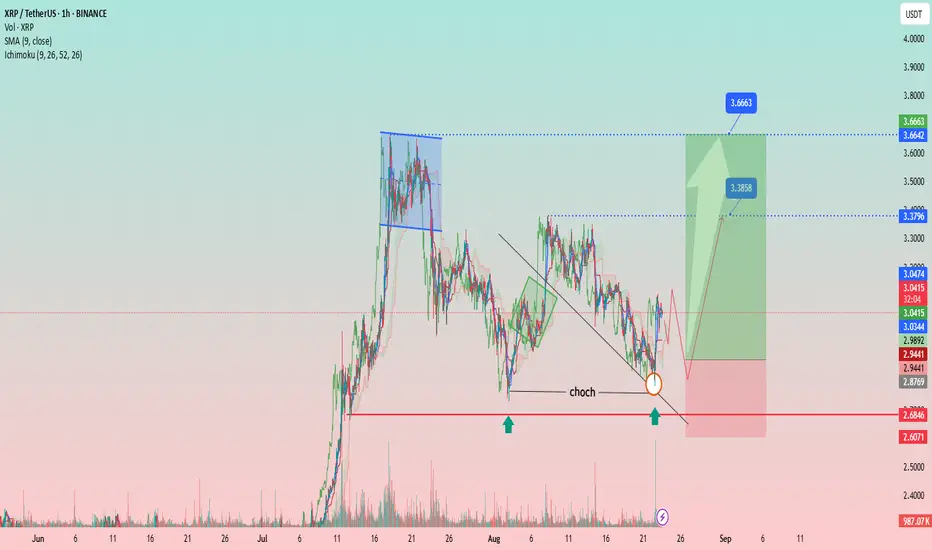
XRP/USDT – Bullish Reversal Setup After CHoCH BreakoutAnalysis:
The chart shows XRP/USDT (1H timeframe) developing a bullish structure after a Change of Character (CHoCH) confirmation near the $2.94 support zone. Price respected the key demand area (highlighted by green arrows) and broke above the descending trendline, signaling potential reversal momentum.
Support Zone: $2.94 – $2.87 (strong demand zone, price reacted twice).
Resistance Levels:
First target: $3.38
Second target: $3.66
Indicators:
SMA (9) at $3.04 – price hovering around it, suggesting early bullish strength.
Ichimoku showing potential cloud breakout aligning with bullish momentum.
Volume: Increasing at demand, indicating strong buyer interest.
Trade Plan:
Entry Zone: Around $3.00 – $3.05 (after retest confirmation).
Stop-Loss: Below $2.86 (invalidates setup if broken).
Targets:
TP1: $3.38
TP2: $3.66
Risk/Reward: Favorable, with potential 2:1 or higher depending on entry execution.
👉 This setup suggests that XRP may attempt a bullish continuation if support holds and volume sustains the breakout momentum.
XRP LONG SETUP INTRADAY ( 17 AUG 2025 )Entry Details:
Entry: 3.1137 $ - 3.1400 $
Target Price: 3.2186 $
Stop loss: 3.0758 $
BINANCE:XRPUSDT BINANCE:XRPUSDT.P BYBIT:XRPUSDT.P
Trade Ideas:
Idea is clearly shown on chart + we have some secret psychologies and tools behind this.

Xrp - It all comes down to this!🚀Xrp ( CRYPTO:XRPUSD ) has to break structure:
🔎Analysis summary:
After Xrp created the previous all time high in 2018, we have been seeing a consolidation ever since. With the recent all time high retest however, Xrp is clearly showing some considerable strength. It all comes down to bulls being able to push price higher, above the massive horizontal structure.
📝Levels to watch:
$3.0
SwingTraderPhil
SwingTrading.Simplified. | Investing.Simplified. | #LONGTERMVISION

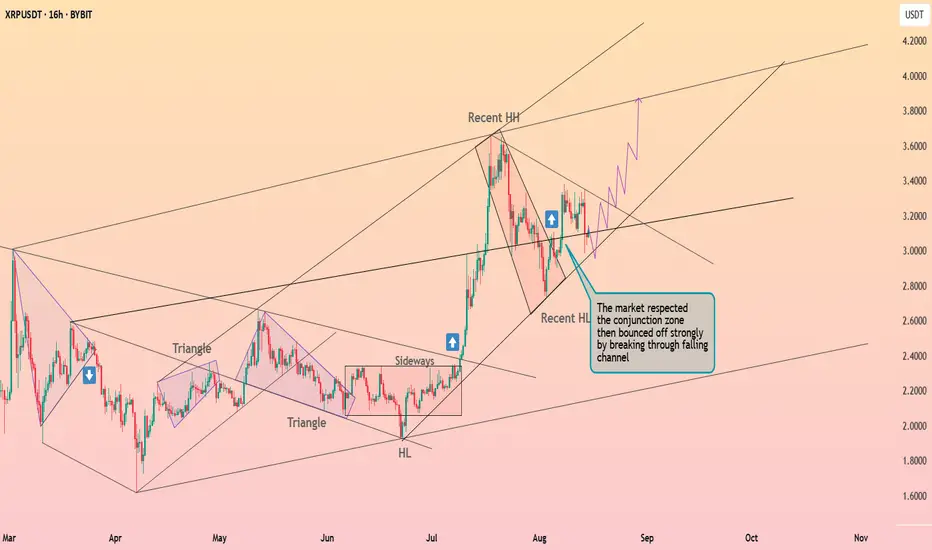
XRP is preparing for a sharp surge ┆ HolderStatBYBIT:XRPUSDT broke out of a falling channel, bouncing off the conjunction zone and maintaining a higher low structure. Bulls are targeting the $3.80 level while defending $3.20 support.
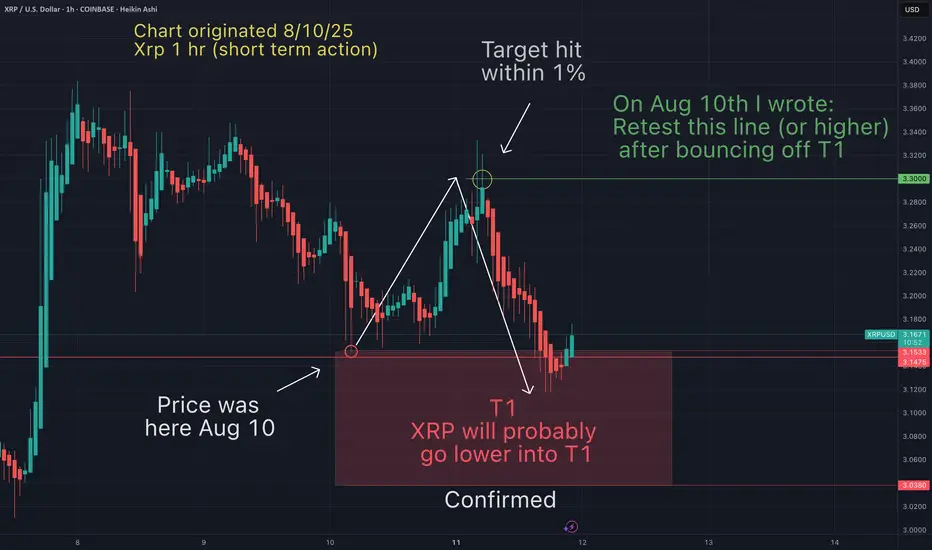
You will ask yourself "how did he know Xrp would do that"?On Aug 10th I suggested the following (see Aug 10th chart below to confirm):
1-My T1 (red box) had been hit, and expecting a bounce (confirmed)
2-Xrp would bounce up to hit $3.3 (confirmed within 1%)
3- After hitting $3.3, "Xrp will probably go lower into T1 (confirmed as of today)
4-Suggested this price action would complete within 1-3 days (confirmed)
Strangely accurate again. These patterns just keep repeating over and over. I can teach you how to identify them (currently accepting 2 new private students).
This chart illustrates that TA works in the short term as well (24hr period)). These principles can applied on ANY timeframe on ANY asset.
Once again I keep stats on my accuracy, and I would do the same for anyone I would follow. How else would I know if they are worth following.
May the trends be with you.