Market Analysis: WTI Crude Searches for SupportMarket Analysis: WTI Crude Searches for Support
Crude oil is recovering and might rise toward $61.20.
Important Takeaways for WTI Crude Oil Price Analysis Today
- WTI Crude oil is recovering losses and trading above $59.00.
- There is a rising channel forming with support at $59.40 on the hourly chart of XTI/USD.
WTI Crude Oil Price Technical Analysis
On the hourly chart of WTI Crude Oil, the price found support near $58.50 against the US Dollar. The price formed a base and started a recovery wave above $59.00 and the 50-hour simple moving average.
The bulls were able to push the price to the 50% Fib retracement level of the downward move from the $62.17 swing high to the $58.53 swing low. Besides, there is a rising channel forming with support at $59.40.
The hourly RSI is above the 80 level, and the price is currently consolidating below the $60.30 barrier. The next hurdle could be $60.80 and the 61.8% Fib retracement.
A clear move above $60.80 could send the price toward $61.20. Any more gains might open the doors for a test of $62.200. Conversely, the price might start a fresh decline from $60.35 or $60.80. Immediate support sits near $59.40 or the 50-hour simple moving average.
The key breakdown zone on the WTI crude oil chart might be $58.50. If there is a downside break, the price might decline toward $58.00. Any more losses might encourage the bears for a push toward $56.50.
This article represents the opinion of the Companies operating under the FXOpen brand only. It is not to be construed as an offer, solicitation, or recommendation with respect to products and services provided by the Companies operating under the FXOpen brand, nor is it to be considered financial advice.
Xtiusd

Bullish bounce off key support?WTI Oil (XTI/USD) has bounced off the pivot, which is an overlap support, and could potentially rise to the 1st resistance.
Pivot: 58.68
1st Support: 60.77
1st Resistance: 60.77
Disclaimer:
The opinions given above constitute general market commentary and do not constitute the opinion or advice of IC Markets or any form of personal or investment advice.
Any opinions, news, research, analyses, prices, other information, or links to third-party sites contained on this website are provided on an "as-is" basis, are intended to be informative only, and are not advice, a recommendation, research, a record of our trading prices, an offer of, or solicitation for, a transaction in any financial instrument and thus should not be treated as such. The information provided does not involve any specific investment objectives, financial situation, or needs of any specific person who may receive it. Please be aware that past performance is not a reliable indicator of future performance and/or results. Past performance or forward-looking scenarios based upon the reasonable beliefs of the third-party provider are not a guarantee of future performance. Actual results may differ materially from those anticipated in forward-looking or past performance statements. IC Markets makes no representation or warranty and assumes no liability as to the accuracy or completeness of the information provided, nor any loss arising from any investment based on a recommendation, forecast, or any information supplied by any third party

Bullish bounce off pullback support?WTI Oil (XTI/USD) is falling towards the pivot, which has been identified as a pullback support and could bounce to the 1st reistance.
Pivot: 58.58
1st Support: 56.35
1st Resistance: 62.26
Disclaimer:
The opinions given above constitute general market commentary and do not constitute the opinion or advice of IC Markets or any form of personal or investment advice.
Any opinions, news, research, analyses, prices, other information, or links to third-party sites contained on this website are provided on an "as-is" basis, are intended to be informative only, and are not advice, a recommendation, research, a record of our trading prices, an offer of, or solicitation for, a transaction in any financial instrument and thus should not be treated as such. The information provided does not involve any specific investment objectives, financial situation, or needs of any specific person who may receive it. Please be aware that past performance is not a reliable indicator of future performance and/or results. Past performance or forward-looking scenarios based upon the reasonable beliefs of the third-party provider are not a guarantee of future performance. Actual results may differ materially from those anticipated in forward-looking or past performance statements. IC Markets makes no representation or warranty and assumes no liability as to the accuracy or completeness of the information provided, nor any loss arising from any investment based on a recommendation, forecast, or any information supplied by any third party

Bullish bounce off overlap support?WTI Oil (XTI/USD) is falling towards the pivot, which has been identified as an overlap support and could bounce to the 1st resistance.
Pivot: 58.68
1st Support: 57.47
1st Resistance: 60.77
Disclaimer:
The opinions given above constitute general market commentary and do not constitute the opinion or advice of IC Markets or any form of personal or investment advice.
Any opinions, news, research, analyses, prices, other information, or links to third-party sites contained on this website are provided on an "as-is" basis, are intended to be informative only, and are not advice, a recommendation, research, a record of our trading prices, an offer of, or solicitation for, a transaction in any financial instrument and thus should not be treated as such. The information provided does not involve any specific investment objectives, financial situation, or needs of any specific person who may receive it. Please be aware that past performance is not a reliable indicator of future performance and/or results. Past performance or forward-looking scenarios based upon the reasonable beliefs of the third-party provider are not a guarantee of future performance. Actual results may differ materially from those anticipated in forward-looking or past performance statements. IC Markets makes no representation or warranty and assumes no liability as to the accuracy or completeness of the information provided, nor any loss arising from any investment based on a recommendation, forecast, or any information supplied by any third party

WTI Oil Price Rises Above $60WTI Oil Price Rises Above $60
As the XTI/USD chart shows, the price of a barrel climbed above $60 this week, reaching a one-month high.
The main bullish driver has been large-scale anti-government protests in Iran, which could lead to a change of power and/or military action. Trump has voiced support for the protesters and threatened 25% tariffs on all countries trading with Iran. Market participants fear that Iranian oil supplies (around 1.5–2 mb/d) could simply disappear, or that the Strait of Hormuz could be closed.
Technical Analysis of the XTI/USD Chart
On 5 January, we:
→ used WTI price fluctuations to draw a descending channel (shown in red);
→ highlighted the long lower wicks formed when the price touched the lower boundary of the channel as evidence of strong demand (and a bear trap);
→ outlined a scenario involving a bullish impulse.
Indeed, since then the oil price has moved higher, with:
→ the upper boundary of the descending channel being broken, while the breakout level (around $58.35) subsequently acting as support (shown by the arrow);
→ fresh data providing grounds for plotting an upward trajectory.
After an attempted rise yesterday, downward momentum can be observed this morning (shown by the arrow). Given the rapid pace of WTI’s advance (around 2.7% since the start of the week), it is technically reasonable to assume that the market is vulnerable to a correction. The situation suggests that bulls may lack the strength to keep the price above the psychological $60 level. The market may also be sceptical that Trump will allow oil to remain this expensive (the President has said he wants a $53 barrel).
However, if geopolitical tensions in Iran (and other regions) intensify further, this could drive WTI prices even higher.
This article represents the opinion of the Companies operating under the FXOpen brand only. It is not to be construed as an offer, solicitation, or recommendation with respect to products and services provided by the Companies operating under the FXOpen brand, nor is it to be considered financial advice.

Bullish momentum to extend?WTI Oil (XTI/USD) could make a short-term pullback to the pivot, which acts as an overlap support and could bounce to hr 1st resistance.
Pivot: 58.70
1st Support: 56.94
1st Resistance: 61.58
Disclaimer:
The opinions given above constitute general market commentary and do not constitute the opinion or advice of IC Markets or any form of personal or investment advice.
Any opinions, news, research, analyses, prices, other information, or links to third-party sites contained on this website are provided on an "as-is" basis, are intended to be informative only, and are not advice, a recommendation, research, a record of our trading prices, an offer of, or solicitation for, a transaction in any financial instrument and thus should not be treated as such. The information provided does not involve any specific investment objectives, financial situation, or needs of any specific person who may receive it. Please be aware that past performance is not a reliable indicator of future performance and/or results. Past performance or forward-looking scenarios based upon the reasonable beliefs of the third-party provider are not a guarantee of future performance. Actual results may differ materially from those anticipated in forward-looking or past performance statements. IC Markets makes no representation or warranty and assumes no liability as to the accuracy or completeness of the information provided, nor any loss arising from any investment based on a recommendation, forecast, or any information supplied by any third party

Potential bullish reversal?WTI Oil (XTI/USD) could make a short-term pullback to the pivot and bounce to the 1st resistance, which has been identified as an overlap resistance.
Pivot: 58.10
1st Support: 55.13
1st Resistance: 62.14
Disclaimer:
The opinions given above constitute general market commentary and do not constitute the opinion or advice of IC Markets or any form of personal or investment advice.
Any opinions, news, research, analyses, prices, other information, or links to third-party sites contained on this website are provided on an "as-is" basis, are intended to be informative only, and are not advice, a recommendation, research, a record of our trading prices, an offer of, or solicitation for, a transaction in any financial instrument and thus should not be treated as such. The information provided does not involve any specific investment objectives, financial situation, or needs of any specific person who may receive it. Please be aware that past performance is not a reliable indicator of future performance and/or results. Past performance or forward-looking scenarios based upon the reasonable beliefs of the third-party provider are not a guarantee of future performance. Actual results may differ materially from those anticipated in forward-looking or past performance statements. IC Markets makes no representation or warranty and assumes no liability as to the accuracy or completeness of the information provided, nor any loss arising from any investment based on a recommendation, forecast, or any information supplied by any third party

XTIUSD is trading in a bearish channel on the 8H timeframeXTIUSD is trading in a bearish channel on the 8H timeframe, with key support highlighted near 51.40 and resistance around 58.95. The structure favours a sell-on-rise approach as long as price stays below the upper channel and the breakdown zone near 56.90–58.00.
1. Timeframe and Context
• Timeframe used: 8H chart for medium term swing structure.
• Instrument: XTIUSD (WTI crude oil spot vs USD), currently trading in the mid 50s after a sustained decline.
2. Trend Structure
• Price is moving inside a well defined descending channel with lower highs and lower lows, confirming a dominant downtrend.
• The recent bounce attempts have been capped near the upper channel line, reinforcing sellers’ control over this.
3. Key Levels
• Immediate resistance zone: 56.90–58.95, where previous highs, breakdown area, and channel resistance cluster together.
• Major support: 51.40, marked on the chart as a potential demand zone and projected downside target within the channel.
4. Volume Profile and Sentiment
• Volume profile for the current 8H range shows Point of Control (POC) around 56.43, with higher sell volume than buy volume, indicating distribution at higher prices.
• The custom panel signals bearish sentiment, with negative delta and a “SELL” bias, supporting continuation of the downside leg rather than a strong reversal.
5. Momentum Indicators
• RSI on the 8H chart is below the midline and sloping down, confirming weakening momentum and supporting the bearish bias.
• Any short term RSI bounce towards 50–60 while price remains under resistance can be treated as a pullback within the larger downtrend.
6. Price Path Projection
• Base case: Price may attempt a minor bounce from current levels toward the breakdown zone near 56.50–57.00, then face renewed selling pressure.
• If sellers defend this zone, the next leg down towards 55.00 and then 51.40 support becomes likely, in line with the projected yellow path on the chart.
7. Trading Plan Idea (8H)
• Bias: Sell on rally within the 8H descending channel as long as price trades below 58.95 resistance. Aggressive bears can look for short setups near the breakdown/POC zone (around 56.5–58.0) with downside targets at 55.00 and 51.40 support, while conservative traders may wait for a clean 8H close below recent lows before entering.
aiTrendview Global Disclaimer
This aiTrendview report is an AI-generated document provided exclusively for educational and training purposes and shall not be construed as investment, financial, legal, or tax advice in any jurisdiction.
aiTrendview and its affiliates are not SEBI-registered research analysts, investment advisers, or portfolio managers, and all information herein is automatically compiled from publicly available sources that may contain errors, delays, or omissions.
Users must independently verify all data before making any financial, commercial, or legal decisions, as no market values, performance figures, or trends contained in this report constitute guarantees or forward-looking statements.
Nothing in this publication should be interpreted as a solicitation, recommendation, or endorsement to buy, sell, or hold any security.
aiTrendview, its creators, and all associated AI systems disclaim all liability for losses or consequences arising from the use or reliance upon this content, and users accept full personal responsibility for all actions taken based on it.
Unauthorized reproduction, distribution, or modification of this AI-generated material is strictly prohibited under international copyright, compliance, and intellectual-property laws.

Falling towards 38.2% Fib support?WTI Oil (XTI/USD) is falling towards the pivot, which is a pullback support that aligns with the 38.2% Fibonacci retracement and could bounce to the 1st resistance.
Pivot: 57.65
1st Support: 57.15
1st Resistance: 58.55
Disclaimer:
The opinions given above constitute general market commentary and do not constitute the opinion or advice of IC Markets or any form of personal or investment advice.
Any opinions, news, research, analyses, prices, other information, or links to third-party sites contained on this website are provided on an "as-is" basis, are intended to be informative only, and are not advice, a recommendation, research, a record of our trading prices, an offer of, or solicitation for, a transaction in any financial instrument and thus should not be treated as such. The information provided does not involve any specific investment objectives, financial situation, or needs of any specific person who may receive it. Please be aware that past performance is not a reliable indicator of future performance and/or results. Past performance or forward-looking scenarios based upon the reasonable beliefs of the third-party provider are not a guarantee of future performance. Actual results may differ materially from those anticipated in forward-looking or past performance statements. IC Markets makes no representation or warranty and assumes no liability as to the accuracy or completeness of the information provided, nor any loss arising from any investment based on a recommendation, forecast, or any information supplied by any third party

XTI/USD Chart Analysis: Oil Price Volatility on the RiseXTI/USD Chart Analysis: Oil Price Volatility on the Rise
Events in Venezuela over the weekend have led to a sharp increase in oil price volatility following the market open. As the chart shows, during the European session the ATR indicator rose to levels last seen before the start of the Christmas period.
It is possible that the opening of US trading could further increase price swings, with the trend potentially developing in either direction:
- Bearish scenario: if American companies gain access to Venezuela’s oil reserves (both in the ground and in storage facilities), this could lead to an increase in supply on the global market.
- Bullish scenario: risks include reactions from China, OPEC+, as well as the possibility of a guerrilla warfare scenario and other difficult-to-predict developments.
At present, WTI crude oil price is holding near the median of the descending channel (highlighted in red). Note the long lower wicks forming when the price touches the lower boundary of the channel, indicating a sharp activation of demand whenever the price falls below the 26 December low of around $56.60 per barrel.
This behaviour resembles a bear trap and could trigger a bullish impulse, potentially testing the upper boundary of the channel.
This article represents the opinion of the Companies operating under the FXOpen brand only. It is not to be construed as an offer, solicitation, or recommendation with respect to products and services provided by the Companies operating under the FXOpen brand, nor is it to be considered financial advice.

Oil Traders Watch This Breakdown Level Carefully🔻 XTI/USD (WTI / USOIL) — Bearish Breakout Trade Blueprint
Energies Market | Day / Swing Trade Opportunity
📌 Asset Overview
XTI/USD – WTI Crude Oil vs U.S. Dollar
Market Type: Energy Commodity (CFD / Futures correlated)
Trading Style: Day Trade / Swing Trade
🧭 Trade Plan
🔴 Primary Bias: BEARISH BREAKOUT CONTINUATION
Price has completed a structure breakdown, confirming seller dominance after failed bullish recovery. Momentum favors downside continuation as liquidity shifts below key levels.
🎯 Entry Strategy
📍 Sell AFTER confirmed breakout below → 56.80
• You may enter at any price level after breakout confirmation
• Aggressive traders: enter on breakdown momentum
• Conservative traders: wait for a pullback retest below 56.80
Execution depends on your risk model & position sizing.
🛑 Stop Loss (Risk Control)
🚨 Protective SL: 58.00
⚠️ This is a reference level, not a mandatory rule.
Adjust your stop placement based on:
Timeframe
Volatility
Account risk parameters
🎯 Profit Objective
🎯 Primary TP Zone: 55.80
Why this zone matters:
• Strong historical support
• Oversold reaction area
• High probability of short-covering
• Correction + liquidity trap zone
⚠️ Partial profits are advised as price approaches this region.
🔎 Key Technical Drivers
✔️ Breakdown below key structure
✔️ Lower highs + lower lows
✔️ Momentum shift favoring sellers
✔️ Failed bullish continuation
✔️ Liquidity sweep completed above range
🌍 Related Markets to Watch (Correlation Map)
💵 USD-Linked Instruments
DXY (U.S. Dollar Index) → Strong USD often pressures oil prices
USD/CAD → Inverse correlation (CAD = oil-linked currency)
📉 Risk & Macro Assets
US10Y Treasury Yields → Rising yields = pressure on commodities
S&P 500 / US Indices → Risk-off sentiment weighs on energy demand
🛢️ Energy Complex
Brent Crude (UKOIL) → Confirms directional bias
Energy Sector Stocks → Weakness confirms oil downside momentum
📰 Fundamental & Economic Factors Supporting This Trade
⚖️ Macro Environment
• Demand concerns from global growth slowdown
• Stronger USD reducing commodity attractiveness
• Tight financial conditions limiting speculative inflows
🛢️ Oil-Specific Factors
• Inventory sensitivity remains elevated
• Market reacts sharply to supply-demand imbalance
• Volatility increases near key economic releases
📅 Upcoming Market Sensitivities
• U.S. inflation data
• Federal Reserve policy expectations
• Energy inventory updates
• Global growth & demand outlook commentary
Expect volatility spikes around high-impact macro releases.
⚠️ Risk Disclaimer
This analysis is not financial advice.
Stop loss and take profit levels are guidelines only.
Every trader must manage risk according to their own strategy.
👍 If this analysis adds value
• Drop a LIKE 👍
• Share your view in comments 💬
• Follow for consistent energy market breakdowns 📈

WTI Energy Markets: Are Buyers Still in Control?🛢️ WTI / USOIL — Bullish Energy Momentum Play
Energies • Commodities CFD • Day / Swing Trade
📌 Market Bias
🟢 Bullish Plan Active
WTI crude oil is trading with strong upside momentum, supported by trend structure and energy-sector flows. Buyers continue to defend dips while price respects bullish continuation behavior.
🎯 Trade Plan
Entry:
✅ Flexible entry allowed — you may enter at any price level, depending on your execution model and risk profile.
Stop Loss:
⛔ Reference SL: 56.000
⚠️ Risk disclaimer: Adjust your stop-loss based on your strategy, position sizing, and account risk rules.
Take Profit Zone:
🚨 Primary Objective: 60.000
📉 The moving average zone acts as a “police force” resistance — expect:
Overbought conditions
Liquidity traps
Potential corrective reactions
💡 Protect profits aggressively near resistance.
🧠 Technical Logic (Why This Works)
✔️ Bullish trend structure intact
✔️ Higher-low defense suggests dip buyers are active
✔️ Moving average acting as dynamic resistance → profit-booking zone
✔️ Momentum favors continuation until supply absorbs demand
🔗 Related Markets to Watch (Correlation Guide)
💵 USD-Based Pairs
DXY (U.S. Dollar Index) → Inverse correlation
📉 Weaker USD often supports higher oil prices.
USD/CAD → Strong negative correlation
🛢️ Rising oil typically strengthens CAD.
🛢️ Energy Instruments
BRENT Crude → Directional confirmation
XLE (Energy Sector ETF) → Institutional energy flow tracker
Natural Gas (XNG/USD) → Sentiment cross-check (not direct correlation)
📈 Risk Sentiment
US30 / S&P500 → Risk-on flows support commodity demand
Bond Yields → Rising yields can cap aggressive oil rallies
🌍 Fundamental & Economic Factors to Monitor
📊 (Current & upcoming macro drivers)
🛢️ OPEC+ supply guidance (production discipline impacts price stability)
🏭 U.S. crude inventory data (supply-demand imbalance signals)
🌍 Global growth outlook (energy consumption expectations)
🚢 Geopolitical supply risks (shipping routes & production regions)
💵 U.S. Dollar strength (pricing pressure on commodities)
🏦 Central bank policy tone (risk appetite & inflation hedging)
📌 These factors can accelerate or cap bullish momentum, especially near resistance zones.
⚠️ Risk Note
This idea provides market structure and directional context only.
You control:
Position size
Risk exposure
Entry & exit execution
Trade responsibly and manage capital professionally.
💬 If this setup adds value, hit 👍 and ⭐ to support quality analysis.
📌 Follow for more structured energy & macro-driven trade ideas.

Potential bearish drop?WTI Oil (XTI/USD) is reacting off the pivot and could drop to the 1st support.
Pivot: 58.10
1st Support: 53.34
1st Resistance: 62.14
Disclaimer:
The opinions given above constitute general market commentary and do not constitute the opinion or advice of IC Markets or any form of personal or investment advice.
Any opinions, news, research, analyses, prices, other information, or links to third-party sites contained on this website are provided on an "as-is" basis, are intended to be informative only, and are not advice, a recommendation, research, a record of our trading prices, an offer of, or solicitation for, a transaction in any financial instrument and thus should not be treated as such. The information provided does not involve any specific investment objectives, financial situation, or needs of any specific person who may receive it. Please be aware that past performance is not a reliable indicator of future performance and/or results. Past performance or forward-looking scenarios based upon the reasonable beliefs of the third-party provider are not a guarantee of future performance. Actual results may differ materially from those anticipated in forward-looking or past performance statements. IC Markets makes no representation or warranty and assumes no liability as to the accuracy or completeness of the information provided, nor any loss arising from any investment based on a recommendation, forecast, or any information supplied by any third party

Potential bearish reversal?WTI Oil (XTI/USD) is rising towards the pivot, which has been identified as an overlap resistance and could reverse to the 1st support, which acts as a pullback support.
Pivot: 58.92
1st Support: 57.32
1st Resistance: 60.27
Disclaimer:
The opinions given above constitute general market commentary and do not constitute the opinion or advice of IC Markets or any form of personal or investment advice.
Any opinions, news, research, analyses, prices, other information, or links to third-party sites contained on this website are provided on an "as-is" basis, are intended to be informative only, and are not advice, a recommendation, research, a record of our trading prices, an offer of, or solicitation for, a transaction in any financial instrument and thus should not be treated as such. The information provided does not involve any specific investment objectives, financial situation, or needs of any specific person who may receive it. Please be aware that past performance is not a reliable indicator of future performance and/or results. Past performance or forward-looking scenarios based upon the reasonable beliefs of the third-party provider are not a guarantee of future performance. Actual results may differ materially from those anticipated in forward-looking or past performance statements. IC Markets makes no representation or warranty and assumes no liability as to the accuracy or completeness of the information provided, nor any loss arising from any investment based on a recommendation, forecast, or any information supplied by any third party

Market Analysis: WTI Crude Seeks ReboundMarket Analysis: WTI Crude Seeks Rebound
Crude oil is recovering and might rise toward the $58.50 resistance zone.
Important Takeaways for WTI Crude Oil Price Analysis Today
- WTI Crude oil is recovering losses and trading above $56.20.
- There was a break above a major bearish trend line with resistance at $56.00 on the hourly chart of XTI/USD.
WTI Crude Oil Price Technical Analysis
On the hourly chart of WTI Crude Oil, the price found support near $54.85 against the US Dollar. The price formed a base and started a recovery wave above $55.50 and the 50-hour simple moving average.
The bulls were able to push the price above the 23.6% Fib retracement level of the downward move from the $58.80 swing high to the $54.84 swing low. Besides, there was a break above a major bearish trend line with resistance at $56.00.
The hourly RSI is above the 60 level, and the price is attempting to close above the 50% Fib retracement. The next hurdle could be $57.85. A clear move above $57.85 could send the price toward $58.50. Any more gains might open the doors for a test of $58.80.
Conversely, the price might start a fresh decline from $57.30 or $57.85. Immediate support sits near $56.45 or the 50-hour simple moving average. The key breakdown zone on the WTI crude oil chart might be $55.55.
If there is a downside break, the price might decline toward $54.85. Any more losses might encourage the bears for a push toward $54.00.
This article represents the opinion of the Companies operating under the FXOpen brand only. It is not to be construed as an offer, solicitation, or recommendation with respect to products and services provided by the Companies operating under the FXOpen brand, nor is it to be considered financial advice.

WTI Oil Bearish Outlook | Bear Flag Breakdown or Fakeout Ahead?WTI Oil (XTIUSD) price remains in a clear bearish structure trading below the descending channel and key resistance levels. After rejecting the 61.8% Fibonacci retracement near 58.30 oil continued to make lower highs and lower lows confirming sellers are still in control. The recent bounce from the 55.00 demand zone looks corrective and has formed a bear flag pattern which usually signals continuation to the downside. Price is currently consolidating around 57.20 below previous BOS and under the channel resistance indicating weakness.
As long as oil stays below 58.00–58.50 the bearish bias remains intact with liquidity resting below recent lows.
🔻Sell Setup 1: Bear Flag Rejection (Primary Setup)
- Sell Zone: 57.80 – 58.30
- Reason: Price is forming a bear flag after a strong drop and is rejecting the 61.8% Fibonacci level, with bearish market structure intact.
- Stop Loss: Above 59.50 (above channel & structure high)
- Targets: TP1: 55.00, TP2: 53.00, TP3: 52.00
🔻Sell Setup 2: Higher Resistance Sell (Liquidity Grab)
- Sell Zone: 59.80 – 60.30
- Reason: This zone aligns with strong resistance, previous supply, and descending channel top, where liquidity above recent highs may be taken before reversal.
- Stop Loss: Above 61.00
- Targets: TP1: 57.20, TP2: 55.00, TP3: 53.00
A strong rejection from the sell zone favors continuation lower, while a sustained break above 60.50 would invalidate the bearish setup.
Note
Please risk management in trading is a Key so use your money accordingly. If you like the idea then please like and boost. Thank you and Good Luck!

Bearish drop?WTI Oil (XTI/USD) could make a short-term pullback to the pivot and could reverse to the swing low support.
Pivot: 60.30
1st Support: 54.80
1st Resistance: 65.75
Dow Jones (US30) is falling towards the pivot, which is a pullback support and could rise to the 161.8% Fibonacci extension.
Pivot: 47,063.30
1st Support: 45,135.60
1st Resistance: 50,049.13
Disclaimer:
The opinions given above constitute general market commentary and do not constitute the opinion or advice of IC Markets or any form of personal or investment advice.
Any opinions, news, research, analyses, prices, other information, or links to third-party sites contained on this website are provided on an "as-is" basis, are intended to be informative only, and are not advice, a recommendation, research, a record of our trading prices, an offer of, or solicitation for, a transaction in any financial instrument and thus should not be treated as such. The information provided does not involve any specific investment objectives, financial situation, or needs of any specific person who may receive it. Please be aware that past performance is not a reliable indicator of future performance and/or results. Past performance or forward-looking scenarios based upon the reasonable beliefs of the third-party provider are not a guarantee of future performance. Actual results may differ materially from those anticipated in forward-looking or past performance statements. IC Markets makes no representation or warranty and assumes no liability as to the accuracy or completeness of the information provided, nor any loss arising from any investment based on a recommendation, forecast, or any information supplied by any third party

Heading towards pullback resistance?WTI Oil (XTI/USD) is rising towards the pivot, which acts as a pullback resistance and could reverse to the 1st support.
Pivot: 57.45
1st Support: 55.20
1st Resistance: 58.51
Disclaimer:
The opinions given above constitute general market commentary and do not constitute the opinion or advice of IC Markets or any form of personal or investment advice.
Any opinions, news, research, analyses, prices, other information, or links to third-party sites contained on this website are provided on an "as-is" basis, are intended to be informative only, and are not advice, a recommendation, research, a record of our trading prices, an offer of, or solicitation for, a transaction in any financial instrument and thus should not be treated as such. The information provided does not involve any specific investment objectives, financial situation, or needs of any specific person who may receive it. Please be aware that past performance is not a reliable indicator of future performance and/or results. Past performance or forward-looking scenarios based upon the reasonable beliefs of the third-party provider are not a guarantee of future performance. Actual results may differ materially from those anticipated in forward-looking or past performance statements. IC Markets makes no representation or warranty and assumes no liability as to the accuracy or completeness of the information provided, nor any loss arising from any investment based on a recommendation, forecast, or any information supplied by any third party

XTI/USD Short Bias – Can Sellers Maintain Control?🛢️ WTI/USOIL BEARISH SWING TRADE - ENERGIES MARKET OPPORTUNITY 📊
⚡ TRADE SETUP: SHORT OPPORTUNITY
━━━━━━━━━━━━━━━━━━━━━━━━━━━━━━━
📍 ASSET: XTI/USD (WTI Crude Oil) | ENERGIES
⏰ TIMEFRAME: Swing Trade (4H - Daily)
📈 BIAS: BEARISH ⬇️
💼 ENTRY STRATEGY - "LAYERING METHOD" 🎯
━━━━━━━━━━━━━━━━━━━━━━━━━━━━━━
Use Multiple Limit Order Layers for optimal entry execution:
✅ Layer 1: $60.00
✅ Layer 2: $59.00
✅ Layer 3: $58.00
💡 Why This Works:
Averages down your entry price
Reduces slippage risk
Allows gradual position building
Maximizes fill probability
🔧 CUSTOMIZABLE: Adjust layers based on YOUR risk management & capital allocation
🛑 STOP LOSS ⛔
━━━━━━━━━━━━━━━━━━━━━━━━━━━━━━
📌 Recommended SL Level: $61.00 (above supply zone)
⚠️ DISCLAIMER: This is a reference point only. Adjust YOUR stop loss based on:
Your risk tolerance
Account size
Trading strategy
Technical support/resistance
🚨 Risk Management First: Never risk more than 2-3% per trade
🎯 TAKE PROFIT TARGETS 💰
━━━━━━━━━━━━━━━━━━━━━━━━━━━━━━
Primary Target: $53.00 ⬇️
📊 Technical Confluence at $53.00:
✓ Strong support zone (oversold recovery area)
✓ Reversal trap potential
✓ High probability profit zone
💡 Profit-Taking Strategy:
Scale out 1/3 at $56.00 (quick gains lock)
Scale out 1/3 at $54.50 (momentum confirmed)
Scale out 1/3 at $53.00 (final target)
⚠️ DISCLAIMER: This is guidance only. Your profit targets should align with YOUR strategy, market conditions, and risk/reward ratio. Take profits at YOUR comfort level.
═══════════════════════════════════════════════════════════════
🔗 CORRELATED PAIRS TO WATCH 📡
━━━━━━━━━━━━━━━━━━━━━━━━━━━━━━
1. USD/CAD (USDCAD) 📈 POSITIVE CORRELATION
• Current: ~1.4320
• Why: Canada is oil-exporting nation. Oil ⬇️ = CAD weakens
• Action: Watch USD strength - if USD rises, more pressure on oil
• Impact: ⭐⭐⭐⭐⭐ (5/5 Relevance)
2. S&P 500 (US500) 📊 INVERSE CORRELATION
• Current Level: ~6,800+
• Why: Rising energy costs = lower corporate margins = stock weakness
• Action: If stocks fall, risk-off → oil likely continues lower
• Impact: ⭐⭐⭐⭐ (4/5 Relevance)
3. US Dollar Index (USDZZ) 💵 STRONG NEGATIVE CORRELATION
• Why: Oil priced in USD. Strong dollar = cheaper oil for foreigners = lower demand
• Action: Monitor DXY strength - bullish USD = bearish oil
• Impact: ⭐⭐⭐⭐⭐ (5/5 Relevance)
4. Natural Gas (NATGAS/TradingView equivalent) ⚡ SECTOR CORRELATION
• Why: Both energy commodities, affected by demand
• Action: Watch as confirmation signal for energy sector weakness
• Impact: ⭐⭐⭐ (3/5 Relevance)
5. Russian Ruble (USDRUB) 🇷🇺 COMMODITY-LINKED CORRELATION
• Why: Russia major oil producer. Oil prices directly impact RUB
• Action: Weak ruble often signals oil pressure from supply concerns
• Impact: ⭐⭐⭐ (3/5 Relevance)
📋 TRADE CHECKLIST ✓
━━━━━━━━━━━━━━━━━━━━━━━━━━━━━━
✅ Check USD strength confirmation
✅ Verify oversold condition on daily chart
✅ Confirm supply zone rejection above $61
✅ Monitor correlated pairs for confirmation
✅ Set alerts on each layer ($60, $59, $58)
✅ Define your max loss amount (2-3% rule)
✅ Plan exit strategy BEFORE entering
⚡ KEY POINTS SUMMARY 🔑
━━━━━━━━━━━━━━━━━━━━━━━━━━━━━━
🎯 Entry: Layered approach ($60→$59→$58)
🛑 Stop Loss: $61.00 (adjust to YOUR strategy)
💎 Target: $53.00 strong support
📊 Risk/Reward: Define YOUR ratio before entry
🔔 Confirmation: Watch USD, stocks, CAD correlation

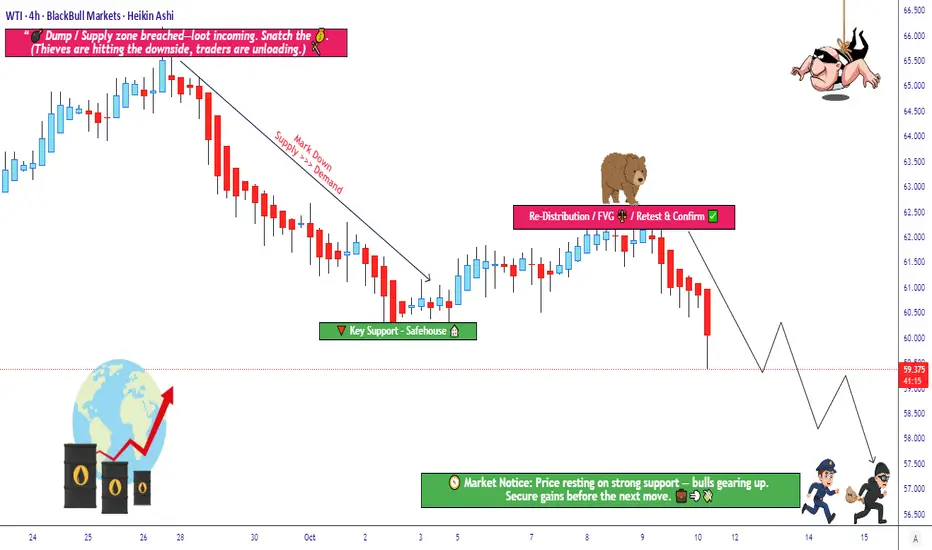
Is Crude Oil Setting Up for a Major Bearish Reversal?🛢️ XTI/USD “WTI” – Bearish Redistribution Zone Incoming (Thief Strategy Inside)
📉 Setup Overview
Market: XTI/USD (WTI crude oil)
Bias: Bearish confirmed — we’re looking for re-distribution / supply pressure to take control
Trade Type: Swing / Day Trade hybrid
🎯 Entry Plan (Thief-Layer Strategy)
I use a layering / multiple limit order approach (aka “Thief Strategy”). You may use any price level as entry, but here’s my preferred ladder:
Sell Limit @ 61.500
Sell Limit @ 61.000
Sell Limit @ 60.500
Sell Limit @ 60.000
Sell Limit @ 59.500
(You may extend more layers if you like)
You don’t need to hit all layers — just get partial fills, ride the move downward.
🚫 Stop Loss
Thief’s SL: 62.500
⚠️ Note to Thief OG’s: I’m not forcing you to follow my SL. You choose what works. Make money, take money — at your own risk.
🎯 Target
We see police barricade as a strong support zone + oversold trap possibility.
So primary target: 57.000
⚠️ Note to Thief OG’s: Don’t blindly hold to my TP. If price gives you your gains early, escape with your money — don’t wait for perfection.
🔍 Related Pairs & Correlations
AMEX:USO or USOIL (oil ETFs / indices) – real-world crude correlation
$BRENT/USD – watch for strength or weakness divergence
AMEX:XOP / AMEX:OIH (oil & gas sector indices) – sentiment in energy names
Key point: if Brent weakens while WTI breaks down, it reinforces the bias.
📌 Key Technical Notes
We’re waiting for ** redistribution / supply zone** to hold — a retest or failure bounce is ideal setup.
Oversold conditions + a “trap” candle (fake breakout) strengthen the move.
Use layering to average in, not “all-in” at once.
Be ready for whipsaws around support zones; partial exits can help.
✨ “If you find value in my analysis, a 👍 and 🚀 boost is much appreciated — it helps me share more setups with the community!”
Disclaimer: This is Thief-style trading strategy just for fun. I am not giving financial advice. Trade at your own decision and risk.
#WTI #CrudeOil #XTIUSD #EnergyTrading #OilStrategy #Layering #SwingTrade #DayTrade #BearishBias #ThiefStrategy
Market Analysis: Oil Price Gains TractionMarket Analysis: Oil Price Gains Traction
Crude oil price is recovering and it could climb further higher toward $62.00.
Important Takeaways for Oil Price Analysis Today
- Crude oil prices are moving higher above the $59.00 resistance zone.
- There is a connecting bullish trend line forming with support at $59.40 on the hourly chart of XTI/USD.
Oil Price Technical Analysis
On the hourly chart of WTI Crude Oil, the price started a decent increase against the US Dollar. The price gained bullish momentum after it settled above $58.20.
The bulls pushed the price above the 50-hour simple moving average, and the RSI climbed toward 70. The price tested the $60.20 zone and is currently consolidating gains. There was a minor pullback below $60.00, and the price tested the 23.6% Fib retracement level of the upward move from the $58.20 swing low to the $60.20 low.
Immediate resistance is near $60.20. If the price climbs further higher, it could face bears near $60.50. The next key area of interest might be $61.20. Any more gains might send the price toward $62.00.
Conversely, the price might correct gains and test $59.40. There is also a connecting bullish trend line forming with support at $59.40 and the 50-hour simple moving average.
The main bid area on the WTI crude oil chart could be $59.00 and the 61.8% Fib retracement. If there is a downside break, the price might decline toward $58.20. Any more losses may perhaps open the doors for a move to $57.20.
This article represents the opinion of the Companies operating under the FXOpen brand only. It is not to be construed as an offer, solicitation, or recommendation with respect to products and services provided by the Companies operating under the FXOpen brand, nor is it to be considered financial advice.

Bearish reversal off overlap resistance?WTI Oil (XTI/USD) is rising towards the pivot, which is an overlap resistance and could reverse to the 1st support.
Pivot: 62.24
1st Support: 56.51
1st Resistance: 65.75
Disclaimer:
The opinions given above constitute general market commentary and do not constitute the opinion or advice of IC Markets or any form of personal or investment advice.
Any opinions, news, research, analyses, prices, other information, or links to third-party sites contained on this website are provided on an "as-is" basis, are intended to be informative only, and are not advice, a recommendation, research, a record of our trading prices, an offer of, or solicitation for, a transaction in any financial instrument and thus should not be treated as such. The information provided does not involve any specific investment objectives, financial situation, or needs of any specific person who may receive it. Please be aware that past performance is not a reliable indicator of future performance and/or results. Past performance or forward-looking scenarios based upon the reasonable beliefs of the third-party provider are not a guarantee of future performance. Actual results may differ materially from those anticipated in forward-looking or past performance statements. IC Markets makes no representation or warranty and assumes no liability as to the accuracy or completeness of the information provided, nor any loss arising from any investment based on a recommendation, forecast, or any information supplied by any third party.

Bullish breakout?WTI Oil (XTI/USD) is reacting off the pivot, which acts as a pullback support that aligns with the 50% Fibonacci retracement and could bounce to the 1st resistance.
Pivot: 59.54
1st Support: 59.01
1st Resistance: 60.82
Disclaimer:
The opinions given above constitute general market commentary and do not constitute the opinion or advice of IC Markets or any form of personal or investment advice.
Any opinions, news, research, analyses, prices, other information, or links to third-party sites contained on this website are provided on an "as-is" basis, are intended to be informative only, and are not advice, a recommendation, research, a record of our trading prices, an offer of, or solicitation for, a transaction in any financial instrument and thus should not be treated as such. The information provided does not involve any specific investment objectives, financial situation, or needs of any specific person who may receive it. Please be aware that past performance is not a reliable indicator of future performance and/or results. Past performance or forward-looking scenarios based upon the reasonable beliefs of the third-party provider are not a guarantee of future performance. Actual results may differ materially from those anticipated in forward-looking or past performance statements. IC Markets makes no representation or warranty and assumes no liability as to the accuracy or completeness of the information provided, nor any loss arising from any investment based on a recommendation, forecast, or any information supplied by any third party.
