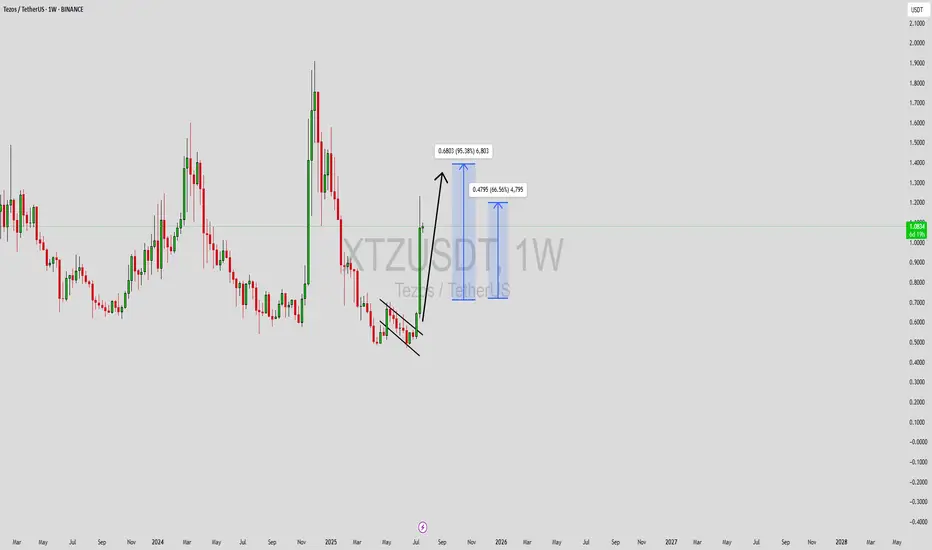
XTZUSDT Forming Falling WedgeXTZUSDT is forming a clear falling wedge pattern, a classic bullish reversal signal that often indicates an upcoming breakout. The price has been consolidating within a narrowing range around $0.65 USDT, suggesting that selling pressure is weakening while buyers are beginning to regain control amid a recent 20% surge to multi-week highs. With consistent volume confirming accumulation at lower levels exceeding $180 million daily, the setup hints at a potential bullish breakout soon. The projected move could lead to an impressive gain of 90% to 100%+ once the price breaks above the wedge resistance, igniting interest in XTZUSDT price prediction for Tezos enthusiasts.
This falling wedge pattern is typically seen at the end of downtrends or corrective phases, and it represents a potential shift in market sentiment from bearish to bullish. Traders closely watching XTZUSDT are noting the strengthening momentum as it nears a breakout zone near $0.70, fueled by Etherlink L2 launches and RWA tokenization momentum. The good trading volume adds confidence to this pattern, showing that market participants are positioning early in anticipation of a reversal in this self-amending layer 1 blockchain token.
Investors’ growing interest in XTZUSDT reflects rising confidence in the project’s long-term fundamentals and current technical strength, especially with integrations like Google cloud credits for builders and European asset expansions. If the breakout confirms with sustained volume, this could mark the start of a fresh bullish leg. Traders might find this a valuable setup for medium-term gains, especially as the wedge pattern completes and buying momentum accelerates in falling wedge breakout crypto plays.
✅ Show your support by hitting the like button and ✅ Leaving a comment below! (What is You opinion about this Coin) Your feedback and engagement keep me inspired to share more insightful market analysis with you!
XTZBTC

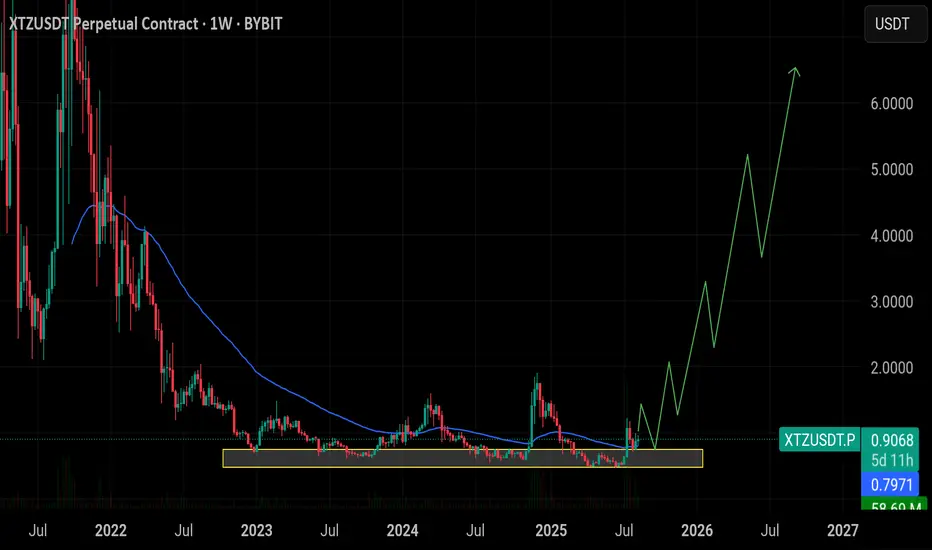
$XTZ Long-Term Accumulation AnalysisSEED_DONKEYDAN_MARKET_CAP:XTZ Long-Term Accumulation Analysis
🔸XTZ has been consolidating in a major accumulation zone between $0.50 – $0.76 for a long period, showing strong demand at lower levels. Current price is above this range, suggesting patience is needed for the bulk of entries — but partial exposure can be taken now to avoid missing upside.
🔸 Smart Entry Zone:
Primary accumulation entries remain between $0.50 – $0.76. Wait for a pullback into this range to add larger positions, but consider adding a small position at the current price to catch any early moves.
🔸 Upside Target: $6.00+
Once accumulation resolves, historical patterns point toward a potential rally to $3.00, $4.20, and eventually $6.00+.
🔸 Risk Level at $0.48:
A sustained break below $0.48 would invalidate the accumulation structure.
🔸 Outlook:
Add a light position now at 0.90 and , then wait for price to revisit the $0.50 – $0.76 zone before building the core position. Hold for long-term upside.
Tezos (XTZBTC) Ultra-Bullish · Short-Term Growth PossibleHere you have an ultra-bullish chart. The trend reversal is already confirmed and we have a higher low in place. That is, we have the initial bullish breakout after the early July low. This bullish move produced a retrace and the retrace ended as a higher low. As the higher low also reached its end, the next move is the continuation of the initial bullish breakout, the resumption of the bullish trend.
This chart is ultra-bullish. The signals are already confirmed and the action is already happening since early last month. Since we have a true bottom and years of sustained bearish action, we can expect the reverse now to unravel, an uptrend. Higher highs and higher lows.
Tezos vs Bitcoin (XTZBTC) looks great and it seems this pair is ready to start its third wave. A third wave tends to be super strong, huge momentum and volume ending in a major high. A multiple years strong high. And yet, this would not be the end. After wave three we get wave four, which is a correction and then one more final wave, the fifth wave.
Everything is good and the market looks great. Tezos is preparing to grow, a bullish continuation next. Crypto is going up. Bitcoin will also grow. We are approaching the 2025 bull market bull run phase.
Namaste.

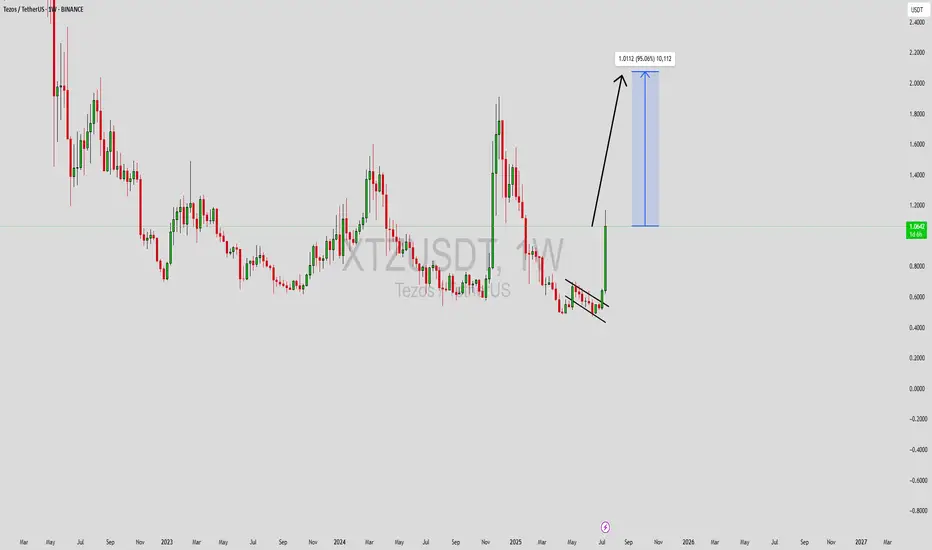
XTZUSDT Forming Falling WedgeXTZUSDT (Tezos/USDT) has recently broken out of a classic falling wedge pattern on the weekly chart, a bullish structure that often signals a strong upward reversal. After a prolonged period of consolidation and accumulation, the breakout is now supported by increasing volume, indicating renewed investor interest and possible institutional attention. Technically, the pattern breakout confirms the end of the downtrend and suggests a strong bullish impulse may follow.
The current market structure indicates a potential price rally of around 80% to 90% from the breakout level, with clear upside targets shown in the chart. The bullish candle formation following the wedge breakout is backed by a volume surge, adding further confirmation that buyers are stepping in. If this momentum continues, XTZ could challenge previous resistance levels and attract additional buyers along the way, especially swing traders looking for mid-term breakout plays.
With Tezos’ underlying technology being focused on scalable smart contracts and self-upgrading blockchain architecture, the project continues to attract attention in the decentralized finance (DeFi) and NFT sectors. As interest in fundamentally strong Layer 1 blockchains returns during market recovery phases, XTZ becomes a favorable candidate for both technical and fundamental investors alike.
✅ Show your support by hitting the like button and
✅ Leaving a comment below! (What is You opinion about this Coin)
Your feedback and engagement keep me inspired to share more insightful market analysis with you!
XTZ Is Waking Up – Next Stop $2.25?SEED_DONKEYDAN_MARKET_CAP:XTZ is currently bouncing from the lower boundary of a broadening wedge pattern on the weekly chart, signaling a potential trend reversal. This structure, characterized by widening price swings, has been developing since mid-2022.
The recent bullish move has pushed the price above a key resistance zone, with rising volume supporting the momentum. The upper boundary of the wedge aligns with the next major target zone near $2.25.
Resistance 1: $1.00
Resistance 2: $1.45
Resistance 3: $2.25
Cheers
Hexa
BINANCE:XTZUSDT

XTZUSDT Forming Falling WedgeXTZUSDT has recently formed a classic falling wedge pattern on the daily timeframe, a setup often associated with bullish reversals. This technical formation, marked by converging downward sloping trendlines, is showing early signs of a breakout. With volume steadily building, a breakout confirmation above resistance could signal the beginning of a major bullish rally. Historically, falling wedge breakouts result in strong upside moves, and in this case, we are looking at a potential gain of 80% to 90% in the coming weeks.
Tezos (XTZ) has consistently positioned itself as a strong contender in the smart contract and decentralized applications (dApp) sector. With its self-amending blockchain and focus on governance, it continues to attract attention from developers and institutional players alike. As the broader crypto market shows signs of recovery, coins like XTZ that offer real-world utility and technical strength tend to lead the charge.
From a market sentiment perspective, interest in XTZ has been rising across social platforms and trading communities. The combination of technical alignment and positive fundamentals suggests that bulls are preparing for a strong move. Traders should keep an eye on breakout levels and monitor volume spikes as confirmation of momentum. A successful wedge breakout could bring XTZUSDT back to previous highs or even beyond.
✅ Show your support by hitting the like button and
✅ Leaving a comment below! (What is You opinion about this Coin)
Your feedback and engagement keep me inspired to share more insightful market analysis with you!
XTZUSDT: Buyers Could Step In Here! XTZUSDT: Buyers Could Step In Here! 🔥
This blue box marks a critical level where buyers might become active from multiple perspectives.
Key Confirmation Factors:
CDV spikes, lower timeframe upward structure breaks, buyer dominance on volume profile, and liquidation heatmaps showing fresh liquidity above.
Reactions here could be pivotal. Keep your strategy sharp and always confirm your entries.
Don’t just watch! Act! Boost, comment, and follow for more killer insights! 🚀
Let me tell you, this is something special. These insights, these setups—they’re not just good; they’re game-changers. I've spent years refining my approach, and the results speak for themselves. People are always asking, "How do you spot these opportunities?" It’s simple: experience, clarity, and a focus on high-probability moves.
Want to know how I use heatmaps, cumulative volume delta, and volume footprint techniques to find demand zones with precision? I’m happy to share—just send me a message. No cost, no catch. I believe in helping people make smarter decisions.
Here are some of my recent analyses. Each one highlights key opportunities:
🚀 GMTUSDT: %35 FAST REJECTION FROM THE RED BOX
🎯 ZENUSDT.P: Patience & Profitability | %230 Reaction from the Sniper Entry
🐶 DOGEUSDT.P: Next Move
🎨 RENDERUSDT.P: Opportunity of the Month
💎 ETHUSDT.P: Where to Retrace
🟢 BNBUSDT.P: Potential Surge
📊 BTC Dominance: Reaction Zone
🌊 WAVESUSDT.P: Demand Zone Potential
🟣 UNIUSDT.P: Long-Term Trade
🔵 XRPUSDT.P: Entry Zones
🔗 LINKUSDT.P: Follow The River
📈 BTCUSDT.P: Two Key Demand Zones
🟩 POLUSDT: Bullish Momentum
🌟 PENDLEUSDT.P: Where Opportunity Meets Precision
🔥 BTCUSDT.P: Liquidation of Highly Leveraged Longs
🌊 SOLUSDT.P: SOL's Dip - Your Opportunity
🐸 1000PEPEUSDT.P: Prime Bounce Zone Unlocked
🚀 ETHUSDT.P: Set to Explode - Don't Miss This Game Changer
🤖 IQUSDT: Smart Plan
⚡️ PONDUSDT: A Trade Not Taken Is Better Than a Losing One
💼 STMXUSDT: 2 Buying Areas
🐢 TURBOUSDT: Buy Zones and Buyer Presence
🌍 ICPUSDT.P: Massive Upside Potential | Check the Trade Update For Seeing Results
🟠 IDEXUSDT: Spot Buy Area | %26 Profit if You Trade with MSB
📌 USUALUSDT: Buyers Are Active + %70 Profit in Total
🌟 FORTHUSDT: Sniper Entry +%26 Reaction
🐳 QKCUSDT: Sniper Entry +%57 Reaction
📊 BTC.D: Retest of Key Area Highly Likely
This list? It’s just a small piece of what I’ve been working on. There’s so much more. Go check my profile, see the results for yourself. My goal is simple: provide value and help you win. If you’ve got questions, I’ve got answers. Let’s get to work!

XTZ/USD: Strong Bearish Case Building – Technical AnalysisLooking at the XTZ/USD daily chart, multiple technical indicators and price action are aligning to present a compelling bearish case. Here's why I'm convinced we're heading lower:
Key Bearish Evidence:
MACD Structure
The MACD indicator is showing textbook bearish signals:
Clear bearish crossover on the daily timeframe
Histogram bars turning increasingly negative
Momentum clearly shifting downward
This suggests strong selling pressure and weakening buying interest.
RSI Confirmation
The RSI tells a clear story:
Recently rejected from overbought territory
Making lower highs alongside price
Currently showing downward momentum
No signs of positive divergence to suggest a bottom
Price Action Analysis
The price structure couldn't be more bearish:
Failed to hold above the $1.65 resistance
Series of lower highs and lower lows
Recently broke below key moving averages
Volume increasing on down moves
Market Structure
After the November rally, we're seeing classic distribution patterns:
Sharp rejection from recent highs
Increasing selling volume
Failed attempts to reclaim higher levels
Breakdown of support levels
Risk Levels:
Immediate resistance: $1.65
Critical support: $1.20
Target zone: $0.75 (Previous accumulation area)
What Makes This Setup Particularly Bearish:
The recent rally was sharp but unsustainable
Multiple timeframe confirmation of bearish momentum
Clear volume profile supporting the downside move
Technical indicators all aligning for further downside
The most telling aspect is how quickly the recent gains were given back, suggesting the bulls are exhausted and bears are taking control. Until we see a clear break and hold above $1.65, the path of least resistance remains firmly to the downside.
Traders should watch the $1.20 support level closely - a break below this could accelerate the downward movement toward the previous accumulation zone at $0.75.

XTZUSDT - Channel Breakout from Basis LineBINANCE:XTZUSDT - Ready to penetrate from channel basis line and push further on top. Holding strictly well, all i can say is the move it going to upwards now. Best Of Luck.

#XTZ/USDT#XTZ
The price is moving in a 4-hour channel and sticking to it well
The price rebounded well from the lower border of its neck at the green support level of 0.910
We have a tendency to stabilize above the Moving Average 100
We have oversold resistance on the RSI indicator to support the rise, with a downtrend about to break higher
Entry price is 0.910
The first goal is 0.980
Second goal 1.053
Third goal 1.12
Fourth goal 1.20

XTZUSDT#XTZ #TEZOS has formed an Inverse Head and Shoulders pattern. Currently, the right shoulder is finding support, and a bounce to the upside could occur. The expected scenario is illustrated in the chart.

Tezos: Crypto's Unofficial Index Coin 😂 (Formerly Stablecoin)A quick video pointing out the fact that Tezos ( SEED_DONKEYDAN_MARKET_CAP:XTZ ) pretty much *always* sticks to the middle of the pack, as far as crypto assets goes. The pattern implies that the asset is stable/reliable in a way that often goes unnoticed. (This pattern, plus its generous staking rewards makes it quite lucrative, in some cases.)
A pattern that I noticed while being active with the art collective DAO on TEIA and teia.cafe.

#XTZ
#XTZ
The price has been moving in a descending triangle since May 2023
The downtrend was breached
Moving average exceeded 100
Current price 1.062
First goal 1.312
Second goal 1.498
Third goal 1.762

XTZBTC 6HAnalyze XTZ/BTC
The long sequence of red candles in a row shows the bearish channel, but looking in perspective it is clear that XTZ/BTC is in an accumulative formation, indicating a trend reversal.
The MACD histogram is below the zero line, indicating the reduction in bearish momentum, its convergence indicates that a change in trend may be close.
The RSI is neutral and can move in any direction.
A confirmation would come with the MACD crossing the zero line and the RSI remaining above 50.
The prognosis is positive, with the XTZBTC pair alone being worth HOLD, as XTZ is a high-performance blockchain and open source platform for assets and applications, with a strong focus on code security, on-chain governance and decentralization. Tezos 2.0, the next step in the evolution of Tezos, aims to improve scalability (via layer 2), composability, and implement support for mainstream programming languages (such as Javascript, Typescript, Python, and many others).
Next supports: 0.00001772 / 0.00001692
Next resistances: 0.00002031 / 0.00002194

XTZ is bullishBullish structure, I am playing spot here...
Manage your riska nad use stoploss always.

#XTZ/USDT#XTZ
The price has been moving in a descending triangle since May 2023
The downtrend was breached
Moving average exceeded 100
Current price 1.062
First goal 1.312
Second goal 1.498
Third goal 1.762

#XTZ/USDT#XTZ
The price has been moving in a descending triangle since May 2023
The downtrend was breached
Moving average exceeded 100
Current price 1.062
First goal 1.312
Second goal 1.498
Third goal 1.762


Support range: 0.814-0.949Hello traders!
If you "Follow" us, you can always get new information quickly.
Please also click “Boost”.
Have a good day.
-------------------------------------
(XTZUSD chart)
In order for a full-fledged upward trend to begin, the key is whether it can rise above 1.338.
(1W chart)
To do so, we need to check whether we can break through the support and resistance range of 1.017-1.159.
However, since the volume profile section is formed from 1.631 to 2.088, the increase is likely to be limited.
(1D chart)
The key is whether it can receive support in the box range of 0.814-0.949 and rise beyond the 1.017-1.0601 range.
To continue the upward trend, it must break upward around 0.957, 1.127, 1314, and 1.556.
--------------------------------------------------
- The big picture
The full-fledged upward trend is expected to begin when the price rises above 29K.
This is the section expected to be touched in the next bull market, 81K-95K.
-------------------------------------------------- -------------------------------------------
** All explanations are for reference only and do not guarantee profit or loss in investment.
** Trading volume is displayed as a candle body based on 10EMA.
How to display (in order from darkest to darkest)
More than 3 times the trading volume of 10EMA > 2.5 times > 2.0 times > 1.25 times > Trading volume below 10EMA
** Even if you know other people’s know-how, it takes a considerable amount of time to make it your own.
** This chart was created using my know-how.
---------------------------------


XTZ ANALYSIS (4H)Hi, dear traders. how are you ? Today we have a viewpoint to SELL/ZONE the XTZ symbol.
For risk management, please don't forget stop loss and capital management
When we reach the first target, save some profit and then change the stop to entry
Comment if you have any questions
Thank You

XTZ IS BEARISHHi, dear traders. how are you ? Today we have a viewpoint to SELL/SHORT the XTZ symbol.
For risk management, please don't forget stop loss and capital management
When we reach the first target, save some profit and then change the stop to entry
Comment if you have any questions
Thank You

XTZ IS BULLISHHi, dear traders. how are you ? Today we have a viewpoint to BUY/LONG the XTZ symbol.
For risk management, please don't forget stop loss and capital management
When we reach the first target, save some profit and then change the stop to entry
Comment if you have any questions
Thank You
