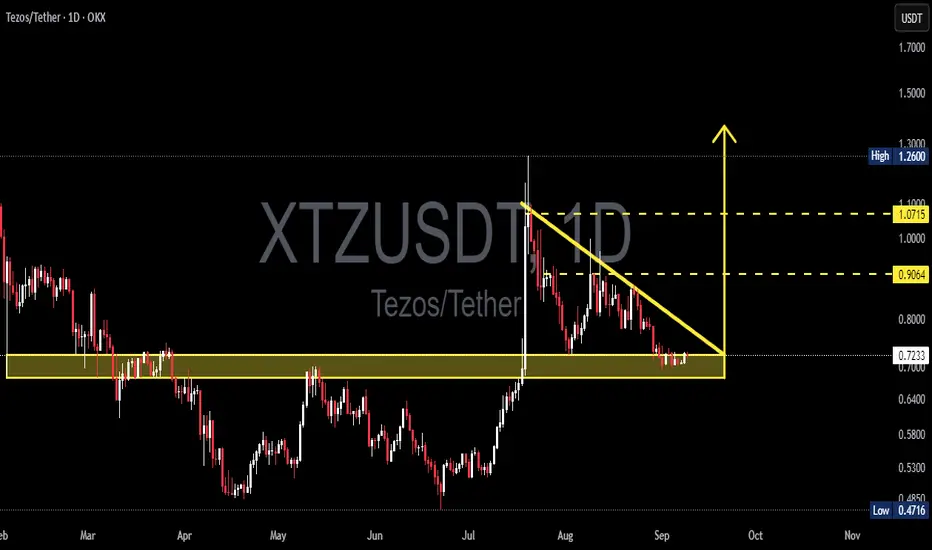
XTZ/USDT — Descending Triangle at a Critical Zone!Tezos (XTZ/USDT) is currently trading at a decision point. The chart shows a clear Descending Triangle pattern formed since late August, with price consolidating right above the major support zone at 0.64 – 0.74 USDT.
This structure is generally considered bearish, as consistent lower highs indicate selling pressure against a static demand zone. However, a confirmed breakout above the downtrend line could flip the pattern into a bullish reversal trigger.
---
🔑 Key Levels
Current Price: 0.7234 USDT
Major Support Zone: 0.64 – 0.74 USDT
Dynamic Resistance (downtrend line): ~0.78 – 0.82 USDT
Bullish Targets: 0.9064 → 1.0715 → 1.2600 USDT
Bearish Targets: 0.4716 (previous low), with a potential measured move down to ~0.37 USDT
---
🐂 Bullish Scenario (Reversal Potential)
Breakout above 0.78 – 0.82 with strong volume confirmation signals a bullish reversal.
First upside target at 0.9064, then 1.0715, and potentially 1.2600 if momentum continues.
Strategy: Buy on breakout or take aggressive entries near support with tight stops below 0.64.
Reward-to-Risk (R:R) ratio ≈ 2:1 if targeting 0.90.
---
🐻 Bearish Scenario (Breakdown Risk)
Breakdown below 0.64 – 0.70 with strong volume would confirm the descending triangle as bearish.
Downside targets: 0.4716 (structural support) and potentially 0.37 USDT (measured move).
Strategy: Short/hedge after confirmed breakdown and failed retest.
Potential R:R > 2.4:1 toward 0.37.
---
📌 Pattern Context
The Descending Triangle reflects market indecision: persistent sellers vs. defending buyers.
Such setups often end with a strong move, making this area a crucial inflection zone.
Volume will be the key confirmation factor — without it, false breakouts are highly likely.
XTZ is essentially in a “wait-and-see” equilibrium before its next decisive trend.
---
⚖️ Conclusion
XTZ is standing at a major turning point:
Bullish case: breakout could lift price toward 0.90 – 1.07.
Bearish case: breakdown may trigger a drop to 0.47 – 0.37.
Traders should wait for a daily close + volume confirmation before committing. This is a high-opportunity setup once direction is confirmed.
---
#XTZ #Tezos #XTZUSDT #Crypto #Altcoins #TechnicalAnalysis #PriceAction #ChartPatterns #SwingTrading
Xtzusdc
Tezos (XTZ)🚀 Comprehensive Analysis of Tezos (XTZ/USDT)
🌟 Introduction to Tezos (XTZ):
Tezos is a next-generation blockchain platform focusing on smart contracts and decentralized governance.
What makes Tezos stand out is its ability to upgrade its blockchain without requiring a hard fork, making it highly appealing to developers and investors alike.
📌 Key Use Cases of Tezos:
1️⃣ Smart Contracts: Similar to Ethereum but with lower fees and enhanced security.
2️⃣ NFTs and DeFi: A preferred platform for NFT artists and decentralized finance projects.
3️⃣ High Scalability: Employs Proof of Stake (PoS) for energy efficiency and faster transactions.
✨ Thanks to its technical features and advanced governance, Tezos has become a favorite for long-term investors.
📊 Technical Analysis:
🔹 Price Pattern:
Currently, XTZ is trading within an Expanding Triangle on the weekly timeframe.
After testing the upper resistance line of the triangle, the price has entered a short-term correction and reached a weekly support zone (gray zone: $1.118 - $1.246).
💡 Key Characteristics of the Pattern:
In expanding triangles, a breakout in either direction often leads to significant price movements.
If buyers weaken, the price could fall further to the triangle’s lower boundary and the yellow support zone ($0.574 - $0.646).
📈 Bullish Scenario:
If XTZ manages to:
1️⃣ Break through the red resistance zone ($1.767 - $1.989) with strong momentum and volume, and
2️⃣ Penetrate above the triangle,
We can expect a move toward the following Fibonacci targets:
1.618: $2.426 - $2.920
2.272: $3.967 - $4.654
2.618: $5.782 - $6.486
📌 Confirmation Signals for an Uptrend:
Increasing volume during the breakout.
RSI entering the overbought zone, indicating strong upward momentum.
📉 Bearish Scenario:
If the gray support zone fails to hold:
The price may drop to the lower boundary of the triangle and the yellow support zone ($0.574 - $0.646).
This area could serve as a potential entry point for strong buyers.
🔑 Key Notes for Traders:
Pay close attention to price action around critical levels like the red resistance zone and the triangle boundaries.
📌 Decision Points:
1️⃣ Red Zone ($1.767 - $1.989): A breakout here confirms an upward move.
2️⃣ Yellow Zone ($0.574 - $0.646): Buyer reactions in this zone will reveal their strength.
Risk Management and emotional control are crucial to avoid impulsive entries.
🎯 Conclusion:
XTZ is at a critical technical juncture. The breakout from the triangle or key levels will determine its next direction.
Potential Scenarios:
🔺 A breakout above the red zone could lead to Fibonacci targets.
🔻 A breakdown to the yellow support zone may attract strong buyers.

XTZUSD: long termXTZUSD: long term
The price is fixed below large volumes.
Perhaps the price will look for a new bottom before the end of the bear market.
If you like the idea, don't forget to subscribe and rate like👍

XTZ triangle breakout 📐Tezos broke up this triangle📐 and I think there is chance for run to 5 and even higher. Setting BUY LIMIT order to previous range high to catch🎣 the pullback.
ENTRY : local high @ 3.242
STOPLOSS (SL) : local low @ 2.857
TARGET (TP) : height of the triangle projected from midpoint of the local range (BUY LIMIT - STOPLOSS) @ 5.080
REWARD RISK RATIO (RRR) : 4.7
INVALIDATION : when SL level hit
Check my other stuff in related ideas.
Please like👍, comment🗣️, follow me✒️, enjoy📺!
⚠️Disclaimer: I'm not financial advisor. This is not a financial advice. Do your own due dilingence.

Tezos XTZ headed for new ATHIt would appear my previous analysis about the cup and handle pattern is playing out. XTZ Tezos is looking to head to new all time highs. The only question is how long will it take to achieve its price above $12 USD.
Please like and subscribe if you like the content.
This is not financial advice and is to be used for educational purposes only as I am not a financial advisor.
Happy Sunday XTZ Hodler and Traders alike!

XTZ (Tezos) - Key level broken - 40% upside potentialThe market seems to be recovering and moving from bearish to bullish (in the short term at least)
Tezos has built up 4 touches on a key level and broken through. It's likely we see a retest before lift off. If tezos grows we can aim for a re-test of the previous high. That's a 40% increase and would be a nice catch.
In my opinion Tezos is undervalued compared to other coins and I think we could see real action if the wider market trend starts to accelerate and 40% could just be the beginning.
If we fail to meet this rise upward - we look fairly safe at the $3.15 dollar mark and I would expect it to bounce and consolidate here.
This is not financial advice.
If you enjoyed this analysis please like and follow. Also I'm considering making some videos instead of static analyis and if you'd be interested in seeing these please drop me a comment.
