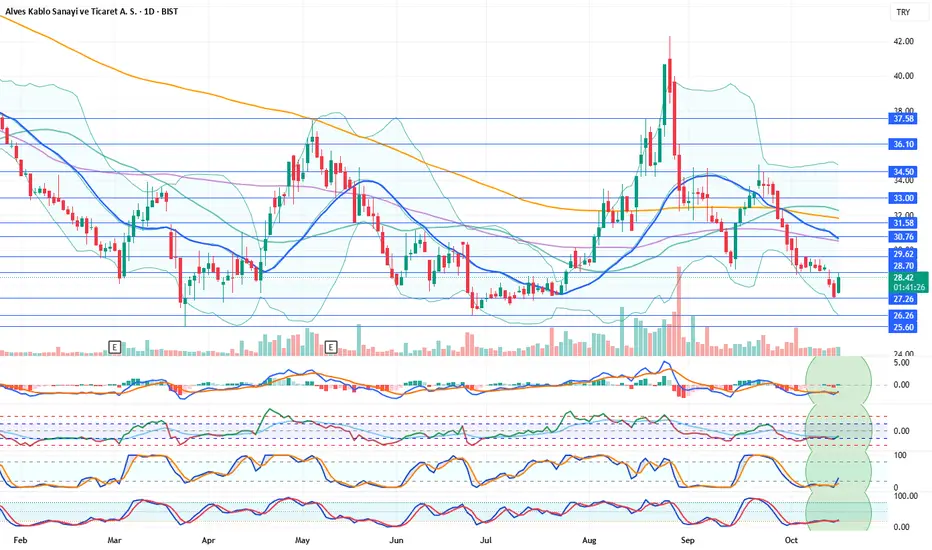
ALVES Stock Analysis & CommentaryALVES Stock Analysis & Commentary
Daily technical indicators are positive. After forming support at 27.26, the stock appears to be recovering from that level. With indicators also showing positive momentum, we believe further recovery may occur. In a potential bullish scenario, the stock could have a chance to test the 21-day moving average (30.68).
Resistance Levels: 28.70 – 29.62 – 30.76 – 31.58
Support Levels: 27.26 – 26.26 – 25.60
We’d appreciate it if you could boost our posts and share them on your social media. 🚀
Legal Disclaimer:
The information, comments, and recommendations contained herein do not constitute investment advice. Investment advisory services are provided only within the framework of an investment advisory agreement to be signed between the investor and authorized institutions such as brokerage firms, portfolio management companies, and non-deposit banks.
The opinions expressed here are personal views and may not be suitable for your financial situation, risk profile, or return preferences. Therefore, no investment decisions should be made based solely on the information and opinions presented on this page.
XU100
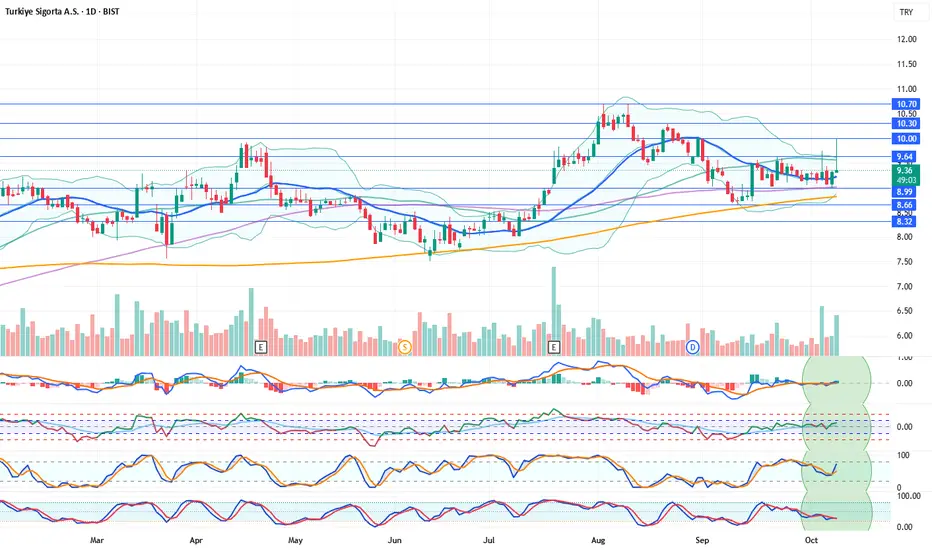
TURSG Stock Analysis CommentaryTURSG Stock Analysis Commentary
Daily technical indicators are positive. The stock has risen above its 21-day moving average (9.22). During the day, it climbed as high as 10.00 TL but failed to hold that level, pulling back below the 9.64 resistance point. With today’s positive movement, the stock has also turned its indicators to the positive side, giving a favorable impression for the coming days. If support continues, it may have another chance to test the 10.00 resistance level. In the medium term, the 10.70 resistance will be monitored.
Resistances: 9.64 – 10.00 – 10.30 – 10.70
Supports: 8.99 – 8.66 – 8.32
We’d appreciate it if you boost our posts and don’t forget to share them on your social media accounts!
Legal Disclaimer:
The information, comments, and recommendations provided here do not constitute investment advice. Investment advisory services are offered only within the framework of an investment advisory agreement to be signed between the investor and authorized institutions such as brokerage firms, portfolio management companies, and non-deposit banks. The opinions expressed on this page reflect personal views only. These views may not be suitable for your financial situation, risk profile, or return preferences. Therefore, investment decisions should not be made based solely on the information and commentary provided here.
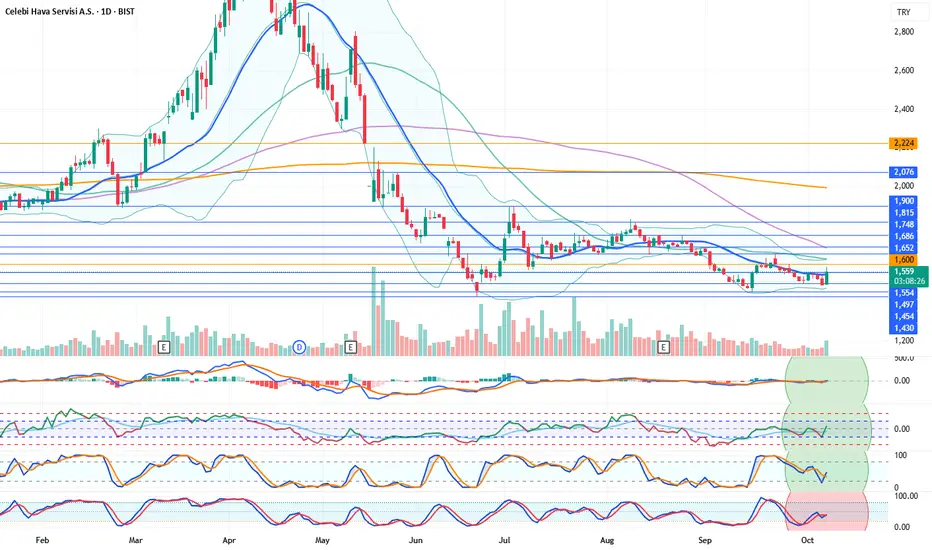
CLEBI Stock Analysis CommentaryCLEBI Stock Analysis Commentary
Daily technical indicators are positive. The stock is trying to stay above its 21-day moving average (1546). As of this post, we observe positive price movements above the 1554 support level. Volatility has also increased compared to the previous week. Closing the small price gap around the 1600 level could occur in the short term. If the stock manages to remain above the 21-day moving average, resistances at 1652 and higher levels will be the next to watch. With indicators remaining positive, the probability of seeing further upward movement in the stock has increased.
Resistance Levels: 1554 – (1600) – 1652 – 1686 – 1748
Support Levels: 1497 – 1454 – 1430
If you enjoy our analysis, we’d appreciate your support — don’t forget to share it on your social media!
Legal Disclaimer:
The information, comments, and opinions provided here do not constitute investment advice. Investment advisory services are offered under a formal investment advisory agreement between the investor and authorized institutions such as brokerage firms, portfolio management companies, or non-deposit banks. The views expressed here are personal opinions and may not be suitable for your financial situation, risk tolerance, or return preferences. Therefore, no investment decisions should be made based solely on the information provided on this page.
DERHL Stock Analysis CommentaryDERHL Stock Analysis Commentary
Daily technical indicators are positive. After a long break, the stock closed the week on a positive note, turning its indicators upward from the lower levels. If the support continues to hold, the stock may have a chance to break above its 21-day moving average (19.93). On September 16, the stock previously broke this average but failed to hold above it, leading to a long-term decline. Let’s see if this time it can stay above the average and manage to close the price gap at 27.86. For now, positivity seems to have started.
Resistances: 20.84 – 23.26 – 24.68 – 25.92 – (27.86)
Supports: 18.23 – 17.51 – 16.80
We’d appreciate it if you rocket 🚀 our posts and don’t forget to share them on your social accounts.
Legal Disclaimer:
The information, comments, and recommendations provided here do not fall within the scope of investment advisory services. Investment advisory services are offered under an investment advisory agreement to be signed between the client and brokerage firms, portfolio management companies, or non-deposit banks. The content shared on this page reflects only personal opinions. These views may not be suitable for your financial situation, risk profile, or return preferences. Therefore, investment decisions should not be made solely based on the information and writings presented here.

Will BIST100 beat inflation?BIST100, which has been trending horizontally and falling for a long time, I think it can rise from here and the final rise phase will come. It is too early to say this before the new ATH comes, but I think the 10.9k region is the decision point. When it stays above it, after a move to the 11.8 region, the price should be watched carefully and be cautious. It will look like second BTC 69k ath. So in these times, I think it would be more logical to proceed with a shorter hit and run.

What to expect from bis on a downward breakIn USDTRY weakly graphic of BIST100 index as it is shown, if the index break down the recent head and shoulders resistance level it may easily go to 150 in USDTRY basis.

Narrowing deviations ---> increasing expectancy (close @10.000)
Navigating around white lines: bad idea to think about bearish market
Slowing pace of weekly gains: good idea to support bullish outlook
Approaching bullish market: expected before Q4
Strengthening alpha coefficient: 15.000 in ramge

Not enough lows amid friction dense marketsRate of return is still bullish but rate of friction is bearish. This lead to stronger bearish market to normalize returns.

Probable correction of bist100 ( Xu100 )#bist100 index has formed an " evening star " candle pattern and this is the probable signal of downtrend. I drew probable bounce zones on #xu100 ( #borsaistanbul ) chart. Blue way, the W bounce seems more probable for now. Not financial advice.

XU100 EWSince the correction seems to be a 5 wave, I expect to see a new leg down after finalizing B wave

#XU100 düşüş başlıyor mu?#XU100 1D grafik;
Bist100 grafiğinde ilk göze çarpan RSI tarafındaki uyumsuzluk
Yılbaşından beri 7 aylık bir yükseliş trend çizgisi üzerinde nizami hareketine devam ediyor ve yeniden destek bölgesinde
Bu desteğin bir kez daha çalışacağını düşünüyorum ancak bu kez zayıflatacaktır
Akabinde tekrar bu desteğe geri dönüp burayı kırdıktan sonra retest ile birlikte aşağı yönlü bir harekete başlaması sürpriz olmaz
Bu seviyeden yaklaşık %22 aşağısına kadar düşmesi ihtimaline karşılık harmonik bir yapı da mevcut. O seviyelere kadar düşer mi orasını göreceğiz.
#bist #bist100 #bist30

XU100.USDWhen I examine the investment plans of international companies in Turkey, I can see this graph more clearly, its wanting to return to the upward trend.

THYAOnot investment advice!
In 2019 it fell out of the channel and in 2022 it returned to the ascending channel.. it's a bull trap :))
I wonder where it will go in the rising canal by 2028.. We know it will reach the neckline... and then what? 1gr or 2,9gr :))
BIST_DLY:THYAO/FX_IDC:XAUTRYG

#XU100 #bist100 figuring out something like this...300 dollars is an important physchological resistance. If BIST:XU100 does not able to break, i marked the retrace zone. The situation is bullish now.
NOT FINANCIAL ADVICE.

#AHGAZ seems to be bounced in short termBIST:AHGAZ 's bounce may give a buy opportunity in this zone.
NOT FINANCIAL ADVICE.


XU100 - END OF CORRECTIONCurrent correction from 03 Oct high till today, forms an abc (5-3-5) wave ending with two probable ending points. Expect to see a returning point between those two lines.

#ALFAS 's chart is promising... Very well accumulated. Bottom of the falling channel , expecting to break the channel up.
NOT FINANCIAL ADVICE.

XAUUSD, NDX, XU100: Real Prices (Inflation Adjusted)A historical overview of inflation adjusted prices: XAUUSD, NDX, XU100USD
We are all blinded by "the price", and usually oblivious to the real price and real earnings.
As inflation silently erodes the market, it may be a cold shower to take a look in the long run.
The elephant in the room: the gap between the nominal and CPI adjusted price.

#klser #kaleseramik may have a good bounce here+ Horizontal and historical support zone
+ Good accumulation
If #bist100 index gets better, this guy must walk up.
NOT FINANCIAL ADVICE.

The #bist100 correction is not over yet #xu100In this #usd pair of #borsaistanbul chart, it' s clearly seen that the index is about confirm the last declination from red box. If index breaks this box up with huge volume and weekly closings , the invalidation may come.
But, to be frank, the price will likely visit the brown box according to my strategy.
NOT FINANCIAL ADVICE, this is only an education post.

#CIMSA buying opportunity for short term tradingIf #bist100 index does not dump, this buy zone may work good.
NOT FINANCIAL ADVICE.

#bist100 #xu100 dead cat' s bounce is over?+ #bistendeks is now testing the vertical strong resistance region.
+ stoch is exhausted.
+ Due to macro, this correction must not be over yet.
I may be wrong , we' ll see incoming days.
NOT FINANCIAL ADVICE.
