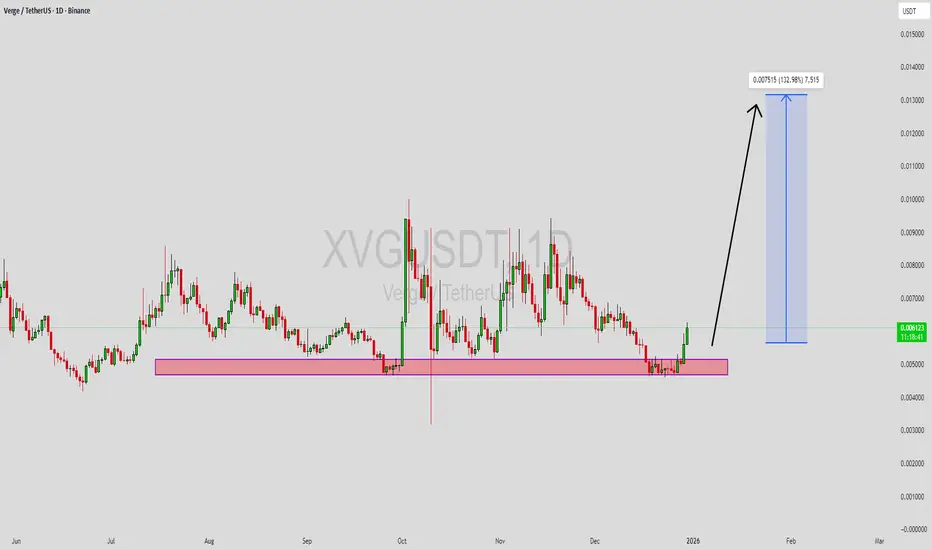
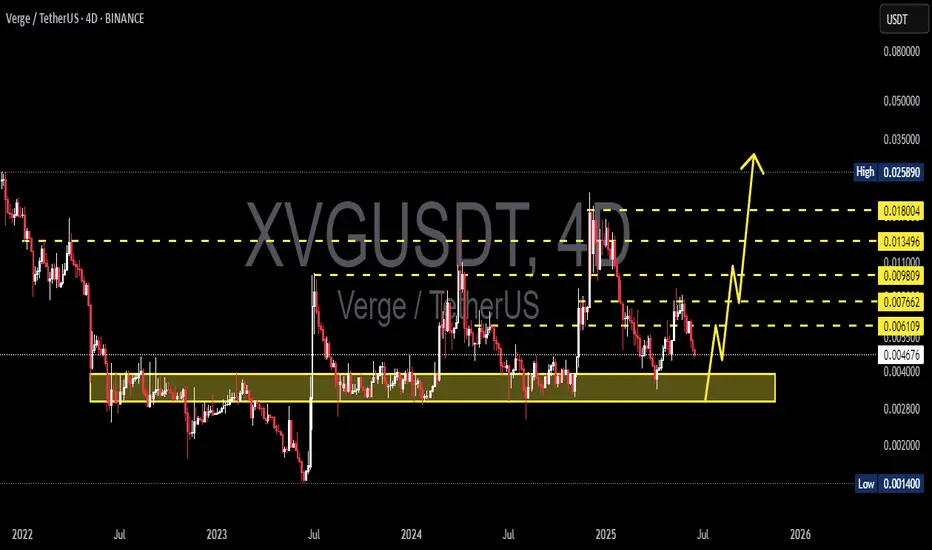
XVGUSDT Forming Bullish MomentumXVGUSDT is forming a clear bullish momentum pattern, a classic bullish reversal signal that often indicates an upcoming breakout. The price has been consolidating within a narrowing range, suggesting that selling pressure is weakening while buyers are beginning to regain control. With consistent volume confirming accumulation at lower levels, the setup hints at a potential bullish breakout soon. The projected move could lead to an impressive gain of around 90% to 100% once the price breaks above the wedge resistance.
This falling wedge pattern is typically seen at the end of downtrends or corrective phases, and it represents a potential shift in market sentiment from bearish to bullish. Traders closely watching XVGUSDT are noting the strengthening momentum as it nears a breakout zone. The good trading volume adds confidence to this pattern, showing that market participants are positioning early in anticipation of a reversal.
Investors’ growing interest in XVGUSDT reflects rising confidence in the project’s long-term fundamentals and current technical strength. If the breakout confirms with sustained volume, this could mark the start of a fresh bullish leg. Traders might find this a valuable setup for medium-term gains, especially as the wedge pattern completes and buying momentum accelerates.
✅ Show your support by hitting the like button and
✅ Leaving a comment below! (What is your opinion about this Coin?)
Your feedback and engagement keep me inspired to share more insightful market analysis with you!
Xvg
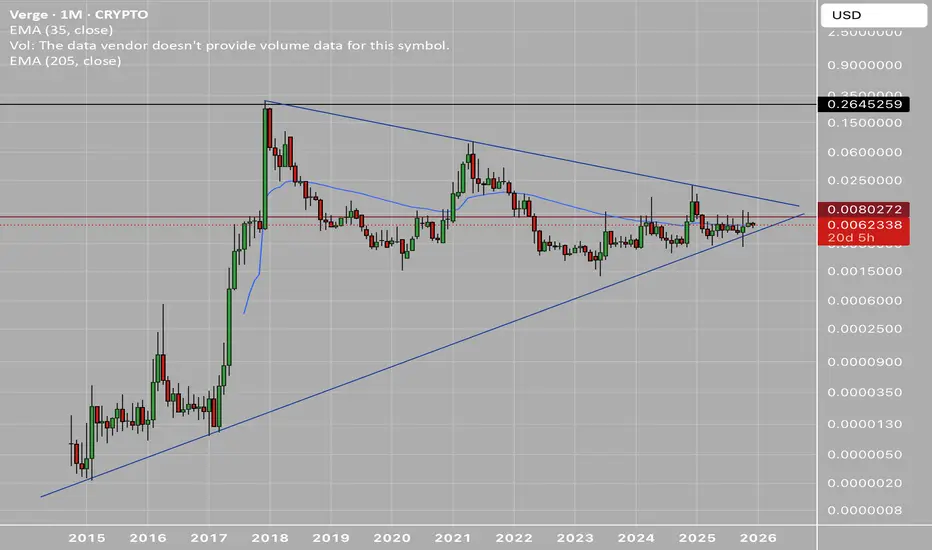
Verge (XVG) 1M Multi-Year Compression + Privacy Meta TailwindsSummary:
Verge (XVG) has spent nearly 7 years forming a massive symmetrical triangle on the 1-Month timeframe, compressing between a long-term ascending trendline dating back to 2015 and a multi-cycle descending resistance from the 2017 blow-off top. With privacy coins regaining momentum over the past two months, XVG is approaching a structural apex that historically precedes large expansions in this asset class.
Price is currently sitting just above the long-term trendline and pressing into tightening monthly range highs, with both EMAs flattening — a sign of equilibrium before resolution.
📌 Technical Breakdown
1. Multi-Year Symmetrical Triangle
Ascending support holds strong since 2015, tested numerous times.
Descending macro resistance from 2017 ATH keeps price capped.
Price is now near the apex, where long-term compression typically breaks with force.
2. Monthly EMAs Converging
35 EMA and 205 EMA are flattening, reflecting equilibrium.
This usually occurs before a macro trend shift.
Reclaiming the 35 EMA on the 1M would be the first sign of trend strength.
3. Privacy Coin Narrative Strengthening
Over the past 2 months, several privacy-focused assets have shown strong relative performance amid:
Regulatory debates
Increasing interest in anonymity-preserving tech
Capital rotation into older privacy brands
XVG historically benefits from these narrative cycles.
4. Key Levels on the Chart
Immediate Resistance: 0.0080–0.0082
Macro Breakout Level: Descending trendline (currently just above price)
Structural Target if Broken: 0.026–0.03
Ultimate Macro Target: 0.264 (top of chart’s marked level)
Major Support: Long-term ascending trendline
📈 Bullish Scenario
If XVG breaks above the descending trendline on a monthly close, it would mark the first macro breakout in years.
This could align with ongoing privacy sector strength.
Upside targets:
0.0080 → first major test
0.026–0.03 → measured move from the triangle structure
0.264 → long-term supply zone (multi-cycle level)
Given the size of the pattern, a breakout move could be significant.
📉 Bearish Scenario
Failure to hold the ascending trendline could trigger a retest of mid-range supports or invalidate the long-term structure.
This would occur if price closes firmly below the rising 10-year trendline.
📊 Final Takeaway
XVG is entering the most important point of its multi-year consolidation — the apex of a massive symmetrical triangle.
With privacy coins seeing renewed attention, XVG is positioned at a potentially explosive point on the chart.
All eyes should be on the monthly close as price tightens into long-term resistance with narrative momentum behind it.
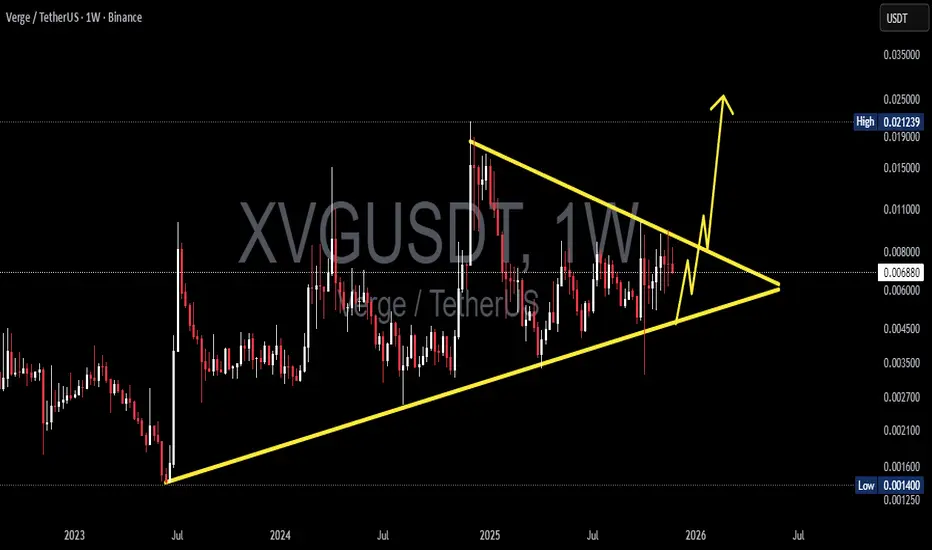
XVG/USDT — Symmetrical Triangle Nearing Breakout?XVG is approaching one of its most critical technical moments in the last two years. Price has been compressing inside a large Symmetrical Triangle since mid-2023, defined by:
1. Higher Lows showing steady accumulation from smart money, and
2. Lower Highs showing persistent supply pressure.
Both trendlines are now converging tightly into the Apex, creating a classic volatility squeeze — a condition where markets typically unleash a powerful breakout or breakdown once the compression phase is complete.
For XVG specifically, this setup is rare and historically tends to result in explosive volatility.
In short:
The next move could define XVG’s direction for months ahead.
---
Pattern Explanation
The Symmetrical Triangle on the Weekly chart signals a buildup of energy.
Shrinking volume + tightening candle range = compression before expansion.
This type of pattern often ends with a sharp directional move, not a gradual drift.
XVG rarely forms long-term triangles, making this squeeze even more significant.
This is a classic “calm before the storm” structure.
---
Bullish Scenario (If Breakout Occurs)
A bullish continuation will be confirmed if XVG closes a weekly candle above the upper trendline.
1. Bullish Trigger
Weekly close above 0.0075–0.0080
noticeable volume increase.
2. Follow-Through
A retest of the broken trendline turning into support strengthens the breakout.
3. Bullish Targets
Target 1: 0.011 – 0.015 → historical resistance
Target 2: 0.020 → psychological supply zone
Target 3 (Measured Move): 0.026 – 0.028
If fully realized, the upside potential ranges from +150% to +300%.
---
Bearish Scenario (If Breakdown Happens)
Weekly close below 0.0040–0.0045 triggers the bearish case.
1. Bearish Trigger
Breakdown + selling volume spike.
2. Bearish Targets
Target 1: 0.0030 → minor support
Target 2: 0.0014 → historical bottom
A breakdown would send XVG back into deep-discount territory, though so far the structure shows stronger bullish pressure via consistent higher lows.
---
Overall Summary
XVG is entering the final stage of a 2-year compression pattern. With almost no room left inside the triangle, the market is preparing for a decisive breakout or breakdown.
Historically, when XVG reaches this kind of pattern maturity, the move that follows tends to be fast, aggressive, and highly directional.
The next 1–2 weekly candles could shape the trend all the way into 2026.
#XVGUSDT #XVG #Verge #CryptoBreakout #TrianglePattern #VolatilitySqueeze #PriceAction #WeeklyChart #AltcoinAnalysis #CryptoTechnicalAnalysis
XVGUSD Livermore Accumulation Cylinder - VERGEVerge is currently ranging through a Livermore Accumulation Cylinder pattern. A breakout is expected soon.
In my opinion, as the fractal projection suggests, the future bottom will be at the level of the current ATH, $0.25.
This is not a financial advice. Do you own research.

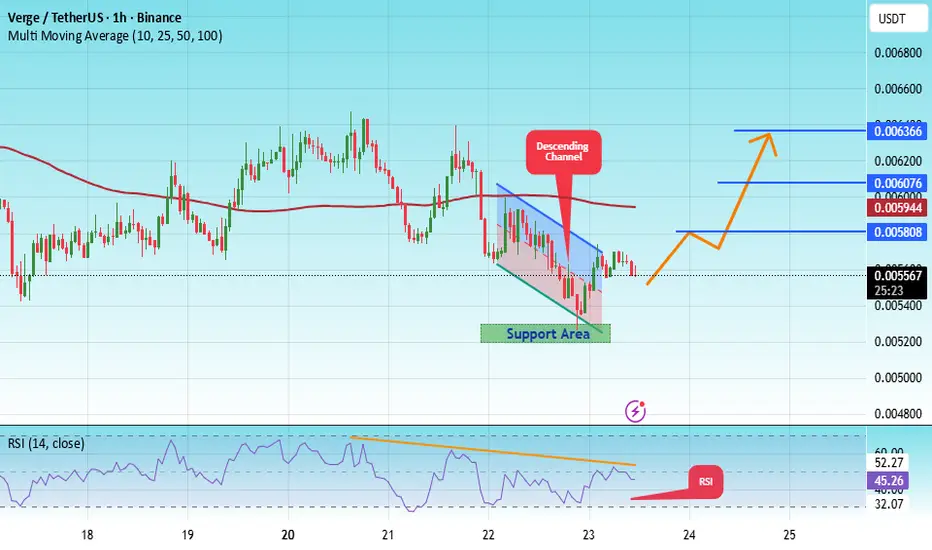
#XVG/USDT — Symmetrical Triangle at Apex: Breakout?#XVG
The price is moving within a descending channel on the 1-hour frame, adhering well to it, and is heading for a strong breakout and retest.
We have a bearish trend on the RSI indicator that is about to be broken and retested, which supports the upward breakout.
There is a major support area in green at 0.005234, which represents a strong support point.
We are heading for consolidation above the 100 moving average.
Entry price: 0.005558
First target: 0.005582
Second target: 0.006076
Third target: 0.006366
Don't forget a simple matter: capital management.
When you reach the first target, save some money and then change your stop-loss order to an entry order.
For inquiries, please leave a comment.
Thank you.
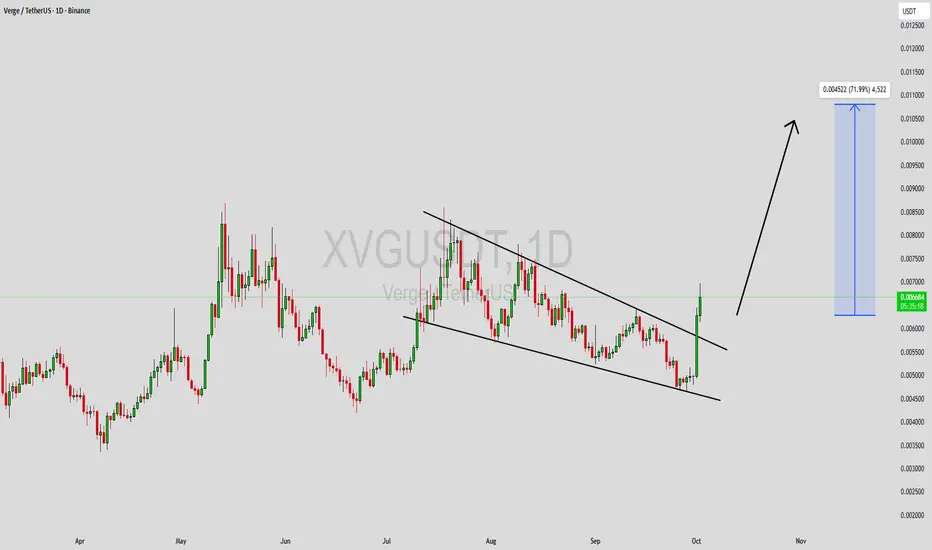
XVGUSDT Forming Falling WedgeXVGUSDT is showing a strong technical setup with the formation of a falling wedge pattern, often recognized as a bullish reversal indicator. This pattern suggests that selling pressure is tapering off while buyers are beginning to accumulate at lower levels. Once a breakout occurs above the wedge resistance line, XVGUSDT has the potential to experience a sharp rally, possibly leading to gains of 90% to 100%+. This pattern formation, coupled with supportive market sentiment, positions XVG for a promising upside move.
Trading volume for XVGUSDT remains steady, reflecting consistent market activity and investor participation. The volume pattern reinforces the credibility of this setup, as healthy volume typically accompanies reliable breakout signals. A surge in volume during the breakout would further validate bullish momentum and could accelerate price action significantly.
Investors have begun to take more interest in XVGUSDT, particularly as the project continues to regain visibility in the broader crypto space. The combination of strong technical structure, improving sentiment, and good liquidity makes XVG a coin to watch closely in the near term. If this momentum continues, XVGUSDT could deliver a substantial rally, creating attractive trading opportunities for both short-term and position traders.
✅ Show your support by hitting the like button and
✅ Leaving a comment below! (What is You opinion about this Coin)
Your feedback and engagement keep me inspired to share more insightful market analysis with you!

XVGUSDT Forming Falling WedgeXVGUSDT is showing strong bullish potential after forming a clear falling wedge breakout, a pattern that typically signals a reversal from bearish to bullish momentum. This structure suggests that sellers are losing control and buyers are stepping in with confidence. The breakout from the wedge indicates renewed market optimism, which could drive XVG’s price significantly higher in the coming sessions.
Trading volume is showing healthy activity, confirming genuine participation from market players. XVG has successfully retested the previous resistance zone, now acting as support, which strengthens the probability of a continuation toward higher levels. Based on current momentum and market behavior, a potential gain of 50% to 60%+ seems achievable as long as the bullish structure holds and volume remains steady.
Investor sentiment around XVGUSDT is improving, with traders eyeing this setup as a possible start to a stronger uptrend. If XVG continues to attract buyers at these key technical levels, it could trigger a sustained upward move and reclaim previous highs. Traders should monitor the support zone closely, as maintaining it will be crucial for confirming this bullish continuation.
✅ Show your support by hitting the like button and
✅ Leaving a comment below! (What is You opinion about this Coin)
Your feedback and engagement keep me inspired to share more insightful market analysis with you!

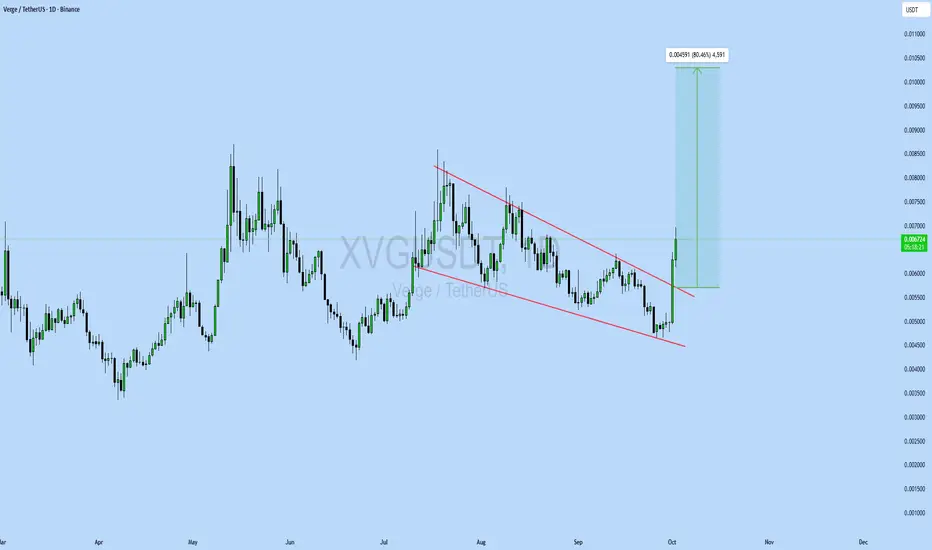
XVGUSDT UPDATE#XVG
UPDATE
XVG Technical Setup
Pattern: Bullish falling wedge breakout
Current Price: $0.00672
Target Price: $0.01131
Target % Gain: 80.46%
SGX:XVG has broken out of a falling wedge pattern on the 1D timeframe. The breakout signals strong bullish momentum with a target near $0.01131, offering around 80% upside potential. Continuation structure looks favorable if momentum sustains. Always use proper risk management.
XVGUSDT Forming Falling WedgeXVGUSDT is forming a falling wedge pattern, a well-recognized bullish reversal signal in technical analysis. This structure indicates that selling pressure is gradually weakening while buyers are starting to gain momentum. With consistent volume supporting the move, the probability of a strong breakout is increasing, making this pair an attractive setup for traders looking for medium-term opportunities.
The current chart structure suggests an expected gain of around 60% to 70% once the breakout confirms. A decisive move above the wedge resistance could trigger rapid upward momentum, attracting more traders and investors to join the rally. This type of pattern often precedes strong bullish runs, especially when supported by healthy market activity.
Investor interest in XVGUSDT is growing, and with solid trading volume and improving sentiment, this coin has the potential to see significant movement in the coming sessions. If momentum continues to build, XVG could become one of the standout performers among mid-cap crypto pairs.
✅ Show your support by hitting the like button and
✅ Leaving a comment below! (What is You opinion about this Coin)
Your feedback and engagement keep me inspired to share more insightful market analysis with you!
XVG/USDT — Symmetrical Triangle at Apex: Breakout?Pattern & Overview
The XVG/USDT daily chart is forming a symmetrical triangle — descending resistance from the Dec 2024 high and ascending support from the April 2025 low. Price is now around 0.00743 USDT, nearing the apex, indicating reduced volatility and an increased chance of a sharp breakout soon.
Pattern characteristics:
Higher lows (rising support line) suggest accumulation.
Lower highs (descending resistance) indicate continued supply overhead.
Volume usually contracts within the pattern; a valid breakout is often confirmed by a volume spike.
---
Key Levels (marked on chart)
Resistances / potential upside targets: 0.008696 (immediate), 0.011142, 0.015376, 0.020395, up to ~0.02124 (high).
Critical supports / breakdown levels: ascending trendline (~0.005–0.0055 zone) and historical low at 0.00313.
---
Bullish Scenario (confirmation & targets)
Confirmation: daily close above the descending resistance + increased buy volume. Ideally, wait for a daily close above 0.0080–0.0087 (breakout zone) before adding positions.
Measured targets (from current ~0.007428):
Target 1: 0.008696 → +≈17.1%
Target 2: 0.011142 → +≈50.0%
Target 3: 0.015376 → +≈107.0%
Example trade plan:
Conservative entry: after daily close > 0.0087.
Conservative stop: below breakout retest / under 0.0066 → stop ≈ -11.15%; R:R to Target 1 ≈ 1.5:1, to Target 2 ≈ 4.5:1.
Aggressive entry: buy now (~0.00743), stop below ascending trendline (~0.0055) → stop ≈ -25.96%; R:R to Target 1 ≈ 0.66:1 (higher risk).
---
Bearish Scenario (confirmation & targets)
Confirmation: daily close below the ascending trendline (~0.005–0.0055 zone) with increased sell volume. If confirmed, price could drop toward:
First support: 0.0050 → ≈-32.7% from current price.
Strong support: 0.0042 → ≈-43.5%.
Worst-case retest of historical low: 0.00313 → ≈-57.9%.
Short/Cut-loss strategy: wait for a confirmed close below support, then enter on a pullback/retest with stop above the retest level.
---
Risk Management
Symmetrical triangles can have false breakouts — always wait for confirmation (daily close + volume).
Limit risk per trade (e.g., 1–2% of capital). Adjust position size based on stop distance.
Take profits in stages: e.g., 30–50% at first resistance, another 30% at second resistance, trail the rest.
Keep an eye on news, listings, or on-chain events — crypto reacts strongly to short-term fundamentals.
> XVG is forming a contracting symmetrical triangle on the daily chart. Higher lows vs. lower highs — price is approaching the apex.
Bullish: daily close above 0.0080–0.0087 with volume → targets 0.0087 / 0.0111 / 0.0154 (+17% / +50% / +107% approx).
Bearish: daily close below rising support (~0.005–0.0055) → possible drop to 0.005 / 0.0042 / 0.00313 (-26% to -58% approx).
Wait for confirmation, manage your risk, and scale out profits. 📉📈
#XVG #Verge #XVGUSDT #Crypto #TechnicalAnalysis #Triangle #Breakout #Altcoins #RiskManagement
$XVG C&H long setupChart looks like a clear cup & handle. Looking for a breakout to the upside to reach top of the ascending channel...
XVGUSDT Forming Potential BreakoutXVGUSDT is shaping up with an interesting technical setup that could catch the eye of both short-term traders and long-term crypto investors. The chart currently suggests that Verge (XVG) is forming a potential breakout pattern after a period of consolidation within a descending channel. This pattern often signals that sellers are losing momentum, paving the way for an upward price reversal if a breakout above resistance occurs. With strong volume backing this move, XVGUSDT could deliver a solid gain in the 90% to 100%+ range if the bullish scenario plays out.
Verge has long held a spot among privacy-focused cryptocurrencies, known for its focus on anonymity and secure transactions. As crypto investors continue to diversify into projects with strong use cases, Verge’s established community and real-world applications add credibility to its potential upside. This renewed buying interest reflects growing optimism about Verge’s future, especially as it continues to improve its network and form new partnerships.
Traders should pay close attention to price action near the top trendline of this descending channel. A clear breakout with sustained volume could attract even more buyers, sparking a rally towards key resistance levels. Historically, Verge has seen sharp moves following similar technical setups, making this an appealing chart for swing traders aiming to capture high-percentage gains.
Keep XVGUSDT on your watchlist as we look for confirmation of this breakout in the days ahead. A decisive close above resistance could be the catalyst for the next major uptrend in this privacy coin’s journey.
✅ Show your support by hitting the like button and
✅ Leaving a comment below! (What is You opinion about this Coin)
Your feedback and engagement keep me inspired to share more insightful market analysis with you!

XVGUSDT 4D AnalysisXVG ~ 4D Analysis
#XVG Buy back on retest of this support block with short term target of at least 20%+ from this support.
XVG - Privacy is Important!Hello TradingView Family / Fellow Traders. This is Richard, also known as theSignalyst.
📈XVG has been overall bullish trading within the rising channel marked in blue and it is currently retesting the lower bound of the channel.
Moreover, the red zone is a strong structure.
🏹 Thus, the highlighted blue circle is a strong area to look for buy setups as it is the intersection of structure and lower blue trendline acting as a non-horizontal support.
📚 As per my trading style:
As #XVG approaches the blue circle zone, I will be looking for bullish reversal setups (like a double bottom pattern, trendline break , and so on...)
📚 Always follow your trading plan regarding entry, risk management, and trade management.
Good luck!
All Strategies Are Good; If Managed Properly!
~Rich

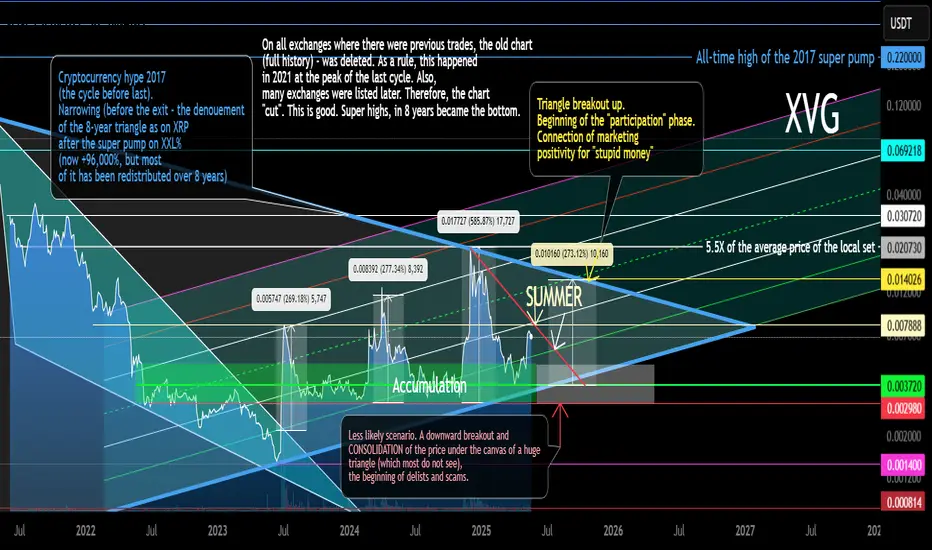
XRP vs XVG 8 Year Triangle Fractal Comparison 05 2025Logarithm. Time frame 1 month. Linear chart for clarity. Two cryptocurrencies of the super hype of altcoins in 2017 (the final alt season of the cycle before last). XRP is ahead of XVG. The structures are similar, but if XVG breaks through the triangle upwards like on XRP, then work with the first target, observing risk management. You can leave 5-10% of the position for the second target, but this is not necessary. As for XRP, everything is as before... local update in the XRP idea.
XVG Secondary trend (part) Resolution of the triangle 8 years 05 2025
XRP/USD Main trend 28 07 2022

XVG Secondary Trend (Part) Triangle Resolution 8 years 05 2025Logarithm. Time frame 3 days. Linear instead of candlestick specifically for clarity. This is the longest chart history on tradingview that could be found. It does not display everything as is. Where this cryptocurrency was previously traded, the exchanges deleted the entire trading history. Listing on new exchanges does not display the whole picture. I described and showed everything on the chart. More in the channel, screenshots and comparison with XRP, here the site does not provide an opportunity to make such a comparison, as there are simply no charts of such history.
Verge (XVG) like XRP identical chart of the main trend, and the same 8-year triangle after the pumping of 2017. The only difference is that XRP came out of its triangle half a year ago, in alt season #2 of this cycle, and this cryptocurrency is still in the canvas of its triangle. But the price is gradually being driven into a corner. In alt season #3, most likely, the denouement of this story lasting 8 years will occur. More up than down (at the beginning).
Verge (XVG), like XRP, is an asset of the super pump of 2017 and the price retention is -96-98% from the super pump by hundreds of thousands of percent (I am not mistaken exactly so), which forms a huge triangle on XXX (8 years). This is all inherent in the assets of the hype of 2017: XVG XRP NEM XLM ZEC XMR DASH LTC and so on ... Some of them, over the past 2 years, have become on the path of hype (XRP XLM), and some on the path of scam (I do not want to make anti-advertisement).
Most likely, everything will repeat on XVG, as on XRP, but only at the right time, in the final alt season of this cycle. "XVG captains" do not have as much money and a powerful state behind them as XRP, to go against the market and the general trend, therefore, they need the market hype to distribute "a little higher". And so with most of these altcoins. Do not forget to get rid of them on the pump. Remember, the more down-to-earth goals, the more likely you are to earn over the long term. Observe risk and money management.
Remember, there is a big alt season ahead, provided that you are an adequate person and your goals are appropriate.
Verge: Highest Volume EverOn the 19th of February XVGUSDT produced the highest volume ever on the daily timeframe.
See chart below:
This occurrence can signal the start of a new market phase.
Good afternoon my fellow trader....
Here we can see a consolidation channel that is more than two years long. Each time this channel is violated it happens on the upper boundary, resistance, support remains unchallenged as Verge has been producing long-term higher lows.
These are bullish signals. Now we have a very strong weekly volume bar after a mild corrective phase. We are looking at the start of a new bullish market phase.
This is just a friendly reminder. Verge (XVGUSDT) is about to blow-up.
Thank you for reading.
Namaste.

XVG - on the "VERGE" of breaking out!Hello TradingView Family / Fellow Traders. This is Richard, also known as theSignalyst.
📈 XVG has been in a correction phase trading within the falling blue channels.
🏹As XVG approaches the lower bound of the channels, which lines up perfectly with the demand zone marked in red, it would be an attractive zone (at least for me) to look for longs.
🏹On the other hand, for the bulls to take over long-term, a break above the last major high marked in blue around $0.015 is needed.
For now, we wait! ⏱️
📚 Always follow your trading plan regarding entry, risk management, and trade management.
Good luck!
All Strategies Are Good; If Managed Properly!
~Rich

*XVG* IS AWESOMEhello friends
This token has been modified after hitting a higher ceiling.
Now we can buy step by step with capital and risk management and move to the goals we specified.
*Trade safely with us*

XVG Looks bearish (4H)From where we entered "Start" on the chart, XVG correction seems to have started. This correction seems to be a diametric. By maintaining the red area, it can move towards the green box.
The low risk range for sell/short positions is the red box.
Closing a daily candle above the invalidation level will violate this analysis.
For risk management, please don't forget stop loss and capital management
Comment if you have any questions
Thank You

XVGUSDT (Verge) Updated till 29-12-24XVGUSDT (Verge) Daily timeframe range. PA stuck between 0.017649-0.010266 for a while now. staying above 0.010266 will eventually push it toward to 0.017649. alltho it needs some more volume here to break 0.017649 clean.

XVG Is Bullish And On FireI privately traded this token, SGX:XVG yesterday. Where I analyzed and draw the pattern seen on this chart below, I shared the idea in the chatroom, before it shoot up.
Sorry I did not publish it then. I am seeing another setup building up on the Daily TF , so i want to share it publicly before it began.
Verge (XVG) is a decentralized, open-source cryptocurrency that prioritizes user privacy and anonymity . Originally launched as DogeCoinDark in 2014, it was rebranded as Verge in 2016. Verge uses the TOR network to obfuscate IP addresses, ensuring that transactions are private and secure.
I have spotted another bull flag developing on the daily level, I am heavy on SGX:XVG , it is one of the most cheapest privacy coin at this time. HODLers are still early to the game .The bull flag is clearly identified on that chart, with recent support and resistance levels.
There's a wall of support around 0.012794 - 0.011997 , this offers a likely good entry price. A major Support level is seen at 0.009683 . The micro levels are already overbought, may be gearing up for pull-back soon.
👍 Like if you agree. Comment if you disagree.

XVG {Read the caption}hello friends
After a heavy fall, this coin was able to enter an ascending channel and hit a higher ceiling and floor, which we showed you in the picture.
Now, after hitting the roof for the third time, we have seen a correction.
Now the best option is to buy a staircase, one step here and in case of deeper modification, the next steps that we specified for you...
Its target is its initial price, which means we expect it to reach its supply price, and if it breaks and hits a new ceiling, we will give you a new update.
If you like, support us with like and comment.
