$XVG Reached 146sats support for 1st time...$XVG Reached 146sats support for 1st time after the bounce in Nov18...
Testing a support for the first time should enhance the probability of hodling succesfully..
Look what happened last time w/ a bounce around 30%+..
If you took this trade, please set up SL just in case!
#XVG
Xvg

Verge seems Bullish ?Hello all.
Bitcoin has just crushed all alts and you may think where it's gonna end. For now I can say it's continuing until BTC find a good psychological level of 5800-6000 (you can check my previous analysis of Bitcoin). Ok let's see how verge is doing. After a nice move in April 8 Verge (XVG) has been made influence of Bitcoin's movements and suffered. This chaos for Verge hushed around 153 sats where major moves started there since February. In a mid run Verge will find upper levels because it may potentially bounce again from 153 sats. On top of that iOS wallet and major updates are coming( a nice Meetup is in the way too). Hope you do your own risk and money management.
Thank you

$XVG Starting to show some signs of reversal sitting at support.$XVG Starting to show some signs of reversal sitting at support level around 160sats...
RSI coming out from oversold levels on the 6H
MACD starting to rise.
Volume showing some signs of life...
#XVG

VERGE - WORST IS BEHIND XVG HOLDERS - CryptoManiac101VERGE / USD TA Analysis
We can safely say that worst has been over for an average Verge holder as we see clear bottom that was found in December of 2018 and tested again in March of 2019
At this moment looking at fractals we can assume that this is another W pattern, however it can also be taken as an accumulation attempt which would be best way to look at it.
What is the timeline for an XVG holder until we see strong upward movement?
Just as an educated guess, I'd say this summer, but we can't be any more narrow in our timeline due to larger uncertainty in BTC market which should clear up in Q2

XVG Looks boring to meBecause it never, ever, ever, ever, ever, ever, ever, ever, ever does anything!
Here's some stuff on a chart that doesn't mean anything because XVG just goes:
--> / -- \ --> / -- \ --> / -- \ -->/\
/
Since we're on a \ , you can expect either a -- or a / , but not a / , because that's just preposterous!
Just having some fun with it. I'm hoping like y'all looking at it that the accumulation ends eventually!


XVGBTC reconsolidation before break outXVGBTC reconsolidation before break out.
potential for an IHS reversal and break out of symmetrical triangles

XVG Head & Shoulders Bottom?As I take a look at XVG's chart I notice a trend line dragging the price lower every time. After the higher low made by the last run down y noticed this head & shoulders pattern. Now, XVG is currently retesting the neckline of this pattern and we should see a bounce in the coming days.


$XVG USDT view... Broke & retest ~.0089 resistance zone...$XVG USDT view... Broke & retest ~.0089 resistance zone and shoot straight up...
UCTS Buy signal on the 1D
Volume rising over last days
RSI rising & over 80, MACD rising
I expect continuation over the targets in the chart... Make sure to lock profits on the way up #XVG

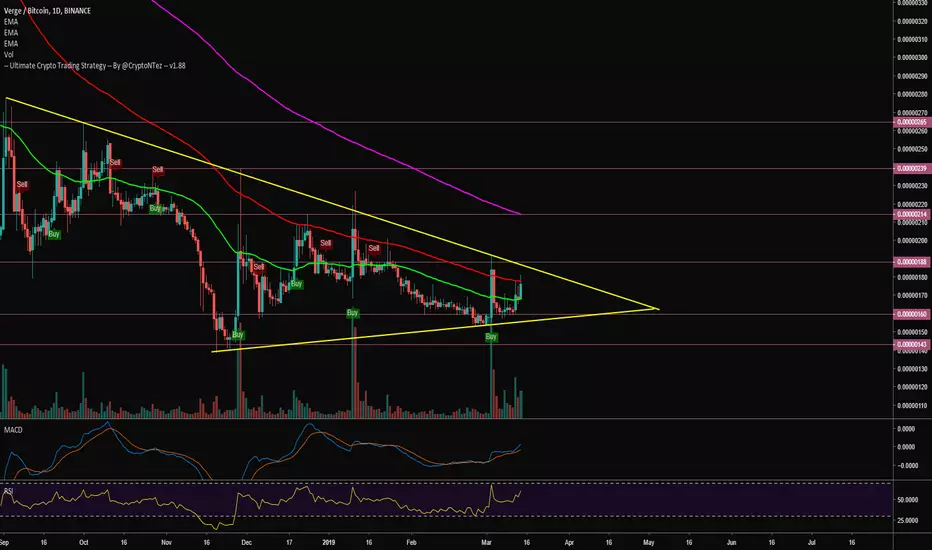
XVG/BTC BREAKOUT - short-term conservative targetsverge has broken out of its symmetrical triangle and is currently bouncing from a retest of its newfound support around 185 sats
Buy between 180-195 sats with conservative targets @
-225
-268
-326
Looking forward to reaching all listed targets in the coming week
not financial advice


Verge (XVGBTC) Highest Peak & Volume Since 2018Verge (XVGBTC) is moving again and this time it has finally broken above MA200. This resistance has been holding Verge back since early January 2019.
Trading volume is also at its highest since April 2018.
The RSI is also showing some strong bullish momentum.
The next resistance to break is EMA200.
If XVGBTC and move past it, you can expect some major gains.
All targets are marked on the chart.
The dashed brown line at the bottom can be used as a stop loss.
We have an active trade since November 2018, you can see it here:
Feel free to hit like now.
Thanks a lot for continued the support.
Namaste.


$XVG BTC view... Breakout from symmetrical triangle$XVG BTC view... Breakout from symmetrical triangle & ~190sats resistance zone...Expect a movement similar to USDT chart
UCTS Buy signal on the 1D
Volume rising over last days
RSI rising & entering over 80 values, MACD rising
Bullish shark pattern could be in play
#XVG


On the verge of mooning !Hello all.
Huge volume has arrived in XVG and golden crosses has happened. I think targets are available very soon. If it goes up like I see the chart, a long term uptrend will be started.

#XVGUSD: Higher support levels to $0.0122 USD in coming weeks?$XVG $USD
Price of BITTREX:XVGUSD above cloud on hourly chart with a nice pullback that offers an opportunity to enter the trade. Weekly price crossed the 20 week resistance level at $0.01 USD signaling a bullish momentum in the coming weeks. New higher support level at $0.0122 USD? Adding more $XVG!!

XVGBTC (Verge) Looking Good To Buy ..!!#XVGBTC (Daily)
Looking Good In Daily TF...
Bottomed Out,,
Short term Target 207 Sats
Mmidterm 266-270 Sats
Stop Loss Below 166 Sats

XVG LONGInline with my BTC TA and XVGBTC chart. I believe we are going to see a breakout of XVG. 20-30% profit to cap from 180 sats

Lots of lines pointing to $1+ $XVG #VergeCurrencyI haven't done this in a while so decided to fool around a bit given recent bullish indicators all across crypto.
Has anyone else put together a chart like this? Seems we have just 3 or so resistance lines before the next ATH . $1+ doesn't seem all to unreasonable.
Any comments? I'm open to suggestions/pointers.
I would also like to ask those Elliot Wavers here to put together a historic macro chart (since inception) as I'm deeply curious.
Thanks!

$XVG Trying to break over/retest EMA100 // Symmetrical triangle.
Volume increasing
Both RSI & MACD rising
UCTS Buy signal alive
We will need a spike/increase in volume to break over EMA100 that was rejected many times in the last months. Stay alert if happens.