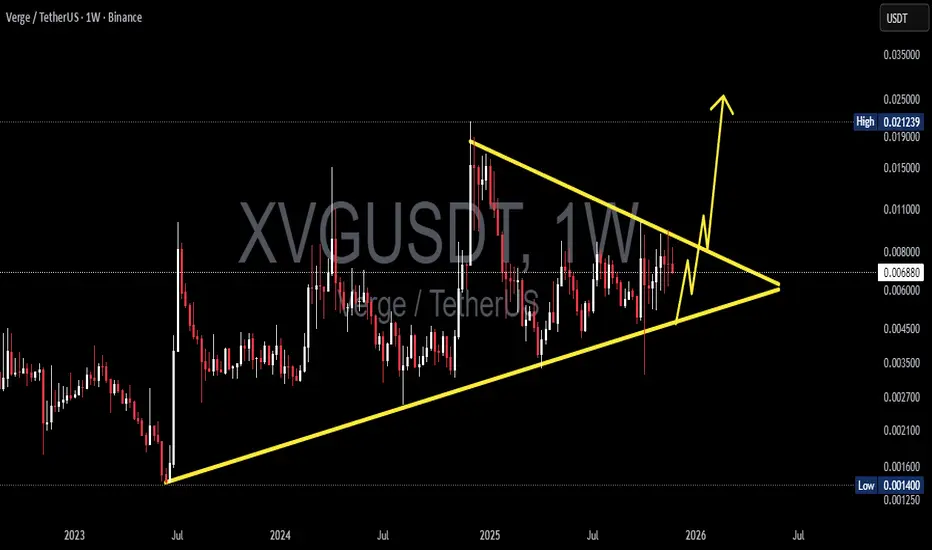
XVG/USDT — Symmetrical Triangle Nearing Breakout?XVG is approaching one of its most critical technical moments in the last two years. Price has been compressing inside a large Symmetrical Triangle since mid-2023, defined by:
1. Higher Lows showing steady accumulation from smart money, and
2. Lower Highs showing persistent supply pressure.
Both trendlines are now converging tightly into the Apex, creating a classic volatility squeeze — a condition where markets typically unleash a powerful breakout or breakdown once the compression phase is complete.
For XVG specifically, this setup is rare and historically tends to result in explosive volatility.
In short:
The next move could define XVG’s direction for months ahead.
---
Pattern Explanation
The Symmetrical Triangle on the Weekly chart signals a buildup of energy.
Shrinking volume + tightening candle range = compression before expansion.
This type of pattern often ends with a sharp directional move, not a gradual drift.
XVG rarely forms long-term triangles, making this squeeze even more significant.
This is a classic “calm before the storm” structure.
---
Bullish Scenario (If Breakout Occurs)
A bullish continuation will be confirmed if XVG closes a weekly candle above the upper trendline.
1. Bullish Trigger
Weekly close above 0.0075–0.0080
noticeable volume increase.
2. Follow-Through
A retest of the broken trendline turning into support strengthens the breakout.
3. Bullish Targets
Target 1: 0.011 – 0.015 → historical resistance
Target 2: 0.020 → psychological supply zone
Target 3 (Measured Move): 0.026 – 0.028
If fully realized, the upside potential ranges from +150% to +300%.
---
Bearish Scenario (If Breakdown Happens)
Weekly close below 0.0040–0.0045 triggers the bearish case.
1. Bearish Trigger
Breakdown + selling volume spike.
2. Bearish Targets
Target 1: 0.0030 → minor support
Target 2: 0.0014 → historical bottom
A breakdown would send XVG back into deep-discount territory, though so far the structure shows stronger bullish pressure via consistent higher lows.
---
Overall Summary
XVG is entering the final stage of a 2-year compression pattern. With almost no room left inside the triangle, the market is preparing for a decisive breakout or breakdown.
Historically, when XVG reaches this kind of pattern maturity, the move that follows tends to be fast, aggressive, and highly directional.
The next 1–2 weekly candles could shape the trend all the way into 2026.
#XVGUSDT #XVG #Verge #CryptoBreakout #TrianglePattern #VolatilitySqueeze #PriceAction #WeeklyChart #AltcoinAnalysis #CryptoTechnicalAnalysis
Xvgusdtlong
XVGUSDT Forming Falling WedgeXVGUSDT is showing strong bullish potential after forming a clear falling wedge breakout, a pattern that typically signals a reversal from bearish to bullish momentum. This structure suggests that sellers are losing control and buyers are stepping in with confidence. The breakout from the wedge indicates renewed market optimism, which could drive XVG’s price significantly higher in the coming sessions.
Trading volume is showing healthy activity, confirming genuine participation from market players. XVG has successfully retested the previous resistance zone, now acting as support, which strengthens the probability of a continuation toward higher levels. Based on current momentum and market behavior, a potential gain of 50% to 60%+ seems achievable as long as the bullish structure holds and volume remains steady.
Investor sentiment around XVGUSDT is improving, with traders eyeing this setup as a possible start to a stronger uptrend. If XVG continues to attract buyers at these key technical levels, it could trigger a sustained upward move and reclaim previous highs. Traders should monitor the support zone closely, as maintaining it will be crucial for confirming this bullish continuation.
✅ Show your support by hitting the like button and
✅ Leaving a comment below! (What is You opinion about this Coin)
Your feedback and engagement keep me inspired to share more insightful market analysis with you!

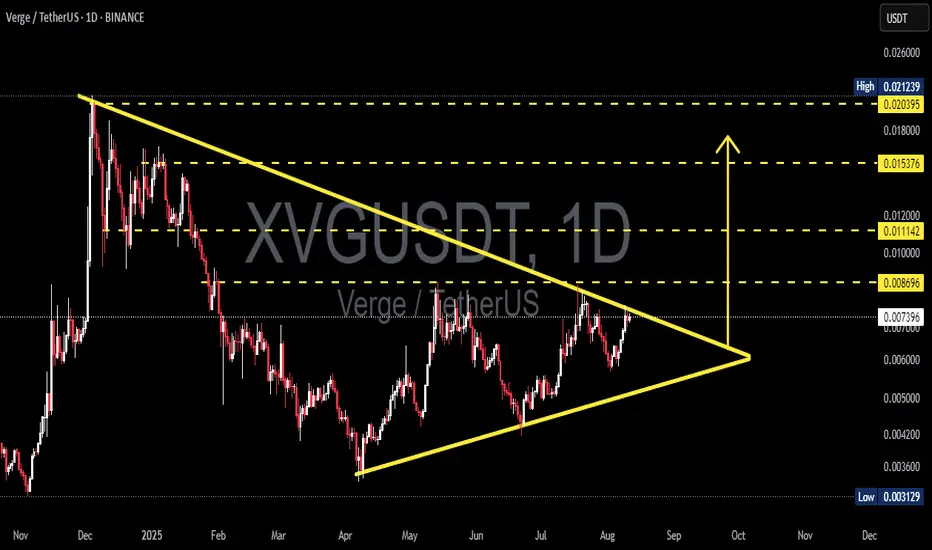
XVG/USDT — Symmetrical Triangle at Apex: Breakout?Pattern & Overview
The XVG/USDT daily chart is forming a symmetrical triangle — descending resistance from the Dec 2024 high and ascending support from the April 2025 low. Price is now around 0.00743 USDT, nearing the apex, indicating reduced volatility and an increased chance of a sharp breakout soon.
Pattern characteristics:
Higher lows (rising support line) suggest accumulation.
Lower highs (descending resistance) indicate continued supply overhead.
Volume usually contracts within the pattern; a valid breakout is often confirmed by a volume spike.
---
Key Levels (marked on chart)
Resistances / potential upside targets: 0.008696 (immediate), 0.011142, 0.015376, 0.020395, up to ~0.02124 (high).
Critical supports / breakdown levels: ascending trendline (~0.005–0.0055 zone) and historical low at 0.00313.
---
Bullish Scenario (confirmation & targets)
Confirmation: daily close above the descending resistance + increased buy volume. Ideally, wait for a daily close above 0.0080–0.0087 (breakout zone) before adding positions.
Measured targets (from current ~0.007428):
Target 1: 0.008696 → +≈17.1%
Target 2: 0.011142 → +≈50.0%
Target 3: 0.015376 → +≈107.0%
Example trade plan:
Conservative entry: after daily close > 0.0087.
Conservative stop: below breakout retest / under 0.0066 → stop ≈ -11.15%; R:R to Target 1 ≈ 1.5:1, to Target 2 ≈ 4.5:1.
Aggressive entry: buy now (~0.00743), stop below ascending trendline (~0.0055) → stop ≈ -25.96%; R:R to Target 1 ≈ 0.66:1 (higher risk).
---
Bearish Scenario (confirmation & targets)
Confirmation: daily close below the ascending trendline (~0.005–0.0055 zone) with increased sell volume. If confirmed, price could drop toward:
First support: 0.0050 → ≈-32.7% from current price.
Strong support: 0.0042 → ≈-43.5%.
Worst-case retest of historical low: 0.00313 → ≈-57.9%.
Short/Cut-loss strategy: wait for a confirmed close below support, then enter on a pullback/retest with stop above the retest level.
---
Risk Management
Symmetrical triangles can have false breakouts — always wait for confirmation (daily close + volume).
Limit risk per trade (e.g., 1–2% of capital). Adjust position size based on stop distance.
Take profits in stages: e.g., 30–50% at first resistance, another 30% at second resistance, trail the rest.
Keep an eye on news, listings, or on-chain events — crypto reacts strongly to short-term fundamentals.
> XVG is forming a contracting symmetrical triangle on the daily chart. Higher lows vs. lower highs — price is approaching the apex.
Bullish: daily close above 0.0080–0.0087 with volume → targets 0.0087 / 0.0111 / 0.0154 (+17% / +50% / +107% approx).
Bearish: daily close below rising support (~0.005–0.0055) → possible drop to 0.005 / 0.0042 / 0.00313 (-26% to -58% approx).
Wait for confirmation, manage your risk, and scale out profits. 📉📈
#XVG #Verge #XVGUSDT #Crypto #TechnicalAnalysis #Triangle #Breakout #Altcoins #RiskManagement
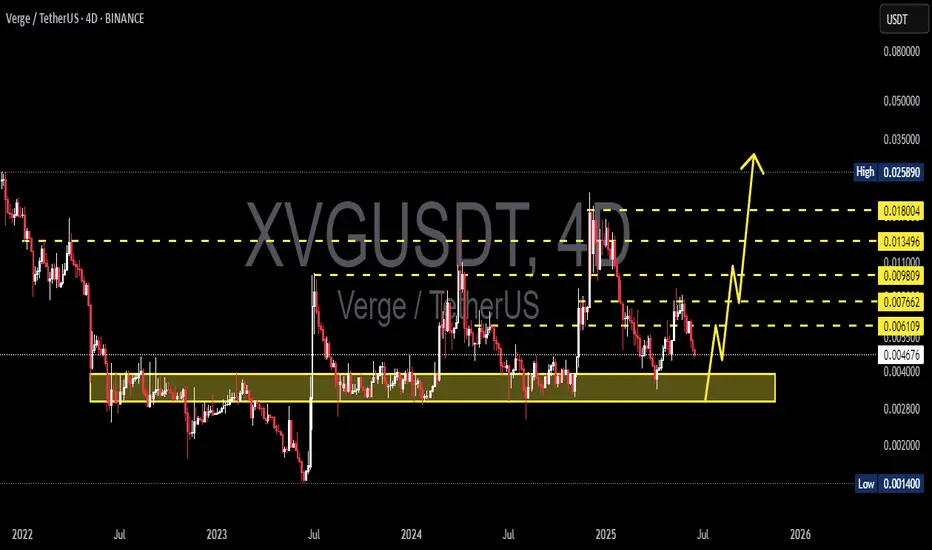
XVGUSDT 4D AnalysisXVG ~ 4D Analysis
#XVG Buy back on retest of this support block with short term target of at least 20%+ from this support.
XVG/USDT breakout alert
XVG/USDT breakout alert
XVG has successfully broken out of the symmetrical triangle pattern, indicating a potential bullish continuation. Symmetrical triangles often signal consolidation before a breakout, and in this case, the breakout is to the upside, which is typically a bullish sign.
As long as XVG holds above the breakout level and gains volume support, further upward movement can be expected. However, if the price falls back into the triangle range, it may turn out to be a fakeout, so caution is advised.
Key levels to watch:
* Breakout confirmation zone
* Previous resistance now acting as support
* Volume surge to confirm strength
Stay alert and watch the price action closely.

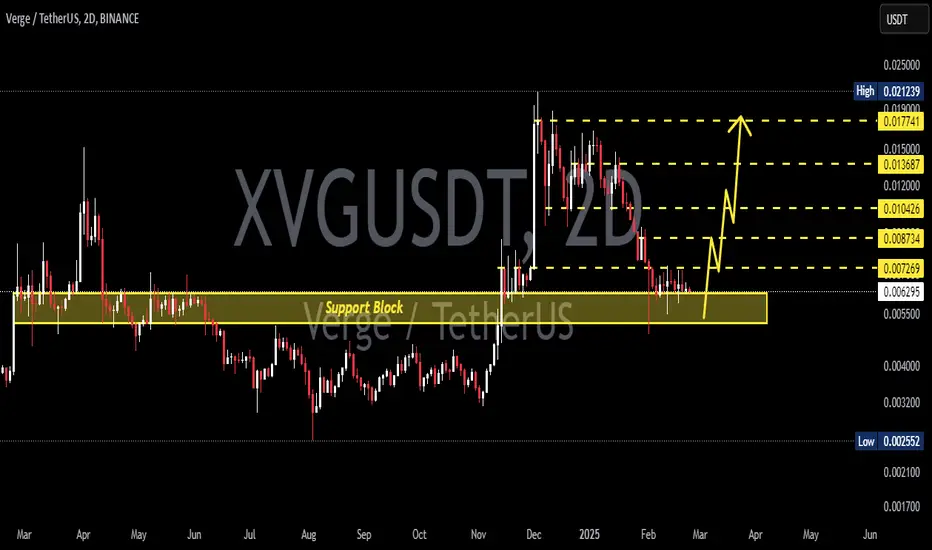
XVGUSDT 2DXVG ~ 2D Analysis
#XVG Buy gradually from here with a short -term target of at least 15%+. This is the previous accumulation area.
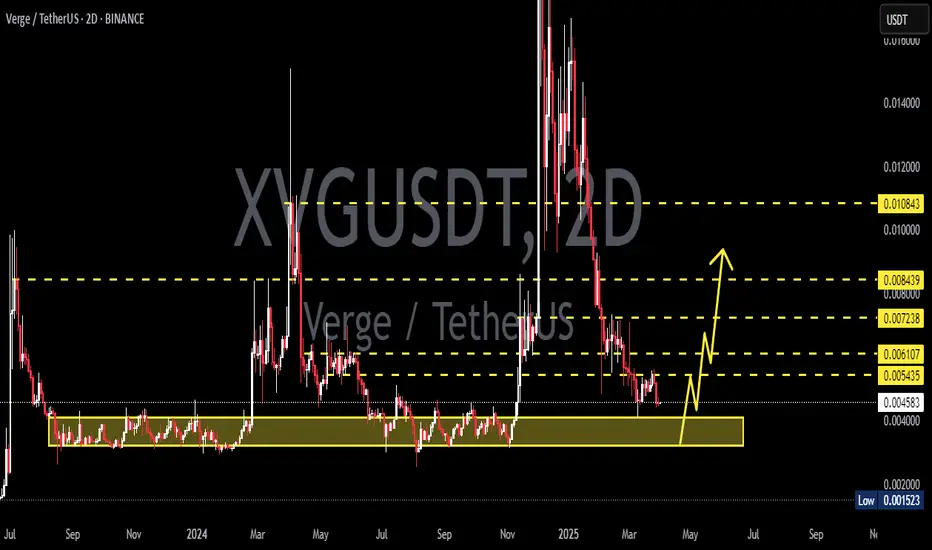
XVGUSDT 2DXVG ~ 2D Analysis
#XVG Support blocks that you might be able to consider to start buying back from here. with a minimum target of 15%+
XVGUSDT 1WXVG ~ 1W
#XVG So far it continues to maintain its bullish structure. Buy when retesting this Golden Ratio,. Minimum target 20%+

XVG / USDT : Preparing for a breakout Above trendline resistanceXVG/USDT: Preparing for a Breakout Above Trendline Resistance
XVG/USDT is gearing up for a potential breakout 📈 as it approaches a key trendline resistance zone 📊. The price has been consolidating tightly, creating a promising setup for an explosive move 💥. If the breakout materializes, we could witness a strong bullish trend emerge 🚀. Keep this pair on your radar 👀 and wait for confirmation before taking action.
Key Insights:
1. Trendline Resistance: XVG/USDT is nearing a long-standing trendline that has acted as a significant barrier. A break above this level could signal the start of a robust upward trend.
2. Volume Surge: Monitor trading volume closely; a notable increase during the breakout will confirm buyer strength 🔥.
3. Bullish Indicators: Momentum indicators like RSI and MACD are showing positive trends ⚡, supporting the case for a bullish breakout.
Steps to Confirm the Breakout:
Wait for a clear 4H or daily candle closing above the trendline 📍.
Look for a spike in trading volume during the breakout to validate strong buying pressure 📊.
A retest of the broken resistance as a new support zone will enhance the credibility of the move ✅.
Stay cautious of fake breakouts marked by sudden reversals or wicks above the trendline ⚠️.
Risk Management Strategies:
Use stop-loss orders to protect your capital effectively 🔒.
Ensure your position sizing aligns with your broader trading strategy 🎯.
This analysis is for educational purposes only and is not financial advice. Always conduct your own research (DYOR) 🔍 before making investment decisions.

XVG/USDT PlanXVG/USDT Plan
XVG/USDT is approaching a key resistance level, and the chart is shaping up for a potential breakout. The price is gradually gaining momentum 📈, and this setup looks promising for a bullish move if confirmed.
Keep an eye on the following:
- The current resistance zone needs to be broken. A successful breakout could lead to a strong move upward 🔑.
- Watch for increased trading volume during the breakout to confirm buyer strength 🔥.
- Momentum indicators like RSI and MACD are turning bullish, signaling potential upside ⚡.
Tips:
- Wait for a clear 4H or daily candle close above the resistance before entering the trade 📍.
- A retest of the broken resistance as a support zone provides a safer entry point ✅.
- Manage your risk carefully with a tight stop-loss below the resistance level 🔒.
Targets:
- First target:
- Second target:
Always trade responsibly and DYOR 🔍. Let’s see how this plays out! 🚀

#XVGAfter suffering for a while in the specified range, now, if the 38 pullback range hits, a bullish pump can continue to the specified area, otherwise it will break the trading floor of the range.

XVG / XVGUSDTGood Luck >>
• Warning •
Any deal I share does not mean that I am forcing you to enter into it, you enter in with your full risk, because I'll not gain any profits with you in the end.
The risk management of the position must comply with the stop loss.
(I am not sharing financial or investment advice, you should do your own research for your money.)


XVGUSDT : NICE LONG SETUPHi Bro,
XVGUSDT I recommend to you the situation to trade but please check by yourself and get confirmation in low-time frame and do your best.
SecondChanceCrypto
⏰ 6/August /23
⛔️DYOR
Always do your research.
If you have any questions, you can write them in the comments below and I will answer them.
And please don't forget to support this idea with your likes and comments.

XVGUSDTXVGUSDT is in under strong sell pressure and has created strong demand zone with bullish divergence. These confluences giving the strong buy setup signals. What you guys think of it ?

Verge (XVG) formed bullish BAT for upto 41% pumpHi dear friends, hope you are well and welcome to the new trade setup of Verge (XVG) coin.
Previously we caught a nice trade of XVG as below, and after a quite long-time I am sharing the next trade plan for XVG.
Now on a 4-hr time frame, XVG has formed a bullish BAT move for the next price reversal move.
Note: Above idea is for educational purpose only. It is advised to diversify and strictly follow the stop loss, and don't get stuck with trade

XVG Long OpportunityXVG Long Opportunity check it up check it up check it up check it up check it up check it up

XVGUSDT, Its amazing ...Hello everybody
Whats up guys ?
We finally show one of our coin in portfolio that we are speaking about it, Mr.Abtin is one the Verge maximalist trader.
If you want to learn Fundamental & Technical analysis send us messages ---> Our id is in profile
(Only for 48hours you can buy any package with 51% discount)
According to the chart, we shown the trend of the market and now as you can see the last rally that made now Wave A and B was completed and we expect the price should reach to the PRZ Level that we shown on chart and in there zone Wave C can be completed and it can be the point of swing for change trend.
The price can rise up to 0.018$ and after that can be drop and reach to the PRZ Level.
If you have any question send us messages
Good Luck
Abtin
XLong

💡Don't miss the great buy opportunity in XVGUSD @vergeTrading suggestion:
". There is a possibility of temporary retracement to the suggested support line (0.02348).
. if so, traders can set orders based on Price Action and expect to reach short-term targets."
Technical analysis:
. XVGUSD is in a range bound, and the beginning of an uptrend is expected.
. The price is below the 21-Day WEMA, which acts as a dynamic resistance.
. The RSI is at 57.
Take Profits:
TP1= @ 0.02521
TP2= @ 0.02777
TP3= @ 0.02975
TP4= @ 0.03243
TP5= @ 0.03481
SL= Break below S2
❤️ If you find this helpful and want more FREE forecasts in TradingView
. . . . . Please show your support back,
. . . . . . . . Hit the 👍 LIKE button,
. . . . . . . . . . Drop some feedback below in the comment!
❤️ Your support is very much 🙏 appreciated!❤️
💎 Want us to help you become a better Forex / Crypto trader?
Now, It's your turn!
Be sure to leave a comment; let us know how you see this opportunity and forecast.
Trade well, ❤️
ForecastCity English Support Team ❤️

💡Don't miss the great buy opportunity in XVGUSD @vergeTrading suggestion:
". There is a possibility of temporary retracement to the suggested support line (0.02348).
. if so, traders can set orders based on Price Action and expect to reach short-term targets."
Technical analysis:
. XVGUSD is in a range bound, and the beginning of an uptrend is expected.
. The price is below the 21-Day WEMA, which acts as a dynamic resistance.
. The RSI is at 55.
Take Profits:
TP1= @ 0.02521
TP2= @ 0.02777
TP3= @ 0.02975
TP4= @ 0.03243
TP5= @ 0.03481
SL= Break below S2
❤️ If you find this helpful and want more FREE forecasts in TradingView
. . . . . Please show your support back,
. . . . . . . . Hit the 👍 LIKE button,
. . . . . . . . . . Drop some feedback below in the comment!
❤️ Your support is very much 🙏 appreciated! ❤️
💎 Want us to help you become a better Forex / Crypto trader ?
Now, It's your turn !
Be sure to leave a comment; let us know how you see this opportunity and forecast.
Trade well, ❤️
ForecastCity English Support Team ❤️

On the Verge of a new move4H bearish market structure; however, still bullish on the daily. General market correction might have lead to this.
It came down to the liquidity zone and fell perfectly into the golden FIB pocket. It has reclaimed the 200EMA and is looking to form a bullish cross on the MACD.
There is also the possibility of a head & shoulders pattern forming.
Things to look out for:
- Still trading below the 50EMA
- Could continue bearish 4H structure
What are your thoughts on this?

Xvg AnalysisXVG having a trend suppor t and moving in symmetrical triangle .
It going to break fib resistanc e when it break it also break triangle pattern .
Book profit according to Fib resistance
Mid term target - 0.3777$

XVGUSDT Daily TimeframeSNIPER STRATEGY (new version)
It works ALMOST ON ANY CHART.
It produces Weak, Medium and Strong signals based on consisting elements.
NOT ALL TARGETS CAN BE ACHIEVED, let's make that clear.
TARGETS OR ENTRY PRICES ARE STRONG SUPPORT AND RESISTANCE LEVELS SO THEY CAN ACT LIKE PIVOT POINTS AND REVERSE THE WAVE (or act like a mirror that can reflects light) BASED ON STRENGTH OF THAT LEVEL.
ENTRY PRICE BLACK COLOR
MOST PROBABLE SCENARIOS TARGETS GREEN COLOR
LEAST PROBABLE SCENARIOS TARGETS RED COLOR
TARGETS ARE NOT EXACT NUMBERS THEY ARE MORE LIKE A ZONE.
DO NOT USE THIS STROTEGY FOR LEVERAGED TRADING.
It will not give you the whole wave like any other strategy out there but it will give you a huge part of the wave.
The BEST TIMEFRAMES for this strategy are Daily, Weekly and Monthly however it can work on any timeframe.
Consider those points and you will have a huge advantage in the market.
There is a lot more about this strategy.
It can predict possible target and also give you almost exact buy or sell time on the spot.
I am developing it even more so stay tuned and start to follow me for more signals and forecasts.
START BELIEVING AND GOOD LUCK
HADIMOZAYAN
