#XVS/USDT – Accumulation Nearing Its End, Major Breakout?#XVS
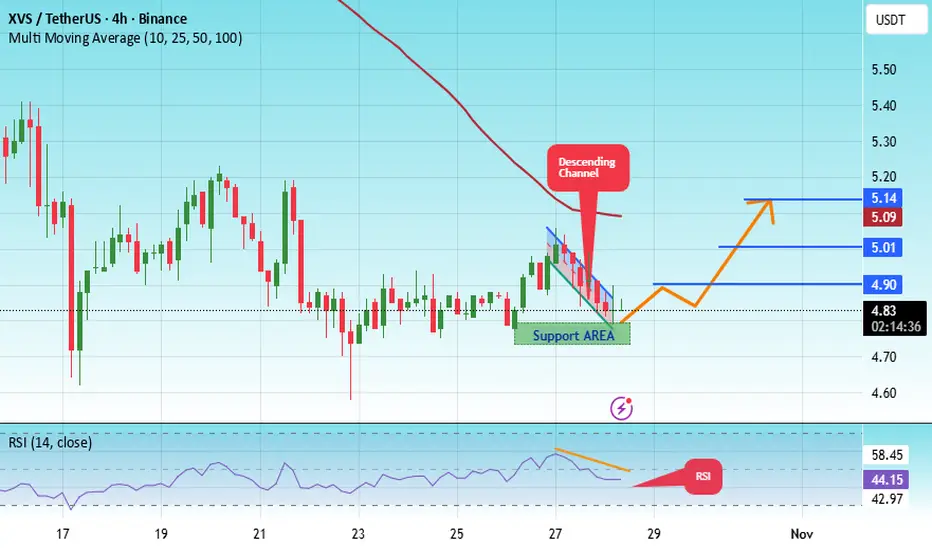
The price is moving in an ascending channel on the 1-hour frame, adhering well to it, and is heading for a strong breakout and retest.
We have a bearish trend on the RSI indicator that is about to be broken and retested, which supports the upward breakout.
There is a major support area in green at 4.77, representing a strong support point.
We are heading for consolidation above the 100 moving average.
Entry price: 4.80.
First target: 4.90.
Second target: 5.01.
Third target: 5.14.
Don't forget a simple matter: capital management.
When you reach the first target, save some money and then change your stop-loss order to an entry order.
For inquiries, please leave a comment.
Thank you.
Xvsidea
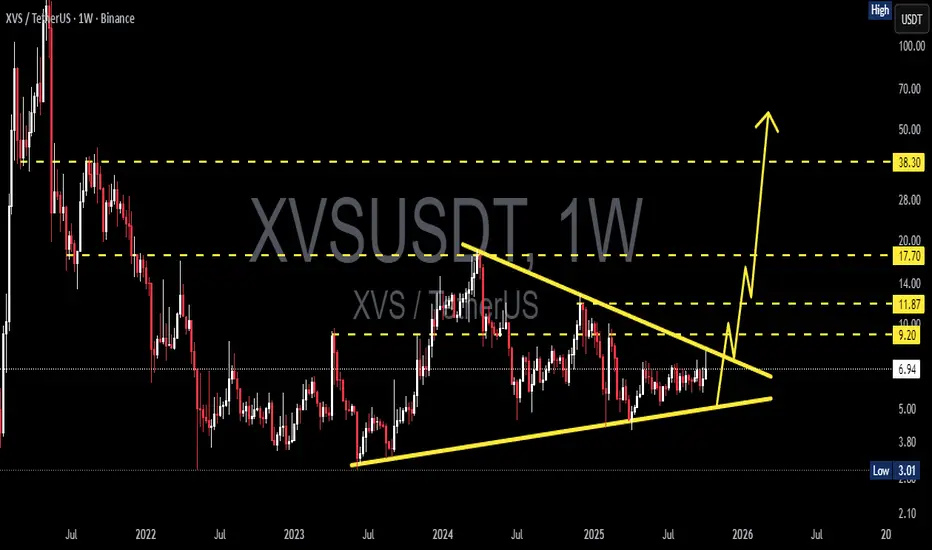
XVS/USDT – Accumulation Nearing Its End, Major Breakout?For over two years, XVS/USDT has been locked inside a massive multi-year accumulation phase, forming a clear Symmetrical Triangle pattern on the weekly timeframe.
Each move has been creating higher lows and lower highs, showing a tightening range and volatility compression — a classic setup before a major expansion phase begins.
Now, price action is once again testing the apex area of the triangle, suggesting that a decisive breakout is approaching.
This type of structure often precedes powerful reversals or trend continuations, depending on which direction the breakout confirms.
---
📈 Bullish Scenario
Breakout Confirmation: A weekly close above the descending trendline (around 7.0–9.2) with strong volume expansion.
Once confirmed, the medium-term targets are 11.87 → 17.70 → 21.60, with a possible extended rally toward 38.30 if broader market sentiment turns bullish.
The structure suggests that buyers have been quietly accumulating — and when this compression releases, momentum could accelerate quickly.
💡 Interesting Note: The longer a triangle forms, the stronger the breakout potential.
XVS has been building this base for over 100 weeks, indicating a significant amount of pent-up energy waiting to be released.
---
📉 Bearish Scenario
Failure to break above resistance followed by a weekly close below the rising trendline (~5.0) would shift momentum bearish.
Downside targets sit near 3.8 – 3.01, which represents the final historical demand zone.
A confirmed breakdown below 3.0 could invalidate the structure and potentially extend the downtrend further.
---
🔍 Pattern Analysis & Interpretation
Pattern Type: Symmetrical Triangle — a sign of prolonged accumulation and tightening market pressure.
Meaning: Such structures often mark a pivotal transition zone between accumulation and expansion.
Volume: Watch for a clear increase in trading volume during the breakout; without it, false breakouts are common.
---
🧭 Summary
XVS is entering a critical decision zone after years of sideways action.
A confirmed breakout above 9.2 could trigger the next major bullish cycle, while a breakdown below the lower boundary would confirm renewed weakness toward long-term support.
This is not just another consolidation — it’s a battle between accumulation and distribution, and its resolution could define XVS’s direction into 2026 and beyond.
---
#XVS #XVSUSDT #CryptoAnalysis #AltcoinBreakout #DeFi #TechnicalAnalysis #SymmetricalTriangle #CryptoChart #CryptoSetup #AccumulationPhase #CryptoMarket #BullishSetup
#XVS/USDT Go UP for 15% ?#XVS
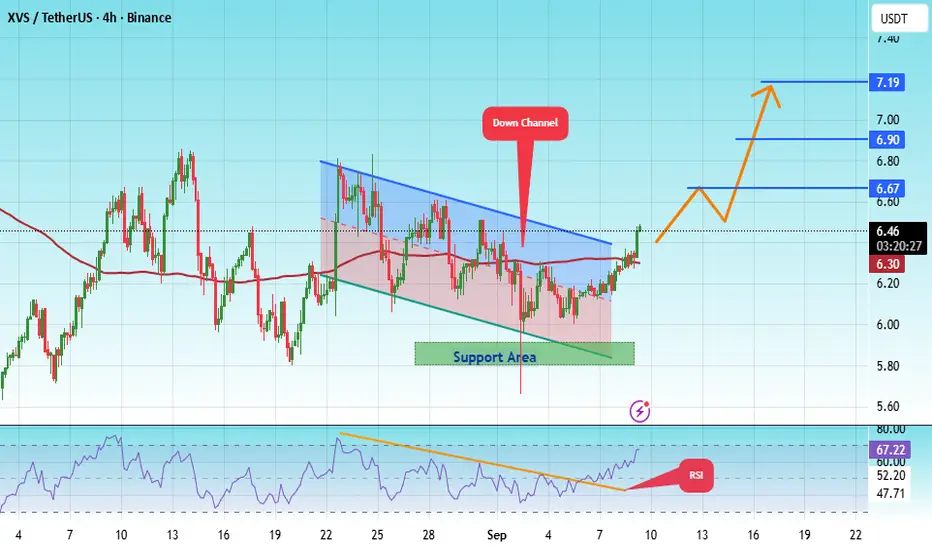
The price is moving within a descending channel on the 4-hour frame, adhering well to it, and is heading for a strong breakout and retest.
We have a bearish trend on the RSI indicator that is about to be broken and retested, which supports the upward breakout.
There is a major support area in green at 5.86, representing a strong support point.
For inquiries, please leave a comment.
We are in a consolidation trend above the 100 Moving Average.
Entry price: 6.46
First target: 6.67
Second target: 6.90
Third target: 7.19
Don't forget a simple matter: capital management.
When you reach the first target, save some money and then change your stop-loss order to an entry order.
For inquiries, please leave a comment.
Thank you.
#XVS/USDT#XVS
The price is moving within a descending channel on the 1-hour frame, adhering well to it, and is heading for a strong breakout and retest.
We are seeing a bounce from the lower boundary of the descending channel, which is support at 5.75.
We are seeing a downtrend on the RSI indicator that is about to break and retest, supporting the upward trend.
We are looking for stability above the 100 Moving Average.
Entry price: 5.95
First target: 6.07
Second target: 6.25
Third target: 6.46

#XVS/USDT#XVS
The price is moving in a descending channel on the 1-hour frame and is expected to continue upwards
We have a trend to stabilize above the moving average 100 again
We have a descending trend on the RSI indicator that supports the rise by breaking it upwards
We have a support area at the lower limit of the channel at a price of 7.00
Entry price 7.31
First target 7.75
Second target 8.09
Third target 8.51

XVSUSDT | High PotentialThe blue boxes on the XVS chart represent strong demand zones, especially when analyzed on higher time frames (HTF).
While price may dip lower within these zones, they offer potential for quick reactions and short-term opportunities, making them ideal for scalping or intraday trades. For HTF traders, deeper entries can be targeted at lower levels for more substantial long positions.
Balancing between immediate reactions and a long-term perspective allows flexibility in capturing both short-term gains and larger moves within the broader trend.
Spot buys will be a safer choice here.
I keep my charts clean and simple because I believe clarity leads to better decisions.
My approach is built on years of experience and a solid track record. I don’t claim to know it all, but I’m confident in my ability to spot high-probability setups.
My Previous Analysis
🐶 DOGEUSDT.P: Next Move
🎨 RENDERUSDT.P: Opportunity of the Month
💎 ETHUSDT.P: Where to Retrace
🟢 BNBUSDT.P: Potential Surge
📊 BTC Dominance: Reaction Zone
🌊 WAVESUSDT.P: Demand Zone Potential
🟣 UNIUSDT.P: Long-Term Trade
🔵 XRPUSDT.P: Entry Zones
🔗 LINKUSDT.P: Follow The River
📈 BTCUSDT.P: Two Key Demand Zones
🟩 POLUSDT: Bullish Momentum
🌟 PENDLEUSDT: Where Opportunity Meets Precision
🔥 BTCUSDT.P: Liquidation of Highly Leveraged Longs
🌊 SOLUSDT.P: SOL's Dip - Your Opportunity
🐸 1000PEPEUSDT.P: Prime Bounce Zone Unlocked
🚀 ETHUSDT.P: Set to Explode - Don't Miss This Game Changer
🤖 IQUSDT: Smart Plan
⚡️ PONDUSDT: A Trade Not Taken Is Better Than a Losing One
💼 STMXUSDT: 2 Buying Areas

XVSUSDT: Eyeing a Breakout with Strong VolumeXVSUSDT is showing positive volume momentum and increasing buyer strength. The current price action is approaching a critical resistance level, and a breakout could pave the way for a significant move.
Key Levels to Watch:
Resistance Break: A confirmed break above the resistance may signal the start of a bullish trend.
Stop Level: My stop-loss is set at $11.1, ensuring risk management in case of a pullback.
Why XVS Stands Out:
The combination of rising volume and buyer power suggests strong accumulation, making XVS a promising candidate for a potential breakout.
Let’s see how this unfolds—patience and discipline remain key!
I keep my charts clean and simple because I believe clarity leads to better decisions.
My approach is built on years of experience and a solid track record. I don’t claim to know it all, but I’m confident in my ability to spot high-probability setups.
My Previous Analysis
🐶 DOGEUSDT.P: Next Move
🎨 RENDERUSDT.P: Opportunity of the Month
💎 ETHUSDT.P: Where to Retrace
🟢 BNBUSDT.P: Potential Surge
📊 BTC Dominance: Reaction Zone
🌊 WAVESUSDT.P: Demand Zone Potential
🟣 UNIUSDT.P: Long-Term Trade
🔵 XRPUSDT.P: Entry Zones
🔗 LINKUSDT.P: Follow The River
📈 BTCUSDT.P: Two Key Demand Zones
🟩 POLUSDT: Bullish Momentum
🌟 PENDLEUSDT: Where Opportunity Meets Precision
🔥 BTCUSDT.P: Liquidation of Highly Leveraged Longs
🌊 SOLUSDT.P: SOL's Dip - Your Opportunity
🐸 1000PEPEUSDT.P: Prime Bounce Zone Unlocked
🚀 ETHUSDT.P: Set to Explode - Don't Miss This Game Changer
🤖 IQUSDT: Smart Plan

Crack the code of XVS with XABCD!XVS Coin (Venus Coin) Chart Characteristics
Volatility:
XVS, like many other altcoins, exhibits high volatility, especially during periods of increased market activity or when Venus protocol-related updates are released.
Sharp price spikes and dips are common, making it an ideal candidate for pattern-based trading.
Trend Behavior:
XVS often moves in trends driven by broader market sentiment, such as Bitcoin price movements, or specific news related to DeFi and the Venus ecosystem.
It tends to form strong rallies during bullish cycles but can also experience steep corrections.
Volume Patterns:
Trading volumes can be irregular, often spiking during significant announcements or broader market rallies.
High volume during breakout points or pattern completions can confirm price movements.
Support and Resistance:
XVS charts often show well-defined support and resistance levels, which align with Fibonacci retracement or extension levels.
These levels play a crucial role in identifying potential XABCD patterns.
XABCD Pattern Characteristics
The XABCD pattern is a harmonic trading pattern used to identify potential reversal zones. It includes various specific patterns, such as Gartley, Bat, Butterfly, and Crab, each with unique Fibonacci ratios. Here’s a breakdown:
Structure:
The XABCD pattern consists of five points (X, A, B, C, D) that form four legs (XA, AB, BC, CD). These legs follow Fibonacci ratios to define the pattern.
Each variation (e.g., Gartley or Butterfly) has distinct Fibonacci retracements and extensions.
Key Elements:
XA: The initial move in price, which sets the foundation for the pattern.
AB: A retracement of the XA leg, typically around 38.2% to 61.8% of XA.
BC: A secondary retracement, often 38.2% to 88.6% of AB.
CD: The final leg, extending beyond BC, with specific Fibonacci targets depending on the pattern.
Types of Patterns:
Gartley: Features a deep retracement (61.8%) of the XA leg and a completion point at D near 78.6%.
Bat: Similar to the Gartley but with a shallower AB retracement and D completing at 88.6%.
Butterfly: Extends beyond XA, with the D point reaching a 127.2% or 161.8% extension.
Crab: Features an extreme extension of the XA leg, with the D point reaching a 161.8% or beyond.
Confirmation:
A valid XABCD pattern should align with Fibonacci levels. Traders often wait for price action or other indicators (like RSI divergence) to confirm the reversal.
Applying XABCD Patterns to XVS Coin
When trading XVS using XABCD patterns:
Look for clear impulsive and corrective waves that align with the pattern's structure.
Use Fibonacci tools to verify retracements and extensions.
Confirm potential reversal zones (PRZ) near the D point with additional signals like volume spikes or momentum divergence.
Monitor support/resistance zones for added confluence with pattern completion.
This approach allows you to predict potential reversals or continuations in XVS price, offering well-defined risk-reward opportunities.
I keep my charts clean and simple because I believe clarity leads to better decisions. Trading doesn’t have to be overly complicated, and I enjoy sharing setups that have worked well for me.
My approach is built on years of experience and a solid track record. I don’t claim to know it all, but I’m confident in my ability to spot high-probability setups. It’s all about learning and growing together as traders, and I’m here to share what I see.
The markets can confirm what the charts whisper if we’re paying attention. I hope these levels help you as much as they’ve helped me in the past. Let’s see how this plays out!
My Previous Hits
🐶 DOGEUSDT.P: Next Move
🎨 RENDERUSDT.P: Opportunity of the Month
💎 ETHUSDT.P: Where to Retrace
🟢 BNBUSDT.P: Potential Surge
📊 BTC Dominance: Reaction Zone
🌊 WAVESUSDT.P: Demand Zone Potential
🟣 UNIUSDT.P: Long-Term Trade
🔵 XRPUSDT.P: Entry Zones
🔗 LINKUSDT.P: Follow The River
📈 BTCUSDT.P: Two Key Demand Zones
🟩 POLUSDT: Bullish Momentum

XVSUSD 1WXVS ~ 1W 📈
#XVS Make purchases gradually from here. We estimate that this resistance will be broken in the near future. minimum target 20%++

XVS high Potential...XVS is Fundamentally and Technically in a good point to be in investment watchlist...
Please Do Your Own Research (DYOR) before taking action...

XVS WILL BE A WAKE SOONTHIS IS WHAT I THINK ABOUT THIS SLEEPING GIANT. Please let me know what do u think.


Venus XVS Caution! Roller coaster is not for the faint of heart!Venus (XVS) is an algorithmic money market and synthetic stablecoin protocol launched exclusively on Binance Smart Chain (BSC).
The combination of Defi project + binding to Binance gave a good result, the price of XVSUSDT increased from $2 to almost $150
But the real roller coaster for traders happened on May 18-19, then the price for 2 hours increased from $80 to $140 . (Against the background of purchases to get a new VRT reward token) and already during May 19, the price of XVSUSD fell from $140 to $32. Only spot traders could survive such a ride, while the deposits of marginals were confidently multiplied by 0.
Tonight, against the background of the BTC shot up, the price of XVS also showed an increase, although much better +50%
Such volatility is very dangerous to trade on a margin account, only on a spot.
By the way, the white route from our idea BTCUSDT worked pretty well
The weekly candle has worked out almost all its growth potential in a day
Let's define the key levels:
To continue the upward rally, the XVSUSDT price needs to be corrected, at least up to $20
The first target for growth is $35, if it is easily overcome, then hello $59-60.
Correction: here we will have to look at how powerful the growth will be and what the overall situation will be in the crypto market.
However, based on the current data, we believe that in the future it will be possible to place buckets for purchases on the spot in the liquidity zone of $10-11 . What if we get lucky and pour it, who knows what they have prepared for us in the future)
_____________________
Since 2016 , we have been analyzing and trading the cryptocurrency market.
We transform our knowledge, trading moods and experience into ideas. Each "like under the idea" boosts the level of our happiness by 0.05% . If we help you to be calmer and richer - help us to be happier :)

XVS In Neutral Zone , Buy After Breakout #XVS 1D Chart Analysis... Most Requested
After A Big XVS Goes 85% Down From It's All Time High. After A Long Corretion XVS Goes Below It's Strong Support Zone. After That XVS Created A Bullish Engulfing Candlestick & Closed Above Support Zone. But Next Couple Of Daily Candle Tried To Close Above The Bullish Engulfing Candelistick High. Serially All 4 Candles Failed To Close Above The Bullish Candle. Now We Are In Sideways Until It's Close Above or Below The Bullish Candle. That's It ... I Will Suggest Don't Take Entry Without Breakout.


XVS CAN TOCH NEW ATHIf the price can break the resistance level of $ 90 and stabilize in the lower time frames above this price, we can have a good buy...
However, we also pay attention to bitcoin price fluctuations and dominance movements...


XVSUSDT Chill Down IncomingXVS had a great run to $56, now its tired legs must chill.
Descending triangle inbound.
Volume giving expected markers
MACD collision in sight
Support at various Fibonacci level, strong at 618-fib. Watch the area for buyers.
Sellers enjoy the ride
How low can we go, depends an how strong sellers are.
XVS is DeFi on the Binance Smart Chain, promising coin.
Like and Share your thoughts or opinion.
