Possible movement of the yen, the world's second safest assetThe hourly chart gives us a bearish view.
We have good Fibonacci areas and a good gap on the 4-hour timeframe as support areas ahead and the overbought indicator also shows confirmation. RSI
A suggested position has been drawn. Money management and risk-reward ratio are the secrets to success in this market. Good luck.
Yen

AUDJPY SellReasons for short:
The price hit the channel upper side and seems to fail to make a higher high.
Potential forming double top pattern

SHORT ON AUD/JPYAUD/JPY has made a pullback to a major supply area while also mitigating a FVG (fair value gap) in the same zone.
Jpyx index has major potential to rise. I expect AJ to fall and from this zone.
Looking to make 200-300 pips throughout the week.

Fifth straight gain for USDJPY - can bulls clear 153 before CPI?USD/JPY is advancing for a fifth consecutive day after the ruling LDP confirmed Sanae Takaichi as its new leader. Traders are preparing for possible increased fiscal spending, and this is weighing on the yen.
However, upward momentum could be tested later this week ahead of the US CPI release on Friday.
Momentum indicators remain constructive for now, with the RSI holding above 60 and price action potentially supported by the rising 20-day moving average near 150.40.

USD/JPY turns lowerFollowing the overnight gains, the USD/JPY has now turned negative on the day after failing to hold above Friday's hammer candle. The pair hit resistance around the 151.00 level, and has now fallen below the head of the hammer candle from Friday's range at 150.64. Short-term bias bearish now while it holds below 150.64. Next target for bears is 150.0 and then liquidity below Friday's range at 149.37. If the selling gathers momentum, then why stop there? Why not dip back to 148.00 where 200 day meets trend line?
Fundamentally, the yen has been caught between a hawkish leaning BOJ and dovish fiscal expectations following the Japanese parliamentary vote last week where hard-line conservative Sanae Takaichi is almost certain to become Japan’s first female prime minister. It is worth keeping a close eye on Japanese markets. The yen could rally if BoJ hawks become more vocal again, which is what I would be expecting.
By Fawad Razaqzada, market analyst with FOREX.com

yen and improve power !#USD-Yen
Given the current scenarios, my personal opinion is that the Yen is strengthening due to the heavy gap down, the downtrend line, the nearby resistance and of course the strength of #Gold.
Of course, I definitely won't enter without confirmation.

what about USDJPY ?It has returned from the golden Fibo zone (0.5 - 0.618) and is supported. It is true that we have a gap above and below the price, but the upward force is greater.

SHORT ON USD/JPYUJ has retest a supply zone and is ready for a great sell opp.
I am selling UJ looking to make 300-400 pips.

SHORT ON GBP/JPYGJ has given us a nice retest back to the supply zone from were price previously took off.
I will be selling GJ to the next demand zone looking to catch 300-400+ pips.

USD/JPY: Bearish Bias Remains Despite 1-Hour Triangle Break RiskA small symmetrical triangle has formed on the 1-hour chart, suggesting an upside break could be pending. However, with the elongated bearish engulfing candle that appeared on Friday after an extended move, I suspect any rally from here may be limited.
Bears could look to fade into moves towards the 153 handle and maintain a bearish bias while prices remain beneath Friday’s high. The bias is for an eventual move down to the March high (151.30), near the weekly pivot point (151.14). A break beneath the 150.32 high would imply a deeper retracement for USD/JPY and bring the 150.00 handle and 150.33 high-volume node into focus.
Matt Simpson, Market Analyst at City Index and Forex.com.

The resurgence of safe assets#Dollar_Yen
Technical: Golden Fibonacci Retracement Zone + Last Week's Market Gap + Good Reaction to High Resistance + Ceiling and Confirmation Candles.
Fundamental: Tensions between the two economic poles of the world #America and #China again push capital towards safe assets #Gold and #Yen
Conclusion: I have a view towards the growth of gold and the decline of the dollar-yen currency pair.
#Personal Opinion

SELL USDJPYJPY hass been on the heat recently, big spike and gap. However we are seeing a selling opportunity based off our strategy. Sell from current level 152.443 and more entries at 153.078 and stops above 153.886 and targets below the gap 145.81. Use your own risk management and risk what you can afford. Best of luck.

NZDJPY – Retesting Upper Channel: Looking for Shorts!NZDJPY remains inside a falling channel on the 4H.
Price just spiked back into the upper trendline / supply (87.40–87.80), where sellers have reacted before.
As long as this red zone holds, I’ll look for lower-high + break-of-structure sell setups toward 86.30, then the 85.40–85.00 channel low.
A clean 4H close above ~88.00 would invalidate the idea and open room for 88.70–89.00.
⚠️ Disclaimer: This is not financial advice. Always do your own research and manage risk properly.
📚 Stick to your trading plan regarding entries, risk, and management.
Good luck! 🍀
All Strategies Are Good; If Managed Properly!
~Richard Nasr

No more rate hikes from the BoJ?The USDJPY started the week with a massive gap of 191 pips.
This was following news that Sanae Takaichi was on the verge of being the first female Prime Minister of Japan.
As a keen advocate of Abenomics (the nickname for the economic policies set out for Japan in 2012 when Prime Minister Shinzo Abe came into power for a second time), it is believed that Takaichi could double down on Abenomics of the past.
A weaker yen, more government spending, and more inflation are the likely outcomes. And the immediate reaction of a gap to the upside on the USDJPY shows that the market agrees too.
Furthermore, Takaichi's advisors have already urged the BoJ to be careful with rate hikes.
However, prices are still slightly below the immediate resistance area formed by the previous swing level of 150.75 and the long-term Fibonacci retracement level of 61.8% and the price level of 151.67.
A break of the resistance area could potentially result in significant upside to the USDJPY. Maybe even retesting the January 2025 high of 159.
However, a continual move to the upside is unlikely to be achieve just based on Yen weakness. A recovery of strength in the DXY would be necessary to support the move higher.

Why I have USD/JPY Falling Below 139.5 On My Bingo CardUSD/JPY traders have been treated (or perhaps burned) from two months of choppy trade, reversals and false breakouts. Yet price action clues and developments from the Fed and BOJ have allowed me to revisit my original thesis of a lower USD/JPY. I now have a break below 139.50 on my bingo card.
Matt Simpson, Market Analyst at City Index.

Exness: Japanese Yen Hawkish Shift Intertwined with Fed Rate CutExness: Japanese Yen Hawkish Shift Intertwined with Fed Rate Cut Expectations: What Lies Ahead?
The signals from the Bank of Japan's policy meeting on September 18-19 mark a potential turning point. Although the decision was made to keep the policy interest rate at 0.5% with a 7-2 vote, the internal details revealed growing hawkish pressure. Policy board members Hajime Takata and Naoki Tamura voted against maintaining the interest rate, advocating for an immediate 25 basis point hike to 0.75%. This is the first dissenting vote since Governor Kazuo Ueda took office, clearly indicating a growing call for tighter policy within the central bank.
Even more surprisingly, the Bank of Japan simultaneously announced that it would begin preparations to sell its holdings of exchange-traded funds (ETFs) and Japanese Real Estate Investment Trusts (J-REITs). Although the planned pace of sales is relatively modest, this is seen as a substantive step towards policy normalization, with its signaling significance far outweighing its actual market impact.
The "Summary of Opinions" from the September meeting, just released today (September 30), provides decisive evidence of this hawkish shift. The document shows that there was a serious and in-depth debate within the policy board on the "possibility of a near-term rate hike." Several members believed that the conditions for another rate hike were maturing, with one opinion explicitly stating, "Given that it has been more than six months since the last rate hike, perhaps it is time to consider raising the policy interest rate again." Even Asahi Noguchi, a deliberation committee member usually considered dovish, stated in a speech on September 29 that the necessity of adjusting the policy interest rate is "greater than ever."
This series of signals quickly reshaped market expectations. Currently, market pricing reflects that the probability of the Bank of Japan raising rates by 25 basis points at its next meeting on October 29-30 has surged to about 60%.
In stark contrast to the Bank of Japan's increasingly firm stance, the Federal Reserve is on a clear path of easing, primarily driven by concerns about a cooling US labor market. Key inflation data released last week on September 26 further solidified this expectation.
Data shows that the Federal Reserve's most favored inflation indicator, the core Personal Consumption Expenditures (PCE) (Chart 1) price index for August, increased by 2.9% year-on-year, remaining consistent with July and fully meeting market expectations. This "as expected" report is widely interpreted by the market as "non-threatening" inflation, suggesting it will not hinder the Federal Reserve's interest rate cuts and instead bolsters investor confidence in future rate reductions.
The Tug-of-War Between Inflation and Growth
The fierce debate within the Bank of Japan between hawks and doves stems from the contradictory signals sent by Japan's domestic economic data. On the one hand, persistently above-target inflation provides a reason for raising interest rates; on the other hand, recent signs of slowing growth call for the central bank to remain cautious. This tug-of-war between inflation and growth makes the Bank of Japan's decision-making path full of uncertainty.
Inflation Outlook: The Hawks' Confidence
Hawkish officials who support interest rate hikes primarily base their arguments on persistent inflationary pressures in Japan. The national core Consumer Price Index (CPI) (Chart 2) for August, released on September 18th, rose by 2.7% year-on-year. Although this is a slowdown from July's 3.1%, it marks the 29th consecutive month that this data has been above the Bank of Japan's 2% target.
What is even more noteworthy is that the "Core-Core CPI", which excludes fresh food and energy and is regarded by the Bank of Japan as a measure of underlying inflation trends, remained stubbornly high at 3.3% in August. This persistent underlying price pressure is the core argument for hawkish members who believe the inflation target has been "largely achieved." In addition, the Tokyo core CPI for September (released on September 25), which is a leading indicator for national inflation, remained stable at 2.5% year-on-year, further indicating that inflationary pressures are not rapidly dissipating.
Growth Outlook: Dovish Concerns
However, just when the hawkish arguments seemed fully substantiated, the latest series of economic activity data released this week cast a shadow over the outlook, providing strong support for a dovish, cautious stance.
Data released on September 29th and 30th showed that preliminary industrial output for August decreased by 1.2% month-on-month (Chart 3), significantly worse than the market expectation of -0.8% and also weaker than the previous figure of -0.4%. This indicates that production activities are contracting in manufacturing, a crucial pillar of the Japanese economy, possibly due to the negative impact of US tariff policies and a slowdown in global demand.
At the same time, retail sales data for August, a key indicator of domestic demand, was also disappointing.
This data unexpectedly fell by 1.1% year-on-year, a significant departure from market expectations of a 1.0% increase; it even saw a substantial 1.6% month-on-month decrease. This clearly indicates that Japanese household consumption power is being eroded, and domestic demand is beginning to show weakness, against a backdrop of inflation consistently higher than wage growth.
In addition, the preliminary Manufacturing Purchasing Managers' Index (PMI) (Chart 4) for September fell to 48.4, marking the fastest contraction in six months and further confirming the downward pressure on the economy.
From a technical perspective, USD/JPY is at a critical crossroads. Recent price movements show a fierce struggle between bulls and bears around important technical levels, reflecting fundamental uncertainties. USD/JPY failed to reach the key 150.00 level, then fell back below 149.00 and the EMA21. The price is still fluctuating within the 148.00-149.00 range, indicating possible consolidation. If it stays below 149.00, the price may consolidate further within the 148.00-149.00 range. Conversely, if it returns above the EMA21 and 149.00, it may retest the key 150.00 level.
Integrating the above fundamental and technical analysis, a core conclusion can be drawn: the previous one-sided short-yen trading environment has ended. The market is entering a new phase that is more balanced but potentially significantly more volatile.
The movement of USD/JPY is no longer dominated by a single factor, but depends on the interplay between the hawkish potential of the Bank of Japan and the dovish reality of the Federal Reserve. The short-term direction of the exchange rate will be determined by which central bank's actions (or inactions) surprise the market more.
The future path will be largely determined by two key economic data releases scheduled for this week:
Japan Tankan Survey (October 1): Can this report give the Bank of Japan's hawks enough confidence to act in October?
US Non-Farm Payrolls (October 3): Will this data confirm the weakening of the US labor market, thereby "paving the way" for the Federal Reserve's rate cut path?
The outcome of these two events will likely determine whether USD/JPY breaks key support and tests lower levels, or whether it can hold its ground here and gather strength to challenge the strong resistance area of 150 again.
In any case, what is certain is that the era of one-sided yen depreciation is over, and a new phase full of strategic reassessment and uncertainty has arrived.
By: Eric Chia, Financial Market Strategist at Exness

Fundamental Market Analysis for October 1, 2025 USDJPYThe summary of opinions from participants at the Bank of Japan (BoJ) meeting in September showed that board members discussed the possibility of raising interest rates in the near future. This confirmed market expectations that the central bank would stick to its policy normalization course. In addition, growing geopolitical tensions and the US government shutdown may continue to provide some support for the Japanese yen (JPY) as a safe-haven currency, which in turn could be a headwind for the USD/JPY pair.
Meanwhile, the BoJ's stance differs significantly from forecasts that the US Federal Reserve (Fed) will cut borrowing costs twice this year. The latter does not help the US dollar (USD) attract significant buyers. Moreover, the divergence in the policy outlooks of the Bank of Japan and the Fed should favor the lower-yielding Japanese yen and help limit the USD/JPY pair. Therefore, it would be wise to wait for strong follow-through buying before taking a position in anticipation of a significant strengthening.
Trade recommendation: SELL 146.75, SL 147.95, TP 143.95

GBP/JPY Outlook and Elliott Wave AnalysisThe GBP/JPY currency pair is currently trading near critical levels. The Bank of England (BoE) keeps its policy rate steady at 4.00%, providing limited near-term support for the Pound. In contrast, the Bank of Japan (BoJ) maintains rates at 0.50%, but signals of potential future tightening could strengthen the Japanese Yen. This divergence creates downside pressure on GBP/JPY.
From a technical standpoint, according to the Elliott Wave Theory, the GBP/JPY pair has likely completed the final wave C of an ABC corrective structure in a diagonal pattern. This pattern suggests the Japanese Yen could gain short-term strength against the Pound, with the pair potentially pulling back towards 198.00 by 1 October.
In the short term, GBP/JPY may continue to show choppy but downward-biased moves. However, the upcoming 1 October data releases and the BoJ’s policy stance will be crucial. If the Bank of Japan refrains from action, the Pound could regain momentum and drive GBP/JPY higher towards the 201.00 resistance area.

USDJPY: 150 INTERVENTION ZONE BATTLE! BoJ vs Bulls 🚀 USDJPY: 150 INTERVENTION ZONE BATTLE! BoJ vs Bulls 📊
Current Price: 149.521 | Date: Sept 27, 2025 ⏰
📈 INTRADAY TRADING SETUPS (Next 5 Days)
🎯 BULLISH SCENARIO
Entry Zone: 149.20 - 149.60 📍
Stop Loss: 148.80 🛑
Target 1: 150.20 🎯
Target 2: 150.80 🚀
🎯 BEARISH SCENARIO
Entry Zone: 149.80 - 150.20 📍
Stop Loss: 150.50 🛑
Target 1: 148.50 🎯
Target 2: 147.80 📉
🔍 TECHNICAL ANALYSIS BREAKDOWN
📊 KEY INDICATORS STATUS:
RSI (14): 68.7 ⚡ Overbought Territory
Bollinger Bands: Upper Band Rejection 🔥
VWAP: 149.30 - Critical Support 💪
EMA 20: 148.90 ✅ Bullish Trend Intact
Volume: Intervention Fears Rising 📊
🌊 WAVE ANALYSIS:
Elliott Wave: Wave 5 Extension Risk 🌊
Fibonacci Target: 150.50 Danger Zone 🎯
🔄 HARMONIC PATTERNS:
Bearish Bat Forming at 150.00 ✨
ABCD Completion Warning 🔄
⚖️ SWING TRADING OUTLOOK (1-4 Weeks)
🚀 BULLISH TARGETS:
Intervention Zone: 150.00-150.50 🏆
Extended Target: 151.00 🌙
Gann Resistance: 150.25 ⭐
📉 BEARISH INVALIDATION:
Weekly Support: 148.00 ⚠️
Critical Break: 147.00 🚨
🎭 MARKET STRUCTURE:
Trend: Parabolic Extension 💪
Momentum: Intervention Risk 🔥
Wyckoff Phase: Distribution Risk 📈
Ichimoku: Overbought Signals 🟡
🏛️ CENTRAL BANK DYNAMICS:
BoJ Intervention: 150 Trigger Level 🚨
Verbal Warnings: Intensifying 📢
USD Strength: Fed Policy Support 💵
Rate Differential: Widening 📊
⚡ RISK MANAGEMENT:
Max Risk per Trade: 40 pips 🛡️
R:R Ratio: Conservative 1:1.5 ⚖️
Intervention Alert: Above 149.80 📏
🌍 FUNDAMENTAL CATALYSTS:
Fed Hawkishness vs BoJ Dovish 🏦
US Yields Supporting USD 📈
Japan CPI Remaining Low 📊
Tokyo Session High Volatility 🗾
🔥 INTERVENTION WATCH:
BoJ Trigger: 150.00 Level 💥
Historical Pattern: Verbal → Action 📉
Risk/Reward: Deteriorating 📉
⚠️ DANGER ZONE LEVELS:
Intervention Risk: 149.80+ 🚨
Support: 149.00 | 148.50 | 148.00 🛡️
Resistance: 150.00 | 150.50 | 151.00 🚧
🎯 FINAL VERDICT:
USDJPY at CRITICAL 150 BATTLE! 🚀
BoJ intervention risk MAXIMUM! ⚠️
Bulls vs Central Bank showdown! ⚔️
Trade Management: Reduce size near 150! 💰
Alert Level: 149.80 intervention warning! 🚨
---
⚠️ Disclaimer: High intervention risk. Use tight stops. Educational analysis only.
For individuals seeking to enhance their trading abilities based on the analyses provided, I recommend exploring the mentoring program offered by Shunya Trade. (Website: shunya dot trade)
I would appreciate your feedback on this analysis, as it will serve as a valuable resource for future endeavors.
Sincerely,
Shunya.Trade
Website: shunya dot trade
🔔 Follow BoJ Intervention Alerts | 💬 Share Your 150 Strategy

USDJPY is forming a potential bearish Head & Shoulders pattern📊 FX:USDJPY Market Update
FX:USDJPY is forming a potential bearish Head & Shoulders pattern ⚠️
If it breaks the black support line, the first target will be the blue line level 🎯

SHORT ON EUR/JPYEUR/JPY has created a beautiful rising channel (bearish reversal pattern) at a major resistance area/zone.
It has also given us a CHOC (change of character) from up to down on the lower timeframe.
I will be selling EJ looking to make 200-300 pips.
EUR/JPY Bulls Eye breakoutThe euro was the second strongest FX major on Tuesday thanks to a stronger-than-expected ZEW report. it took second place to the Swiss franc, where USD/CHF fell to a 10-year low. Though the weaker yen environment also saw EUR/JPY outperform, and it now appears to be on the cusp of a bullish breakout.
It has a well-established bullish trend on the daily chart, and unless we see a surprise surge of bearish volatility arrive soon, dips could remain favourable for bulls.
The bias is for a move to the 2024 high (4) while prices remain above the handle.
Matt Simpson, Market Analyst at City Index and Forex.com (part of StoneX)

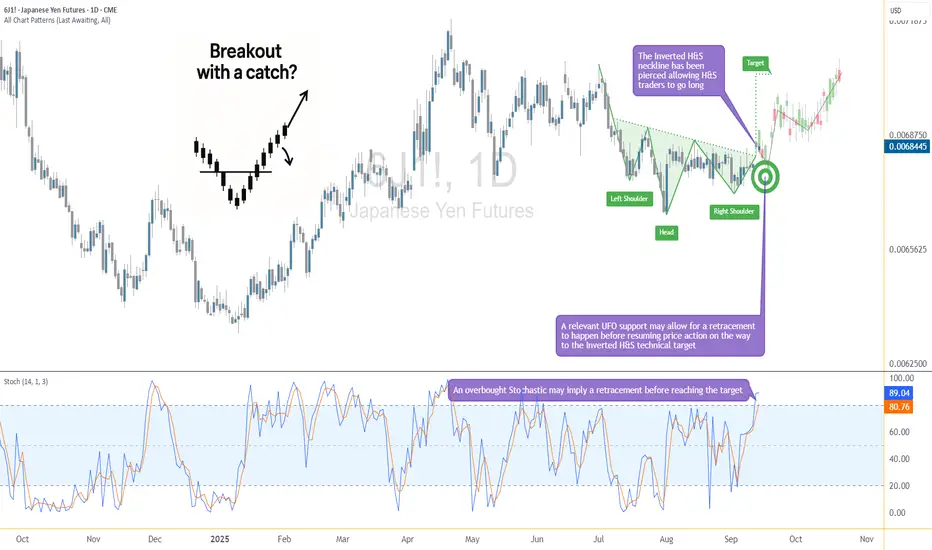
Breakout with a Catch: The Yen May Dip Before Lifting Off AgainThe Japanese Yen Futures (6J) have just pierced above a critical neckline at 0.0068220, completing an Inverted Head and Shoulders formation. This classical reversal pattern often signals a potential shift in momentum from bearish to bullish. Based on technical projections, the measured move points toward a target near 0.0070430, which lies significantly higher from current price levels.
Yet, there’s a catch. The Stochastic Oscillator has entered overbought territory, hinting that before the next upward leg develops, a retracement could occur. This makes the current setup particularly interesting, as the neckline breakout is bullish, but timing entries becomes crucial to avoid getting caught in a short-term dip.
Understanding the Inverted Head & Shoulders
The Inverted Head and Shoulders is one of the most recognized reversal patterns in technical analysis. It typically forms after a prolonged decline and suggests that bearish momentum is losing steam.
The structure consists of three parts:
Left Shoulder: the first swing low, followed by a rebound
Head: a deeper low, which marks the exhaustion of sellers
Right Shoulder: a higher low, indicating buyers are stepping in earlier
Neckline: the resistance level connecting the highs of the shoulders, acting as the trigger point
Once price pierces above the neckline, the pattern is considered complete. Traders often project the distance from the head to the neckline and extend it upward to identify a potential price objective. In this case, the neckline break projects a target near 0.0070430.
The reliability of this formation lies in its ability to signal a shift in trend sentiment. While no pattern is flawless, the inverted H&S is widely respected for its potential consistency.
The Role of Stochastic in This Setup
While the breakout above the neckline looks promising, momentum indicators suggest caution. The Stochastic Oscillator, a tool designed to measure overbought and oversold conditions, is currently flashing an overbought reading.
This does not necessarily mean that prices must reverse, but it does imply that the bullish move could pause or correct before resuming. In practical terms, traders might expect a short-term retracement as buying pressure temporarily exhausts itself.
Such pullbacks can be constructive within a broader bullish setup, especially if they occur near significant areas of support. By aligning the breakout pattern with Stochastic signals, traders can time their entries with more precision instead of chasing the market at stretched levels.
Support Zone & Safety Net
One of the strongest features of this setup is the presence of a relevant support area just below the neckline breakout level. This zone, also reinforced by a previously identified UFO support, could serve as a launching pad if prices retrace lower in the short term.
If 6J dips back toward the neckline, traders will be watching whether this level holds. A bounce from here would not only validate the breakout but also offer an attractive risk-to-reward setup. To manage downside exposure, a protective stop can be placed at 0.0067350, positioned below this key support zone.
This structure creates a layered safety net: first the neckline, then the underlying support, and finally the stop loss—offering multiple defenses against unfavorable moves before the bullish scenario invalidates.
Contract Specs & Margins (6J & MJY)
CME offers both the standard Japanese Yen Futures (6J) and the smaller-sized Micro JPY/USD Futures (MJY), giving traders flexibility depending on capital requirements and position sizing needs.
🟢 6J – Japanese Yen Futures
Contract size: ¥12,500,000
Minimum tick: 0.0000005 = $6.25
Initial margin: ≈ $3,100 (subject to CME updates)
🟢 MJY – Micro JPY/USD Futures
Contract size: ¥1,250,000 (1/10th of standard)
Minimum tick: 0.000001 = $1.25
Initial margin: ≈ $310 (subject to CME updates)
The Micro contracts replicate the price behavior of the standard Yen futures at a fraction of the size. This makes them attractive for traders who want to fine-tune risk exposure, scale in or out more precisely, or manage positions with smaller capital outlays.
Trade Plan Example
A structured trade idea can help frame the opportunity while managing risk effectively:
Direction: Long
Entry: Near 0.0068220 (neckline breakout level), or after a retracement toward support
Stop: 0.0067350 (below the support zone)
Target: 0.0070430 (measured objective from the inverted H&S)
Reward-to-Risk Calculation:
Potential reward = 0.0070430 – 0.0068220 = 0.0002210
Potential risk = 0.0068220 – 0.0067350 = 0.0000870
Approximate ratio = 2.5 : 1
This ratio is favorable, suggesting that the upside potential outweighs the defined downside exposure. Traders considering this setup may prefer to wait for a retracement toward support, which could enhance entry quality and improve the reward-to-risk profile even further.
The Importance of Risk Management
Even the most compelling technical setups require disciplined risk management. Using stop-loss orders is essential to protect capital against unexpected market swings, particularly in leveraged products like futures.
Position sizing is another key element—adjusting contract size to account size ensures that a single trade does not overexpose the portfolio. Micro contracts, such as MJY, are especially useful for traders looking to scale positions with precision.
Equally important is the principle of avoiding undefined risk. Every trade should have a clearly defined exit strategy, both for profits and losses. By knowing where to enter, where to exit, and where to cut losses, traders reduce emotional decision-making and maintain consistency.
Finally, patience plays a role. Waiting for a retracement into support rather than chasing a stretched market often improves entry quality, lowers risk, and increases the probability of success.
Conclusion
Japanese Yen Futures are showing signs of a potential trend shift as the inverted head and shoulders formation breaks above its neckline. The measured move points toward higher ground, but the overbought Stochastic warns that the path may not be in a straight line. A temporary dip into support could provide a second chance for bulls to position themselves with a favorable risk-to-reward profile.
By combining pattern recognition, momentum analysis, and precise trade planning, this setup highlights how technical structure and disciplined execution can align to create opportunity. Whether trading the standard 6J contract or the smaller MJY, the key remains the same: respect risk, trust the setup, and let the market confirm the move.
When charting futures, the data provided could be delayed. Traders working with the ticker symbols discussed in this idea may prefer to use CME Group real-time data plan on TradingView: www.tradingview.com - This consideration is particularly important for shorter-term traders, whereas it may be less critical for those focused on longer-term trading strategies.
General Disclaimer:
The trade ideas presented herein are solely for illustrative purposes forming a part of a case study intended to demonstrate key principles in risk management within the context of the specific market scenarios discussed. These ideas are not to be interpreted as investment recommendations or financial advice. They do not endorse or promote any specific trading strategies, financial products, or services. The information provided is based on data believed to be reliable; however, its accuracy or completeness cannot be guaranteed. Trading in financial markets involves risks, including the potential loss of principal. Each individual should conduct their own research and consult with professional financial advisors before making any investment decisions. The author or publisher of this content bears no responsibility for any actions taken based on the information provided or for any resultant financial or other losses.