HUGE BREKDOWN TREND - CRASH EXPECTING ON YFI BE ALERT!!Depending on my last update expecting that YFI will breakdown huge.
The first target are 19K for start of crash trend, and expecting at long term we will see only down trend that even from 12K and lower possible.
There are some important trends-news makes my expecting this crash
As we know always use good stop limit and trade safe
Have good time ALL
YFIUSDT


yearn.finance (YFI) Again Rejected By $30K ResistanceOn daily chart, the priceline of YFI token has again been rejected by $30K resistance.
The price action also has good supports of 25, 50 and 100 SMAs. If the price action will breakdown the 100 SMA, then it can re-test the $20K previous support as well.
On 4 hour chart the price action of YFI is also moving above 50, 100 and 200 simple moving averages.
Now the priceline is using these SMAs as good support. We can use the 200 SMA on 4 hour chart or the $20k price level support as stop loss.
Now 1st the priceline may form an up channel if it will be bounced from an up trend line. If it will break down the 100 SMA or the 20K support level, then we can expect another Shark move like previously the price action did.

YFI/USDT » double top pattern in 30 min time frameBe careful, a double top pattern may form
And divergence is seen in RSI
The 28700 range is also an important price resistance
This is just a personal opinion
Comment your opinion


✳️Yearn.Finance/USDT (28/11) View + Trading Plan #YFI $YFIYFI is still showing strong buying pressure after retesting the broken 18000$ zone as our previous analysis.
The target for YFI is 30000$ and even 40000$. However, the 30000$ zone is very strong and it can cause the YFI to fall sharply.
But if YFI falls out of the zone of 21000$, then YFI will continue to fall to 17500$ and even 12500$
📈BUY- LONG
-Buy: 21000-22000$.SL B
-Buy: 24000-25000$ if A. SL B
📉SELL-SHORT
-Sell: 30000-31500$. SL A
-Sell: 40000-42000$. SL A
♻️BACK-UP
-Sell: 21000-22000$ if B. SL A
-Buy: 17000-18000$. SL B
-Sell: 17000-18000$ if B. SL A
-Buy: 12000-13000. SL B
-Sell: 12000-13000 if B. SL A
❓Details
Condition A : "If 1D candle closes ABOVE this zone"
Condition B : "If 1D candle closes BELOW this zone"


CRYPTO: YFIUSDT Short Term Short Setup A short term short setup with an aim to book profits the 27000.00 psychological support level.

YFI/USDT1 hour time frame
The price is moving in a downward channel, which after hitting the bottom of the channel had a corrective move to the middle line of the channel, which does not seem to be able to cross.
The moving average also indicates a downtrend, which should wait for signs to rise again

YFI/USDT channel & moving averagedeath cross is seen in the moving average
The long-term moving average, which is green, can also act as a resistance
It is also possible that it is a sideways process.
And another important point is that the price is currently at the bottom of the uptrend channel, which is an important point from a technical point of view.
BINANCE:YFIUSDT

YFIDOWNUSDT - Possible ReVERSAL from here: 250% Profit PotentialEntry :: $0.40- $0.50
Exit 1st :: $0.75
Exit 2nd :: $1
Exit 3rd :: $1.55
SL $0.39
Profit – 250%
Hit Like if you Like
Comment if you dont agree.
<>

YFIUSDT Resistance level Breakout(LONG Entry With small SL)#YFIUSDTUSDT Technical Analysis Update
Resistance Breakout
YFI/USDT currently trading at $29000
LONG ENTRY LEVEL:29000- 29600
STOP LOSS: Below 28200
Resistance level 1( Target): $34000
Resistance level 2 (Target ): $39500
Max Leverage: 3X
ALWAYS KEEP STOP LOSS...
Follow our Tradingview Account for more Technical Analysis Update, | Like, Share and Comment your thoughts

YFI 12h Absorbing and joining preparing for the price explosion?The news from 1 December of Sushiswap & Yearn.Finance join and the flow of blocked funds blew up the Sushi and YFI price.
We suggest at the same time to evaluate a fresh idea for Sushi.
So, the above news helped YFI break the trend and easily rise in value from $26,000 to $31,000.
For the second time, YFI price tested for the strength the last defensive bastion of sellers, which was described in the previous idea.
Possible scenarios for the coming weeks:
Sellers will again try to push the price back to the liquidity zone of $21,000-22,500.
If in this zone, sellers show their strength and are able to lower the price below $18,300 , then the Double Top pattern will be activated. The final target for it is in the zone $10,000-11,500.
If buyers show their strength, they will drive the price up to the previous high in the range of $44,000.

YFI/USDT - Levels to watch, YFI is very bullishYFI has broken local resistance and ran for a nice 10% gains.
The next levels are on the chart. We are currently testing the 31.5k resistance level which will provide a short relief, but the momentum is very bullish which will be augmented by any BTC rally.
Aim to buy any retests of resistance turned support as we go up the ladder as indicated by the arrow path. This is indicative so use your best judgement when entering and adapt as price moves giving you more hints on future price action. Also use stop-losses as YFI can correct quite quickly and deep.

YFIUSDT a MUST on your ALTS portfolio 100K objective 6 month maxI love this proyect top 10 coin for me.

YFI/USDT 2h (Binance Fut.) Descending channel breakout & retestYearn.Finance seems to be preparing for bullish continuation, next big move should be soon!
Parallel channel broke out and is being retesting, also 200MA is acting as support.
Current Price= 23214.3
Buy Entry= 23351.2 - 21851.2
Take Profit= 26924.9 | 34272.0 | 40698.1
Stop Loss= 18983.5
Risk/Reward= 1:1.2 | 1:3.23 | 1:5
Expected Profit= +19.13% | +51.64% | +80.07%
Possible Loss= -16.01%
Fib. Retracement= 0.786 | 1.272 | 1.618
Margin Leverage= 1x
Estimated Gain-time= 240h

Practicing My Elliot WavesFirst time publishing something! Just practicing Elliot Waves to try and get some confluence. Seeing a potential bearish divergence if YFI loses steam.

YFIUSDT D1: BEST Level to BUY/HOLD 50% gains(SL/TP)(NEW)Why get subbed to me on Tradingview?
-TOP author on TradingView
-15+ years experience in markets
-Professional chart break downs
-Supply/Demand Zones
-TD9 counts / combo review
-Key S/R levels
-No junk on my charts
-Frequent updates
-Covering FX/crypto/US stocks
-24/7 uptime so constant updates
YFIUSDT D1: BEST Level to BUY/HOLD 50% gains(SL/TP)(NEW)
IMPORTANT NOTE: speculative setup. do your own
due dill. use STOP LOSS. don't overleverage.
Tagged as LONG as I expect more gains
short and mid term.
🔸 Summary and potential trade setup
::: YFIUSDT daily chart review
::: expecting more gains soon
::: V-shape recovery in progress
::: speculative setup
::: BUY/HOLD and get paid. 50% gains BULLS
::: recommended strategy: BUY/HOLD
::: market buy and hold it
::: exit position near 44000
::: SWING TRADE: BUY/HOLD IT
::: still more gains likely
::: good luck traders!
::: BUY and get paid. period.
🔸 Supply/Demand Zones
::: N/A
::: N/A
🔸 Other noteworthy technicals/fundies
::: TD9 /Combo update: N/A
::: Sentiment mid-term: BULLS


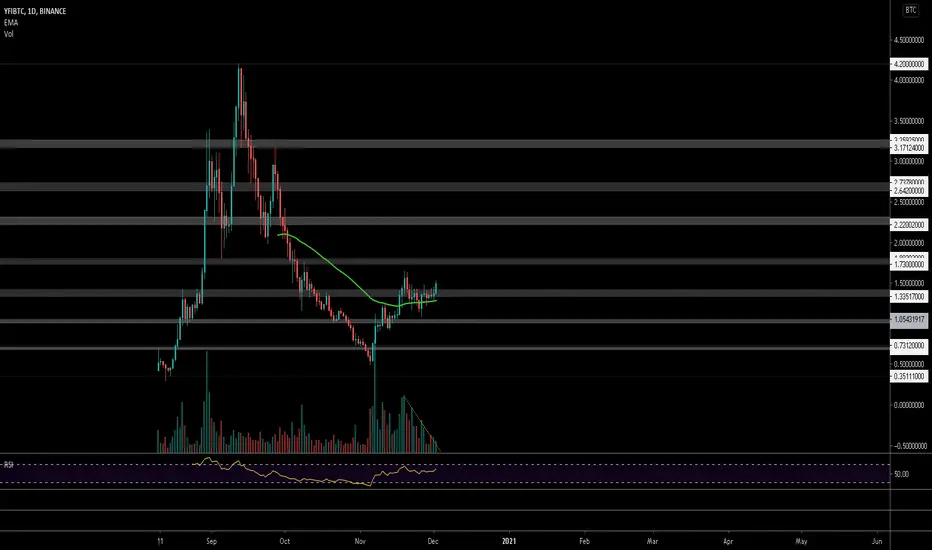
$YFI, Showing some signs of accumulation over ~1.33$ $YFI
Showing some signs of accumulation over ~1.33$ w/ EMA50 acting as support
For now, volume has been decreasing but if you look on lLTFs you may see that this is starting to change
UCTS indicator 1D Buy signal active
If gets traction (volume), then aiming for ~1.7$ !
#YFI


YFI taking a breakLeader of the DEFI, this coin is moving violently. Now that BTC is retaking the hot spot, it should cool down.
Targets on chart, final tp at 17.5k.
