Updated January 14 Volatility Event BreakdownThis video will help you understand how the markets are playing out related to my original prediction of a big volatility event on January 14.
Watching the markets swing up and down over the past two weeks while almost perfectly following my predicted price trends has been incredible.
But, I'm not always this accurate in my predictions - no one is.
I believe this market move is following my longer-term prediction of a moderate breakdown in Q1/Q2 of 2026. If my research is correct, we will continue to see an ABC or ABCDE wave structure where price continues to move downward and attempts to find a base near July 2026.
The one thing I really wanted to point out is the use of Fibonacci Defense Levels and how you can use them to better determine when and how price is breaking from a moderate pullback into an extended or deeper pullback/trend reversal.
I've been using these Defense Levels for quite a while, and I find they work well.
Please take a minute to watch this video.
I also highlight Gold/Silver and Natural Gas in this video.
Hope all of you are GETTING SOME today.
#trading #research #investing #tradingalgos #tradingsignals #cycles #fibonacci #elliotwave #modelingsystems #stocks #bitcoin #btcusd #cryptos #spy #gold #nq #investing #trading #spytrading #spymarket #tradingmarket #stockmarket #silver
Ym

SPY/QQQ Plan Your Trade For 1-28: Breaking(Up/Down)Today’s pattern is a Breaking(Up/Down) pattern.
This pattern suggests the SPY/QQQ will attempt to break away from yesterday’s price range. Normally, these Breaking patterns resolve as a moderately aggressive move away from the previous candle’s body range. Thus, my expectations are for the SPY/QQQ to attempt to move higher into the “new high” territory as we continue to work through the Flag Apex volatility phase.
Overall, I believe this move higher will stall out in early February and move downward as my Predictive Modeling has suggested. For many weeks, the Predictive Modeling tool has shown the markets will move into a potential breakdown phase in early/min February.
At this time, I believe the markets are pushing higher into a “false high” pattern that could translate into a larger breakdown phase moving through Q1:2026 and into Q2:2026. Time will tell.
As you know, I’ve moved my trades mostly to CASH and am currently sitting on about 70-80% CASH in my account. Yes, I still have some trades active and I have begun to setup 35+ day Shorts/Puts related to my expectation the markets may move downward in early February – but I’m not going to chase this move any further right now.
The one trade I believe I may make by the end of this week is to put on 1-3 longer-term Gold/Silver Calls. I believe this move in metals is unprecedented and I believe a small active position is almost essential. If you don’t play this once in a lifetime move efficiently, you can’t materialize the gains.
Right now, the hardest part of my trading is NOT wanting to get overly excited about these big runs in Metals and the potential for NatGas. I have to keep telling myself to be patient and wait for the right setups. Trust my analysis and trust my instinct.
There will always be another day to trade in the future.
At this point, I think the smartest move is to sit back and watch for a few days. This big move higher in Gold/Silver could be “the rally to the peak of Leg #2” – just like I predicted. One thing I’ve learned is not to chase moves when you believe they are over or nearly done.
Sure, you can leave a small runner position on if you want. Just be prepared for that position to turn into a loss if the markets suddenly turn against your trade.
NatGas rolled to the March contract. That is why we are seeing a big price gap on the NG chart. UNG is holding up well and I believe this storm will continue to increase demand into February – possibly into March. So, I plan on trying to take advantage of any price weakness in UNG.
If today goes as planned, it should be a day of mostly sitting and watching the markets. I don’t plan on being overly aggressive with my trades today.
Get some.

Breakdown after Jan 14 Volatility Event - Get some.This video highlights the continued price action I suggested would take place after the Jan 14 volatility event.
Honestly, watching the markets open tonight, moving in the direction of my trades (metals, SPY/QQQ/TECS/XLK/others). I could not be happier.
Additionally, Nat Gas is starting to make a big move higher. I've been positioning into this move for more than 30 days. Now, the dual Polar Vortex may setup driving very cold temps into the US/UK.
Sometimes, you have to trust the ADL predictive modeling and play those bigger moves for profits.
I just wanted to share this success and to ask you if you were able to follow my research and GET SOME as well.
We could see a big breakdown over the next 24 hours on news or social issues in the US/UK.
Get some.

Jan 14 Volatility UpdateThis video highlights what I believe will happen after the Jan 14 volatility event.
I believe the markets are moving through a Flag Apex phase that will result in Apex Volatility over the next 10+ days.
This volatility could present a present a very real potential that price could continue to move downward before finding support.
I believe this move could present a very decent opportunity for traders as price rotates for about 10+ days. Then, price should move into a fairly solid downtrend after Jan 25-28.
Get some

Jan 14 Major Volatility Event Update - Thank youI wanted to give everyone an update related to my thinking.
I'm not expecting this Jan 14 volatility event to be more than a 3-5% pullback event. I know that may seem huge for some of you, but it really is not that big.
What I really do expect is this event changes how the markets develop forward objectives for Q1 and Q2 2026.
I've tried to explain my actions and expectations in this video for all of you to review.
Remember, I'm just a trader like all of you. I use my tools and research to try to make the best decisions.
Overall, as I've learned, it is all about protecting capital and positioning for the best opportunities. If you are wrong, you take your lumps, learn, and try to do better next time. If you are right, you try to replicate that winning process.
As I mentioned before. Last year, I had a great year trading. I'm not going to go into details - but I'm very happy.
I'm looking to do even better this year.
As I continue to share more videos, remember one thing (please), I'm just sharing my thoughts. if you don't like my content - go find someone else you trust.
This is all about trying to make the best decisions.
Get some.

MAJOR VOLATILITY EVENT ON JAN 14 : GET READYI've created this message to alert all of you to a massive volatility event that should take place on January 14, 2026.
My predictive modeling system suggests the SPY/QQQ/DIA will react to some type of massive volatility event on Jan 14. I don't know what will cause the event, but it looks like the SPY/QQQ/DIA may move 3-5% or more and remain in an elevated-volatility period for more than 5-10 days (through the end of January).
I suggest traders take Monday/Tuesday (Jan 12-13) to balance their portfolios/trades and try to position ahead of this massive volatility event.
If you have trades that could be wiped out over the next 5-10 days because of an event like this, make efforts to preserve your capital ASAP.
If you have longer-term trades, expiring after Feb 15 or so, you may be OK holding them if they are LONGS/CALLS. But I believe this volatility event could be something HUGE. So, all of you need to make efforts to protect your account/capital - even if I'm wrong.
I've created this video to explain WHY it is so important for traders to understand what may happen on Jan 14. And the only reason I know this event is likely to happen is because of my predictive modeling tools.
Either way, this is a warning for all of you. The markets will likely move into a massive volatility event on or near Jan 14.. Get ready.
This could be HUGE.
Get some

Market Bias Below 48000As outlined in my previous analysis, the market pushed higher and reached the 49450 area.
At this stage, my view remains unchanged: price still needs to trade below 48000.
Until acceptance below this level is seen, the prevailing market bias remains short.
External events and global narratives are irrelevant to this assessment.
The market is neutral, mechanical, and indifferent — it simply does what it needs to do.
Further updates will be provided once conditions are met.

$YM | Get long the pullback!Today we go through plans in $YM. After a large bull day, it's not the best day to trade as the market often needs a 'day of rest'. However, we were able to dig into our tools and come up with a solid plan to potentially get long.
Hopefully you can learn something from this video about how to make plans admit the chaos of the market.

$YM | "Resistance" Zone, or low key breakout area? Let's analyzeToday, we discuss some nuance, so put on your analyst hats and let's dive in!

SPY (S&P 500 ETF) – Game PlanSPY (S&P 500 ETF) – Game Plan
📊 Market Sentiment
On October 29, the FED lowered rates by 25bps as expected. However, Powell’s remarks introduced uncertainty around further cuts in December, emphasizing that future policy will depend on incoming data.
One FED member dissented, preferring no cut this cycle — a notable shift from September’s unanimous decision.
Additionally, ADP Non-Farm Employment Change came at 42K versus 32K expected. It’s slightly higher, but since other macro data are missing due to the U.S. government shutdown, the overall sentiment remains unclear.
For now, sentiment leans bearish, as rate cuts may be delayed into 2026.
📈 Technical Analysis
SPY recently touched the 670 level an important support zone representing the equilibrium of the current daily range and an area with significant liquidity.
However, with bearish macro sentiment, I don’t expect this level to hold for long. The structure suggests that price wants to seek lower liquidity zones.
📌 Game Plan / Expectations
My primary scenario is a short move targeting 663, which aligns with the 0.75 max discount zone. From there, a potential rally toward all-time highs could begin.
Scenario 2: If the 663 level fails to hold, I will look for another bounce opportunity near 657.
Overall, I don’t see this as a start of a bear market — rather a healthy correction within the broader bullish structure. I’ll be positioning for buys once the downside liquidity objectives are met.
💬 For deeper sentiment and strategy insights, subscribe to my Substack — free access available.
⚠️ Disclaimer
This analysis is for educational purposes only and does not constitute financial advice. Always conduct your own research before trading or investing.

$YM | Dow Futures Analysis | Long Scenario / IdeaAnalysis of today. We're currently in the dead center of two fairly strong levels with some bullish news premarket. Look to 'buy' at our green zone, and target the pink.

NQ Shorts IncomingYM approaching 4H imbalance, ES could sweep asian session high and play into previous OB while NQ sweeps london session liq and mitigates asian session OB

S&P 500 Futures ES $1000 risk per contract/ES in a $1000 risk to $1000 reward position. Bias is bullish but watch out for news. Trailing stops can be used to scalp the market. /MES is only $100 risk per contract for 1:1 ratio. Let watch and see what happens?

Dow Jones (YM) - Technical Analysis Report - 20250908Analysis Date: September 8, 2025
Current Price: 45,537
Market Session: Post-Market Analysis
---
Executive Summary
Dow Jones presents a moderately extended equity position with manageable risk characteristics compared to other major indices. While trading above institutional accumulation levels, the extension is less severe than S&P 500 or Nasdaq, making it the least dangerous of the equity exposures. However, institutional positioning analysis reveals limited upside potential with asymmetric risk favoring defensive strategies.
---
Quarterly Volume Profile Analysis
Institutional Positioning Intelligence
The quarterly volume profile (Q3 2025) reveals a concerning pattern typical of extended equity markets in late-cycle environments:
Primary Institutional Activity Zone: 42,000-43,500
Moderate blue volume concentration representing historical institutional positioning
Current price (45,537) trades approximately 2,000+ points above primary accumulation
Volume density significantly lighter than commodity accumulation patterns
Institutional activity appears distributed rather than concentrated
Extension Analysis:
Core Accumulation: 42,500-43,000 (peak institutional activity)
Extended Zone: 43,500-44,500 (moderate institutional interest)
Current Level: 45,537 (approximately 5-7% above institutional positioning)
Void Risk: Above 46,000 (minimal institutional support visible)
Resistance Structure Analysis:
45,800-46,200: Immediate resistance with mixed volume activity
46,500-47,000: Historical distribution zones from previous highs
47,500+: Complete institutional void representing extreme overextension
Price Structure Context
Historical Pattern Recognition:
The current Dow Jones setup displays classic late-cycle equity characteristics where price has methodically ground higher above institutional accumulation zones. Unlike the catastrophic voids seen in S&P 500 and Nasdaq, YM shows a more measured extension that may be sustainable in the near term.
Relative Risk Assessment:
Manageable Extension: 5-7% above institutional levels vs 15%+ in other indices
Blue-Chip Nature: Dow composition includes more defensive, dividend-paying companies
Institutional Memory: Historical support levels around 42,000-43,000 well-established
Risk Definition: Clear institutional boundaries provide defensive positioning reference
Sector Composition Considerations
Dow Jones Defensive Characteristics:
Utilities and consumer staples providing defensive anchor
Financial sector exposure to interest rate sensitivity
Industrial components reflecting economic cycle positioning
Technology weight lower than growth-focused indices
---
Execution Chart Technical Analysis
Current Technical Configuration - DETERIORATING MOMENTUM
DEMA Analysis - WARNING SIGNALS EMERGING:
Black Line (Fast DEMA 12): Currently at 45,537
Orange Line (Slow DEMA 20): Currently at 45,480
Configuration: Bullish but narrowing gap indicating momentum loss
Trend Bias: Technical momentum weakening despite bullish configuration
DMI/ADX Assessment - MOMENTUM DETERIORATION:
ADX Level: Declining from previous highs, currently around 25-30
+DI vs -DI: +DI losing dominance, -DI starting to gain ground
Momentum Direction: Showing signs of exhaustion after extended advance
Trend Strength: Weakening ADX suggests institutional conviction fading
Stochastic Analysis - OVERBOUGHT CONDITIONS:
Tactical Stochastic (5,3,3): Overbought territory with negative divergence
Strategic Stochastic (50,3,3): Extended levels showing momentum fatigue
Divergence Analysis: Price making new highs while momentum indicators lag
Support and Resistance Levels
Critical Technical Levels:
Current Resistance: 45,800 (near-term extension limit)
Key Resistance: 46,200 (major resistance zone)
Major Resistance: 46,800 (dangerous overextension territory)
Immediate Support: 45,200 (DEMA cluster)
Key Support: 44,500 (institutional extension boundary)
Major Support: 42,500-43,000 (primary institutional accumulation)
---
Trading Scenarios and Setup Criteria
Scenario 1: Defensive Profit-Taking Setup (PRIMARY)
Optimal Conditions for Position Reduction:
DEMA momentum loss: Gap narrowing between black and orange lines
DMI deterioration: -DI gaining on +DI with weakening ADX
Stochastic overbought: Both timeframes showing exhaustion signals
Volume analysis: Declining volume on any advance attempts
Resistance respect: Failure to break above 46,000 cleanly
Profit-Taking Protocol:
Primary Action: Reduce positions by 50-75% at current levels
Secondary Reduction: Complete exit on any bounce to 46,000+
Stop Management: Trail stops using 300-point intervals
Cash Allocation: Redirect capital to commodity opportunities
Scenario 2: Range-Trading Setup (SECONDARY)
Conditions for Tactical Range Trading:
Defined range: 44,500-45,800 (institutional boundary to resistance)
DEMA maintaining bullish bias within range
Volume profile respect at key levels
ADX below 25 indicating sideways consolidation
Range Trading Parameters:
Long Zone: 44,500-44,800 (institutional boundary approach)
Short Zone: 45,600-45,800 (resistance approach)
Stop Distance: 300-450 points maximum
Position Size: Reduced allocation (1% account risk maximum)
Scenario 3: Breakdown Short Setup (AGGRESSIVE)
Short Entry Conditions:
DEMA bearish crossover: Black line breaking below orange line
Support violation: Break below 44,500 institutional boundary
Volume confirmation: Increased volume supporting breakdown
DMI alignment: -DI gaining clear dominance over +DI
Short Setup Parameters:
Entry Range: 44,200-44,400 on confirmed breakdown
Stop Loss: Above 45,000 (failed breakdown)
Targets: 43,000, 42,500, 42,000 (institutional accumulation zones)
Risk Management: Tight stops given counter-trend positioning
---
Risk Management Protocols
Position Sizing Guidelines
Conservative Approach (Strongly Recommended):
Maximum Risk: 1% of account (reduced from standard due to extension risk)
Contract Calculation: Account Size × 0.01 ÷ (Stop Distance × $5)
Example: $100,000 account with 400-point stop = 50 contracts maximum
Rationale: Extended positioning requires defensive allocation
Stop Loss Hierarchy
Tactical Stop: 45,000 (execution chart support cluster)
Strategic Stop: 44,500 (institutional extension boundary)
Emergency Stop: 43,800 (institutional accumulation approach)
Portfolio Management Framework
Defensive Positioning Strategy:
Current Holdings: Reduce exposure by 50-75%
New Positions: Avoid until return to institutional levels
Capital Reallocation: Redirect to commodity opportunities (NG, CL)
Monitoring Frequency: Daily assessment of momentum deterioration
---
Market Context and External Factors
Fundamental Considerations Affecting Dow Performance
Economic Cycle Positioning:
Federal Reserve policy uncertainty affecting financial sector components
Industrial sector sensitivity to economic slowdown concerns
Consumer discretionary weakness impacting retail components
Utility sector providing defensive characteristics in uncertain environment
Sector Rotation Implications:
Value vs growth rotation potentially favoring Dow components
Dividend yield advantage in higher interest rate environment
Defensive sector weighting providing relative outperformance potential
International exposure through multinational components
Technical Market Structure
Relative Performance Analysis:
Outperforming S&P 500 and Nasdaq on risk-adjusted basis
Less extended from institutional levels than growth indices
Better volume profile support at key technical levels
Defensive sector composition providing downside protection
---
Monitoring Checklist and Alert Levels
Daily Monitoring Requirements
DEMA Configuration: Watch for gap narrowing or bearish crossover
Institutional Respect: Monitor behavior at 44,500 extension boundary
Volume Analysis: Track volume patterns on any advance attempts
Sector Rotation: Monitor defensive vs growth sector performance
Correlation Analysis: Track relationship with bond yields and dollar strength
Critical Alert Levels
Risk Escalation Alerts:
DEMA bearish crossover below 45,400
Break below 44,500 institutional extension boundary
Volume breakdown with accelerating selling pressure
ADX rising with -DI dominance confirming bearish momentum
Defensive Action Triggers:
Any failure to break above 46,000 on multiple attempts
Stochastic negative divergence with price at new highs
Sector rotation away from Dow components toward defensives
Federal Reserve policy announcements affecting interest rate expectations
---
Strategic Outlook and Risk Assessment
Risk/Reward Analysis
Asymmetric Risk Profile:
Upside Potential: Limited 500-800 points to dangerous overextension
Downside Risk: 2,000+ points to institutional accumulation zones
Risk/Reward Ratio: Unfavorable 1:3+ downside vs upside
Probability Assessment: Moderate (40%) for further upside, High (70%) for correction
Portfolio Allocation Recommendation
Defensive Positioning Required
Dow Jones represents the least dangerous equity exposure in current market conditions but still requires defensive management. The 5-7% extension above institutional levels, while manageable compared to other indices, suggests limited upside potential with significant correction risk. Priority should be placed on systematic profit-taking and capital reallocation to higher-conviction commodity opportunities.
Allocation Framework:
Current Portfolio Weight: Reduce to 5-8% maximum (from previous levels)
Entry Method: Avoid new positions until institutional level return
Hold Period: Short-term tactical only, exit on weakness
Exit Strategy: Systematic reduction on any bounce attempts
---
Conclusion and Strategic Assessment
Dow Jones offers the best risk profile among equity indices but remains fundamentally challenged by extension above institutional positioning. The defensive sector composition and less severe overextension provide relative safety, but the asymmetric risk profile strongly favors capital preservation over growth seeking. Current conditions warrant defensive positioning with readiness to exit entirely on any momentum deterioration.
Strategic Priority: Capital preservation and systematic risk reduction while maintaining readiness for complete exit if institutional extension boundaries are violated.
Next Review: Daily monitoring of momentum indicators and institutional level approach
Position Management: Systematic profit-taking with defensive stop management
---
Important Disclaimer
Risk Warning and Educational Purpose Statement
This analysis is provided for educational and informational purposes only and does not constitute financial advice, investment recommendations, or trading signals. All trading and investment decisions are solely the responsibility of the individual trader or investor.
Key Risk Considerations:
Futures trading involves substantial risk of loss and is not suitable for all investors
Past performance does not guarantee future results
Market conditions can change rapidly, invalidating any analysis
Leverage can amplify both profits and losses significantly
Individual financial circumstances and risk tolerance vary greatly
Professional Guidance: Before making any trading decisions, consult with qualified financial advisors, conduct your own research, and ensure you fully understand the risks involved. Only trade with capital you can afford to lose.
Methodology Limitations: Volume profile analysis and technical indicators are tools for market assessment but are not infallible predictors of future price movement. Market dynamics include numerous variables that cannot be fully captured in any single analytical framework.
The views and analysis presented represent one interpretation of market data and should be considered alongside other forms of analysis and individual judgment.
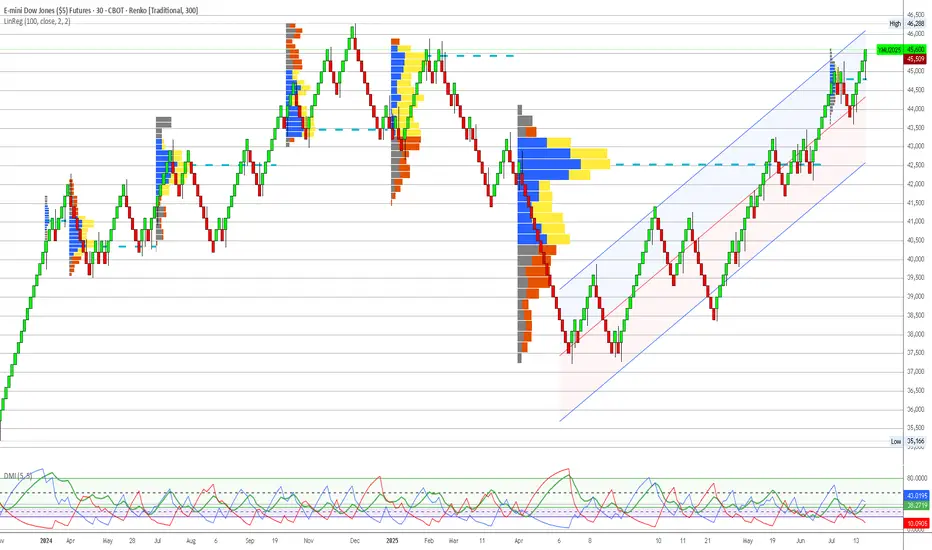
Explaining Fibonacci Retracement/Extension levelsThis video is designed to help teach you why I use the Fibonacci Defense levels as components of price action and how I use Fibonacci retracement/extension levels (related to previous market trends).
Remember, the three components of price action are TIME, PRICE, & ENERGY.
If you don't understand how price is structured before attempting to use Fibonacci concepts, it's almost like trying to throw darts blindfolded.
You must break down the previous trends in order to try to understand what is happening with current price trends (expansion/contraction/phases).
Watch this video and I hope it helps all of you understand what the markets are doing and how to use Fibonacci Retracement/Extension levels more efficiently.
All types of technical analysis are validation tools - not guarantees. The only thing we get out of technical analysis is a way to validate or invalidate our expectations. A or B. Nothing else.
Get some.
#trading #research #investing #tradingalgos #tradingsignals #cycles #fibonacci #elliotwave #modelingsystems #stocks #bitcoin #btcusd #cryptos #spy #gold #nq #investing #trading #spytrading #spymarket #tradingmarket #stockmarket #silver

Us30 active buy Us30 active buy aiming for +120 pips Target to create the wick on the last daily candle without a wick
aslong as we remain above MAs we are bullish

SPY/QQQ Plan Your Trade Update For 8-26This new video should help you understand the dynamics playing out related to SPY/QQQ, BTCUSD and GOLD/SILVER.
Get some.
#trading #research #investing #tradingalgos #tradingsignals #cycles #fibonacci #elliotwave #modelingsystems #stocks #bitcoin #btcusd #cryptos #spy #gold #nq #investing #trading #spytrading #spymarket #tradingmarket #stockmarket #silver

Is this the top? SPY/QQQ Plan Your Trade Update For 8-20I know it has been a while since I shared a video.
This video is designed to share the downside risks I see as a potential for the markets IF this big speculative phase unwinds like I think.
Ultimately, you guys are the ones who will be making the trading decisions. I just want you to be aware that the markets are extremely volatile right now and the data is pointing to a very clean Excess Phase Peak (EPP) pattern.
As you are all aware, the EPP pattern suggests that a breakdown in price is likely where price may attempt to target the FLAG LOW.
If that happens, be prepared for a -15% to -20% breakdown in price before the end of 2025 - possibly seeing an even bigger price collapse.
In my opinion, this breakdown is the result of a broad unwinding of excesses related to the Biden economy (free money) and a move towards more reasonable US economic policies.
Overall, this pullback is necessary for the Wave 1 of Wave 5 structure to complete. Once this pullback is complete, the bigger rally phase (Wave 3 of Wave 5) will begin. And get ready for a big rally phase with Wave 3.
So, I hope this video helps you learn how to identify and plan for some of the biggest price swings in the SPY/QQQ, and prepare for even bigger moves in Gold/Silver and Bitcoin.
Get some.
#trading #research #investing #tradingalgos #tradingsignals #cycles #fibonacci #elliotwave #modelingsystems #stocks #bitcoin #btcusd #cryptos #spy #gold #nq #investing #trading #spytrading #spymarket #tradingmarket #stockmarket #silver

SPY/QQQ Plan Your Trade Update For 8-5This short video is to provide my followers with an update.
I'm still here. I'm still working on projects and new TV code. I have developed a couple of new strategies that I like and that seem to continue to perform.
Overall, I'm still doing my best to deliver superior analysis/results for my followers.
This video covers the SPY/QQQ, Gold/Silver, and BTCUSD (plus extras).
Hope you are all getting some great profits from these moves.
GET SOME.
#trading #research #investing #tradingalgos #tradingsignals #cycles #fibonacci #elliotwave #modelingsystems #stocks #bitcoin #btcusd #cryptos #spy #gold #nq #investing #trading #spytrading #spymarket #tradingmarket #stockmarket #silver

US30; Heikin Ashi Trade Idea📈 Hey Traders!
Here’s a fresh outlook from my trading desk. If you’ve been following me for a while, you already know my approach:
🧩 I trade Supply & Demand zones using Heikin Ashi chart on the 4H timeframe.
🧠 I keep it mechanical and clean — no messy charts, no guessing games.
❌ No trendlines, no fixed sessions, no patterns, no indicator overload.
❌ No overanalyzing market structure or imbalances.
❌ No scalping, and no need to be glued to the screen.
✅ I trade exclusively with limit orders, so it’s more of a set-and-forget style.
✅ This means more freedom, less screen time, and a focus on quality setups.
✅ Just a simplified, structured plan and a calm mindset.
💬 Let’s Talk:
💡Do you trade supply & demand too ?
💡What’s your go-to timeframe ?
💡Ever tried Heikin Ashi ?
📩 Got questions about my strategy or setup? Drop them below — ask me anything, I’m here to share.
Let’s grow together and keep it simple. 👊

July 21 Special Update : Metals, SPY & More. What's Next.This special update is to highlight why I continue to believe traders should stay very cautious of this rally in the SPY/QQQ/BTCUSD.
Underlying economic data suggest that this is one big speculative rally following the April Tariff collapse.
And, the economic data I see from my custom indexes suggests the markets are moving into a very volatile and potentially dangerous topping pattern.
As I've stated many times in this video. I'm not saying the markets have topped and you should SELL EVERYTHING. I'm suggesting this market is extremely over-valued in terms of the underlying risk factors at play and the very clear data that suggests the markets are already in a recessionary price trend.
You may ask, "How can the markets continue to rally like this in a moderate recession?".
The answer is simple.
All bubbles end with a super-speculative phase. This phase is where everyone piles into a euphoric attempt to ride the rally higher.
It happened in the late 1990s. It has happened again through the 2000-2005+ housing bubble. Heck, it has occurred in the collectors market over the past few decades where people spent fortunes on the "hottest items" (think Beanie-Babies) only to find out they bought at the height of the bubble.
That is why I continue to urge traders to remain cautious and to withdraw profits from this speculative rally phase. Protect your investment capital immediately and consider the risks associated with the information I share in this video.
I'm not trying to scare anyone. I'm just trying to be realistic in terms of what I see in my data and why I believe now is the best time to MOVE TO SAFETY.
My data suggests that the markets are about to enter a fragile and potentially dangerous pullback phase. If you want to ride it out - go for it.
Otherwise, prepare for significant volatility over the next six months or more.
Get some.
#trading #research #investing #tradingalgos #tradingsignals #cycles #fibonacci #elliotwave #modelingsystems #stocks #bitcoin #btcusd #cryptos #spy #gold #nq #investing #trading #spytrading #spymarket #tradingmarket #stockmarket #silver

NQ thread: Short ideaMonday started off bullish, but only to drop at the end of the session.
Here is a thread on what is happening and on which narratives I view the market
Starting off with the 4H Time frame, we witnessed NQ and ES taking last weeks high.
YM did not.
This is the first stage of the movement. To find the second stage, we need to dive deeper into the lower timeframes..
SP500 ES Weekly Recap | ATH Deviation → Pullback or Powell Pump?Overview:
ES made a new all-time high last week, sweeping the previous high with strong momentum.
However, the move ended up being a deviation, and the price quickly reversed — suggesting short-term exhaustion.
Bearish Scenario (Baseline):
🔻 Rejection from ATH
🔻 Possible retracement targets:
12H Swing Low (turquoise line)
Weekly Fair Value Gap (purple zone)
I believe a pullback into those levels could provide bullish continuation setups for new highs. I’ll look for LTF confirmation once price reaches those zones.
Bullish Scenario (Catalyst-Driven):
🚨 If Fed Chair Powell resigns this week (a circulating macro rumor), the market may not wait for retracement.
This could lead to an aggressive breakout, driving ES and risk assets straight into new ATHs again.
Plan:
✅ Watch for LTF confirmation after pullback
✅ Stay open to both scenarios
✅ Focus on HTF bullish structure as long as key levels hold
