AGL UpswingJSE:AGL seems to be making an upswing at the moment. It recently formed a higher low and now with the EMAs crossing which was preceded by signals from the Stochastic as well as the MACD - I think we could see the upward momentum continue possibly all the way up to the resistance at around the 63500 area.
ZAR

AMS - Possible long tradeJSE:AMS is looking good for a long position based off of our 3 momentum indicators. It has also recently found support and bounced nicely off of the 200SMA. I think we could see a nice upward move to at least the 180000 level and if it doesn't find resistance there and breaks through it could go all the way to around the 200000 level.


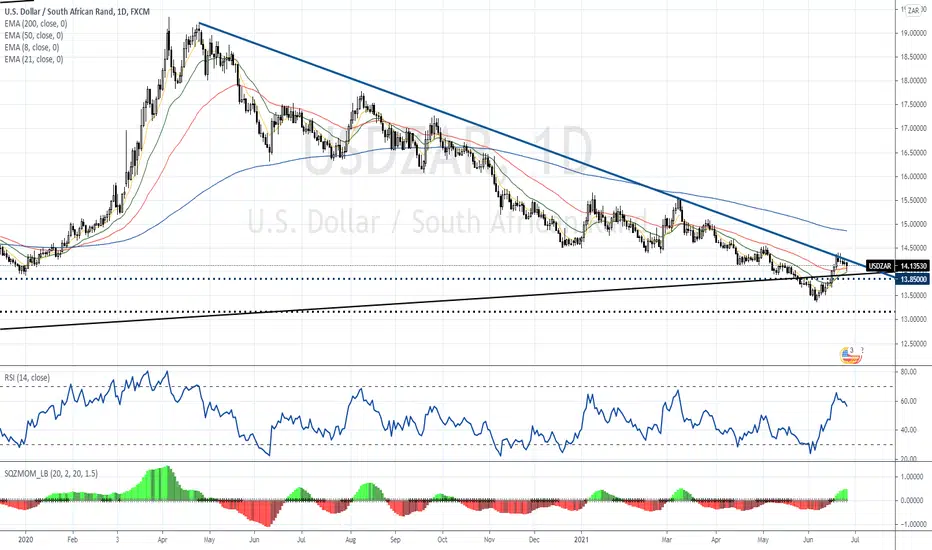
ZAR strength not necessarily overMedium-term bullish trend still seems to be intact for the USDZAR, after its recent weaknesses (strength in the US Dollar). It currently finds itself back at the 50-day Moving Average (EMA), with a break and close below R14.07, bringing back the strong support level at R13.95. This is a strong support level, with a break lower, most probably bringing back R13.50 (short-term target). Should we however see further weakness, with a break above the bullish trendline at R14.30, could see the USDZAR only find resistance again at the 200-day EMA at R14.86. For now, I still believe that the Rand is in oversold territory, which is confirmed by its 14-day RSI.

IS USDZAR READY FOR BRERAKOUT? Would love to see a nice breakout, with usd strength chiming in the market.
#BLESSEDPIPS


GOLD UPSIDEWith 10year treasury yields under pressure, high inflation, with expectation of a higher inflation print this coming Thursday, together with a weak dollar, this inverse head&shoulders pattern (hourly graph) has a very high potential of taking gold even higher.
Together with the ZAR that has reached a short-term bottom, I am bullish on gold miners having another bull run.

EURZAR bounce over a monthly support 🦐EURZAR on the 4 chart test the monthly support and start to trade to the upside.
The price is testing a minor resistance zone and according to Plancton's strategy if the market will break above we will set a nice long order.
–––––
Follow the Shrimp 🦐
Keep in mind.
🟣 Purple structure -> Monthly structure.
🔴 Red structure -> Weekly structure.
🔵 Blue structure -> Daily structure.
🟡 Yellow structure -> 4h structure.
⚫️ Black structure -> <4h structure.
Here is the Plancton0618 technical analysis , please comment below if you have any question.
The ENTRY in the market will be taken only if the condition of the Plancton0618 strategy will trigger.


ZAR Potential 12.100 moveIf price finds a way passed the current daily support. Price will fall down to the 12.100 - 11.000 range in the months to come.
Comment Like Follow
Press the Like button to agree or disagree

Barloworld short if trendline brokenJSE:BAW is showing downward momentum based on the stochastic, MACD and EMA's that have just crossed. However, it has been trending upwards since the 26th of March and I will wait for a convincing breakout through the upward trendline before considering a short. If this breaks, we could be looking at a move down towards at least the lows formed at the beginning of the upward trend.

Short on BHPJSE:BHP is looking good for a downward move based on the momentum indicators (Stochastic, MACD and EMA's). If this short plays out and it reaches the support level around 41000 this would mean a Head and Shoulders pattern would form.
Once this Head and Shoulders forms and the neckline is broken, we could potentially see a move downwards all the way to the taregt around 33000. This is all dependent on whether the H&S forms and the neckline is broken, though.

EXX Short OpportunityJSE:EXX is showing some downward momentum and if continues, we could be seeing a nice downward move. Look out for the support level at around 16500, but if it breaks through that I think it could go down all the way to the 15000 area.

Northam - Short The stochastic, MACD and the 2 EMA's have all turned downward on JSE:NHM - all signaling a short position. It has, however, been in an uptrend since end of Jan, so we might only see a retracement before a continuation upward. If it does go down, I dont think it will go much further than the support area around 23000.

AGL - Upward ChannelJSE:AGL has been trading in an upward channel and has recently bounced off the top for the 3rd time. I think we could see a move downwards to the bottom of the channel from here. The 60000 level is a potential target before either bouncing up or breaking out of the channel.

AMS - EMA crossing could be signaling a shortThe EMA's on JSE:AMS have finally crossed downwards after the stochastic and MACD have been showing downward momentum for some time. It might struggle a bit at the 200000 level, but if it breaks through that, I think we could potentially see it go to around the 180000 support level.

USDZAR LIFETIME Opportunity Buying Zone - USD RAND WEEKLYUSDZAR LIFETIME Opportunity Buying Zone - USD RAND WEEKLY ANALYSIS ( BUY AND HOLD FOR AN YEAR )

Old Mutual turning upJSE:OMU has bounced nicely off of the 200 simple moving average, failed to make a lower low and seems to be turning upwards for a long position. Momentum indicators are also start showing a move to the upside. We could possibly go to the previous highs around the 1500 level.

Downward Momentum on MondiJSE:MNP is showing some nice downward momentum thanks to yesterday's strong down move. The stochastic, MACD and EMA's are all showing great potential for a short position.

Cup & Handle on CapitecJSE:CPI has formed a great cup and handle pattern on the day chart. It goes all the way back to December 2019 with the top of the cup being formed on the all-time high that was reached in December 2020. If we successfully break this high, I think we could see a really nice upward move from there.

Kumba moving down after a strong upward moveAfter a very successful long position (link attached below), JSE:KIO has bounced off of the strong resistance level at around 67000 and seems to be on the way down. This is being confirmed by our momentum indicators, the stochastic, MACD and potentially the EMA's with today's move. If it confirms, potentially, we could go down to around 58000 - 59000 area.

Downward Momentum on ARIJSE:ARI is showing some good downward momentum with the recent downward crossing of the 3 and 15 period EMA's as well as the crossing downward of the stochastic and the MACD. If this momentum continues, we could see a possible downward move towards the support level at around 24000.
