Corn bottomed?Corn bounced right off the range I mentioned on my last idea, Aggressive traders might go long here but it's probably best to wait for MACD signal and further strength. Seasonally corn is Not bullish at this time of the year, so it's best to be careful with longs
**If you're interested in joining a group of like-minded traders, send me a PM. This is NOT a subscription service, just bunch of average traders sharing insights in a FREE group
Zc1

"Corn: going down as expected" by ThinkingAntsOkDaily Chart Explanation:
- Price bounced on the Major Resistance Zone and started the down move.
- It reached our first target for the bear move at the Middle Support Zone (4.00).
- Now, it has potential to move down towards our second target at the Support Zone (3.395).
- We are looking for sell setups on lower timeframes.
Check our our Weekly Vision. Updates coming soon!
Weekly Vision:

Looking for a tradeable low in Corntarget for short corn idea that I posted was hit, now I’m looking for a tradeable low, more downside is likely but it’s probably better to stay flat and let the market figure out from where to bounce and then get on the trend.
If 400 doesn’t hold, a low might form in the 380-391 region
** Just an idea NOT a forecast

"Short Setup on Corn (ZC1!)" by ThinkingAntsOk4 Hour Chart Explanation:
- Price bounced on the Resistance Zone (check it on the Weekly or Daily Vision).
- Price broke the Ascending Trendline.
- Price is, currently, on a Bearish Corrective Structure (ABC Elliot Count).
- If it breaks it at 4,215, the Short Move will be started.
- Our targets for that down move are the two Middle Support Zone and, finally, the Weekly Support Zone.
Check our Weekly and Daily Analysis. They can be really helpful for you!
Weekly Analysis:
Daily Analysis:

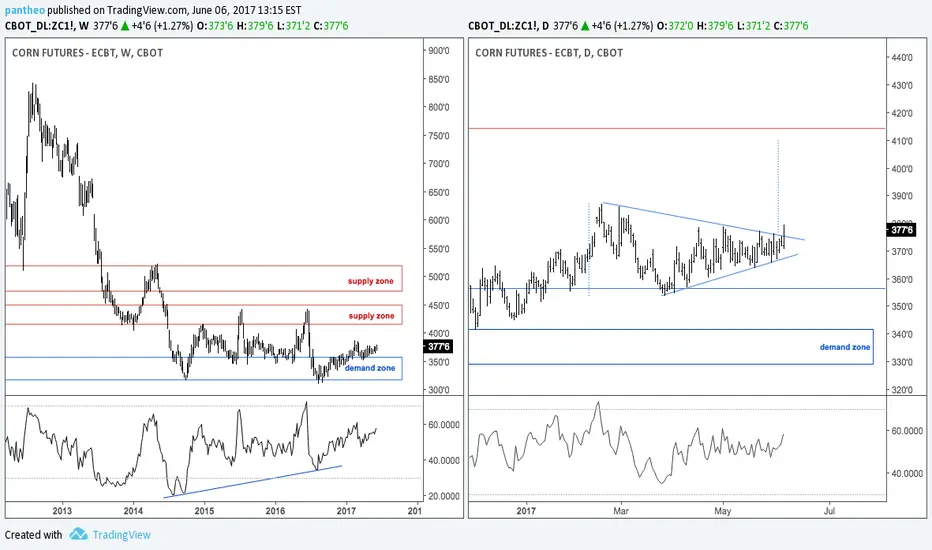
"Top and Bottom Analysis on Commodities: Corn" by ThinkingAntsOk4 Hour Chart Explanation:
- Price bounced on the Macro Resistance Zone and broke the Ascending Trendline.
- It is currently retesting the Resistance Zone (Pullback).
- If price starts its down path, we have two potential targets points: the Middle Support Zone at 3,782 and the Major Support Zone at 3,424.
Also, our Weekly and Daily Analysis are short views on the Corn.
Weekly Analysis:
Daily Analysis:

CORN LongCORN has broken out of a bullish descending wedge pattern to the upside, entered a bearish rising wedge, broken down and back-tested the previous resistance level before bouncing back. There are positive divergences on the charts which suggest a much longer up trend in play. These positive divergences can also be seen on the weekly and monthly charts of CORN which also firm up the thesis of a new long term uptrend. When measuring the height of the wedge pattern and adding it to the breakout point, the anticipated price coincides with a former support/resistance level.

CORN has reached exhaustion (for now)Yellow line is entry;
Stop loss is the red line;
Take profit are the green lines;

Corn Weather Market Losing Steam?
In the ZCZ2019 chart, I see the potential for another leg up however I believe it could retreat down to test the current support line. On 4/30 I bought corn around $3.80 feeling the low had been put in, after a few discomforting days I was correct. Due to delayed plantings and not optimal weather looking forward the market exploded up. I exited this position around the $4.40 range and enjoyed the nice profit, skeptical the market could not bust through the $4.54 price level.
Now that the market has broken through that level of $4.54 I am not adding to a Spec long position, while there is certainly upside potential left, I feel the market will struggle in the coming days and weeks to continue the great run it has displayed over the past weeks. That does not mean I am ready to initiate a short position, I feel the upside potential of 8.5% to the upside is still greater than a potential selloff.
I will be keeping a close eye on the market in the coming days and weeks if we do continue to rise an additional 8.5% and reach $5.00 +/- I will be preparing to enter the market as a bear. I do not forsee a freefall taking place but do see the potential for significant price reductions if we reach these levels. For the time being, I remain patient, sitting on my hands.
**Educational purposes only**

ZC1! - What to expect on the 4hr - CORN FUTURESSo check my last chart to see where I told you what needed to happen to get here. Spoiler alert. I was spot on. Now we have a fresh high and fresh failed to gain. Not a bad place to get short with tight stop just above previous highs. BUT TO TRULY KNOW IF THIS IS THE TOP... you have to lose the high. Look for a close below the last leg that took you up and then get short on the pull back to test that previous local high. This could be the last pullback before the drop, if there are no closes above the top green line. But typically there is a significant pull back after it close below the last leg up and thats usually where I get in on trend reversal signals.

ZC1! - Corn Futures - What to expect on 2hr.I like when charts show fresh highs, you just let it do its thing till it signals which way its about to go. Looking to get short on this one as its coming up to a nice past resistance level. Not financial advice. Trade safe.

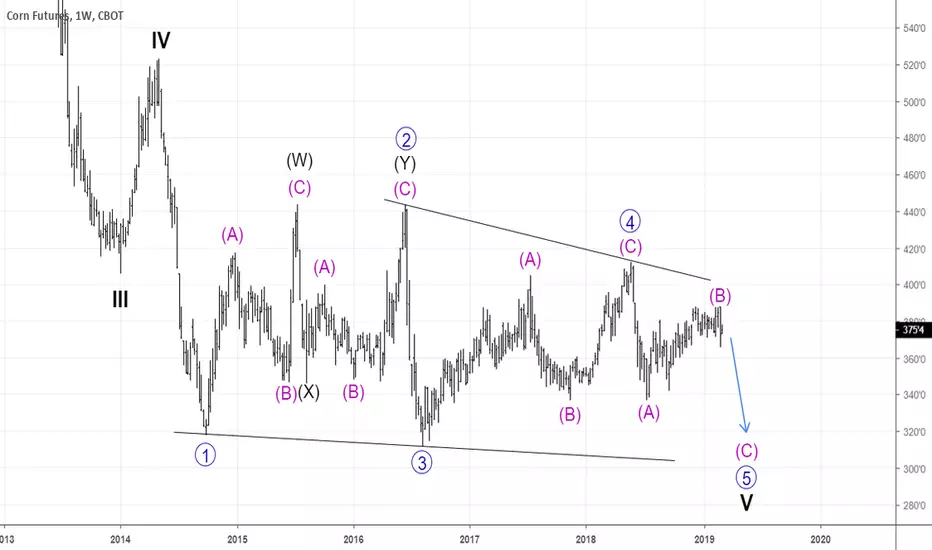
CORN DAILY CHART ANALYSISKey Level: 387’6
I’m working on the idea of triangle wave (B) complete and wave (C) is developing into 5 wave motive structure.
By using Elliot rule of “WAVE 2 never retrace 100% of wave 1”, we can establish an invalidation level that served as our key level of this analysis.
If wave (B) complete, corn has no business to go above 387’8 level and I’m looking forward to short with corn in wave 3.
Let’s see how corn market develop in the next coming days, week and month :D
Please leave a comment if you have any idea and suggestion to improve this corn analysis.
Happy trading

Corn: Moving sideways on 1W. Short.Corn has been practically neutral on 1W (RSI = 54.490, ADX = 23.173), trading sideways since mid July. With the price currently testing the inner 374'2 Resistance, we consider it to be high enough for a short towards the 0.618 1D Fibonacci = 356'6.

Corn forecast ZC1!Looks like a possible long setup for the short term, but beware of nearby resistance. Wait for confirmation.
Like this idea if you agree.
Follow me for more tips like this.

ZC1 uptrend resisting Fib levelCorn futures ZC1 have touched the 50% Fibonacci level on three occasions and failed each time. Looking for a reversal to the uptrend

Previous Target hit. 1D Channel Down continuation. Short.The TP = 372.20 has been hit and the 1D Channel Down (RSI = 37.956, Highs/Lows = -0.2679, B/BP = -1.4820) continues to deploy on a standard manner. Next TP = 337.20 which is the November 13, 2017 bottom and a very likely candidate for a rebound. If it breaks then 320.40 is next.

Break out point on 1DAfter breaking the 1D Channel Up (Highs/Lows = -12.9821, MACD = -1.170), Corn just bounced off the first important support at 380. We will either see a strong rebound here (long with tight SL, TP = 392.40) or if 379 breaks, it will look for the 372.20 support (TP = 374).


Corn: Bear Flag Under the TrendlineLooks like a flag to me.
My indicators do not yet align with the idea on this time frame...I will update using lower time frames below.
Also note the bearish 2618 set-up which completes @ 393.
If you have any comments or feedbacks on this idea or your own view on Corn, please share!

Wheat - Mar $4 Support?Bulled up... just a matter of weather* $4 support holds or we drop down to 3.5 levels
Trend line resistance erroded

Buying Corn @ the Bat @ Trendline; Aiming for the Bearish BatI wanted to show the longer term view. Corn has been bullish but I have patiently been waiting to short at the large bearish bat/2618 trade set-up (linked below).
However if you zoom in you can see the potential buy set-up near the trendline based on 2 different bullish Bat patterns (yellow and pink). I will be watching price action near their completion points to choose which to take. I will move stops to B.E at TP1 of the pattern I choose and will likely choose to aim for the entry of the bearish Bat which would make a great long trade.
(Note: the bearish Cypher (blue) is only valid if the bat patterns do not complete!)
