$ZEC 1D Update: Post-dev drama dump ZEC update.
Technically, this is a gnarly breakdown on the daily. Price has rejected the prior uptrend structure and is now putting in an impulsive leg lower, which usually means volatility is not finished yet. The bounce structure that was holding the higher lows has been lost, and we are back in “find the next real bid” mode rather than “trend continuation.”
Key levels I’m watching:
400 area (roughly where price is now) is a short-term pivot, but after this kind of sell candle it often acts as overhead supply on any bounce.
300–310 remains the major higher timeframe line in the sand. That level was the launchpad for the last expansion and the cleanest demand shelf on the chart. If we tag that zone, I’m watching for a reaction (slowing momentum, reclaim attempts, and better candle structure). If 300 loses on daily closes, the market likely needs more time to rebuild and the drawdown risk increases materially.
Fundamentals are messy right now and that matters for sentiment and liquidity. Multiple outlets are reporting that the entire Electric Coin Company team resigned / split following a governance dispute with Bootstrap (the nonprofit tied to ECC), and plans are being discussed around the team forming a new entity.
This doesn’t “kill” Zcash from a protocol standpoint (it’s open source and other contributors exist), but it does inject real uncertainty around coordination, roadmap execution, and optics, which can amplify volatility in the token.
DL News
How I’m treating it:
This is now a high-volatility, headline-sensitive environment. I’m not interested in guessing bottoms in the middle of a breakdown. I want to see where price stabilizes, and for me the most important read is the reaction at 300. If buyers can defend that zone and rebuild structure, it can set up the next tradable leg. If 300 fails, the market is telling us it needs a deeper reset before it can get “cooking” again.
Zec

$ZEC: Biggest Stress TestZcash just went through a major stress test. After the full Electric Coin Company team resigned, the market reacted fast with panic selling, pushing the price down roughly –30%.
CRYPTOCAP:ZEC briefly dipped near $380, the sell-off followed a governance dispute that led the ECC team to exit. This isn’t abandonment though — the same developers are regrouping under a new independent company and plan to continue building, including a new wallet based on the existing codebase.
TECHNICAL VIEW:
The main hurdle right now sits around the $460–490 area, lining up with the diagonal trendline resistance. Price has already struggled here multiple times, so another rejection could send CRYPTOCAP:ZEC back toward the $360 region. Ideally, this level holds — but if it doesn’t, a deeper pullback into the $300–250 demand zone wouldn’t be surprising.

ZEC: The Textbook Breakdown Everyone's IgnoringWe just witnessed a structural breakdown with conviction, CHoCH Bearish confirmed, 10.71% drop in 24 hours, and 264% above-average volume. This isn't retail panic. This is institutional money exiting positions. Price sits at $429.45 in equilibrium, and the structure is screaming continuation lower.
1. THE TECHNICAL REALITY 📉
• Ascending support trendline (27 touches) broken with authority
• Descending resistance at $506.70 (40 touches) remains the ceiling
• Converging wedge resolved bearish, technical target projects to ~$395
• Market structure has officially flipped from bullish to bearish
2. THE INDICATORS ⚖️
Bearish Signals:
• MACD deeply bearish at -18.6, no crossover in sight
• MFI at 27.3 confirms money flowing OUT
• Volume spike 264% above average validates the breakdown
• ADX at 19.9 suggests we're early in trend acceleration
Bullish Signals:
• RSI at 28.8 shows oversold conditions
• Stochastic at 33.3 hasn't hit peak capitulation yet
The Conflict:
Oversold doesn't mean reversal, it means momentum. High volume on breakdown with bearish divergence expanding tells us supply overwhelms demand. Room to run lower before true capitulation.
3. THE TRADE SETUP 🎯
🔴 Scenario A: Continuation Lower (Primary Path - 75% confidence)
• Trigger: Bounce into $445-$460 range (better risk-adjusted entry than chasing oversold)
• Entry: $445-$460 on relief rally into resistance
• Target 1: $404.34 (bullish OB demand zone)
• Target 2: $380.85 (24h low, extended target)
• Stop: Above $529.90 (bearish OB, 4H close above this breaks the down structure)
• R:R: ~2.5:1 on conservative target
🟢 Scenario B: Structural Reversal
• Trigger: 4H candle close above $529.90 (bearish OB)
• Entry: Reclaim of premium zone above $509.42
• Target: Retest descending resistance at $506.70+
• Invalidation: Failure to hold above $509.42 after reclaim
MY VERDICT
The setup favors shorts on bounces, not longs on dips. Structure broken bearish, volume confirms it, path of least resistance is down to $404. If you're holding longs from higher, the market just told you the story changed.

$ZEC 1D update: The trend has been bucked, monitoring... ZEC has now dumped back down decisively, and attention shifts straight back to the $300 level.
The recent breakdown from the rising channel confirms that the prior uptrend leg has been interrupted. What initially looked like consolidation has resolved lower, with expanding volatility and an impulsive move down, which usually signals unfinished business to the downside rather than an immediate reversal.
The $300–310 zone is once again the key level that matters. This area previously acted as a major demand base and launch point for the last expansion. A controlled move into that region with slowing momentum would still fit a broader bullish digestion narrative. However, a fast loss of $300 on a daily closing basis would materially weaken the structure and open the door to deeper retracement.
From a market behavior standpoint, this type of flush is not unusual for ZEC. It tends to overshoot, shake out late positioning, and only then form a more durable base. For now, I’m treating this as a volatility phase rather than assuming the larger trend has already resumed.
Bias here is cautious and reactive. I’m watching how price behaves as it approaches $300, not trying to front-run a bounce. The reaction at that level will determine whether this is just another reset before continuation, or something that requires more time to rebuild structure.

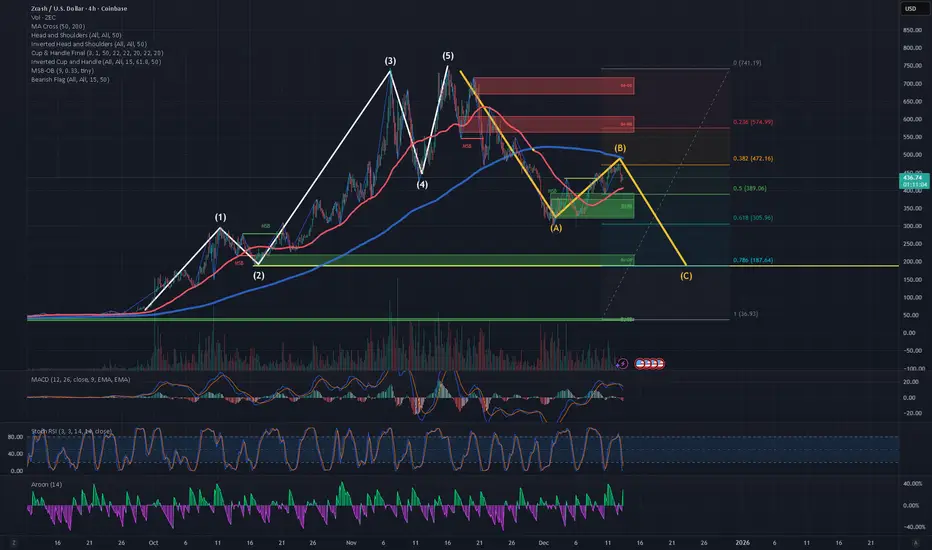
ZEC Analysis (4H)The bullish and upward structure of ZEC appears to be completed, and from the point where we placed the red arrow on the chart, its bearish phase seems to have begun.
It now looks like we are in wave B of the bearish phase, and it is expected to drop from the red zone toward the targets marked on the chart.
The targets are clearly indicated on the chart.
A daily candle closing above the invalidation level will invalidate this analysis.
For risk management, please don't forget stop loss and capital management
When we reach the first target, save some profit and then change the stop to entry
Comment if you have any questions
Thank You

ZEC 1D Update: Bucking the uptrend again ZEC is bucking the uptrend again in the short term, and the price action is starting to look more volatile rather than clean continuation. After riding the rising channel higher, price has rolled over near the upper portion of the structure and is now slipping back toward the mid-range instead of holding the highs.
This kind of behavior usually signals that the market isn’t ready to trend yet. Momentum has cooled, upside follow-through stalled, and price is breaking short-term support, which opens the door for more back-and-forth and potentially another push lower before any sustained move higher develops.
Importantly, this doesn’t break the broader bullish structure. As long as the larger support levels hold, this still looks like digestion after a strong advance rather than a full trend failure. ZEC has a history of being messy before it really starts moving, and this volatility fits that pattern.
My base case here is more chop and possibly lower prices in the near term, shaking out late longs and resetting momentum. If that happens while higher timeframe support remains intact, it likely sets the stage for a stronger move once it finally gets cooking. For now, patience matters more than prediction.
Zcash - Time to buy again!The price on the 6h timeframe is within an ascending triangle, which can be promising. If the price breaks this pattern with bullish candles, it could easily rise by the distance of AB=CD.

ZEC — Daily & 4H Bias (Long & Short Scenarios)Price broke out of the prior consolidation around 449.46, where buyers stepped in on the 4H timeframe. This was confirmed by a bullish engulfing move, followed by a brief pause near 472.13.
However, the bullish momentum weakened as price entered a higher-timeframe supply zone (513.70 – 554.93) — a previous sell-off area. Although price swept above this zone, it failed to sustain acceptance and began to reverse
From there:
Market broke initial structure
Printed a lower low, followed by a reaction from buyers
Price pushed up to 536.37, but momentum was insufficient to break the prior high
This formed the first lower high
A subsequent sell-off broke the previous low, creating a new low at 480.32
Another push up failed again, forming a second lower high
With two confirmed lower highs and lower lows, market structure currently favors continuation to the downside.
Trade Scenario's
Short bias:
Shorting at market offers poor R:R.
A more favorable setup would be a limit short around 523.59, within the supply zone.
Long bias:
Alternatively, price may retrace into daily demand (435.71 – 449.46), where a long setup could form if buyers step in.
Both scenarios are marked on the chart — patience and confirmation are key.
Appreciate everyone’s input. If you have a different bias, feel free to share.
Follow my journey on X: @CTucker99670
I’ll be actively posting my market bias and learning progress.
Happy trading 📊

ZEC looks short.BINANCE:ZECUSDT.P
It looks short. I would short the areas of the first liquidity accumulation on the hourly chart. I have indicated all ranges on the chart. Set a stop above the December highs.
Use your risk management (RM).

ZEC/USDT – Head & Shoulders Pullback within Rising ChannelHi!
Pattern: Head & Shoulders (short-term correction)
Trend: Overall bullish (ascending channel intact)
➡️ After forming a Head & Shoulders near the top of the channel, price saw a healthy pullback
➡️ Price is now approaching the lower boundary of the rising channel, which acts as strong dynamic support
➡️ As long as this support holds, the broader uptrend remains valid
🎯 Bullish Targets:
TP1: 520
TP2: 550
A deeper correction is possible, but buyers are expected to step in near channel support

ZEC / USD – Daily – Structural Update (Bullish going into 2026)ZEC remains in a higher timeframe uptrend despite the recent pullback. The move lower from the recent highs is corrective in nature and fits within a rising channel structure that developed after the strong bounce from the $300 region. No daily lower low has formed, keeping the broader bullish structure intact.
The $300–310 zone remains the most important level on the chart. This area marks the macro breakout base and prior demand. As long as daily closes hold above this level, the bullish thesis remains valid and the trend favors continuation into 2026 rather than a full reversal.
Price is currently consolidating between roughly $450 and $550. This zone is acting as a compression area following the last impulse leg. Dips into the $420–450 region have been bought and continue to form higher lows, suggesting accumulation rather than distribution.
A sustained reclaim and hold above the $520–550 range would signal trend continuation and open the door for a move toward $600, followed by $680 and potentially the upper channel region near $750–800 over time.
Volume behavior supports this view, with expansion on upside moves and contraction on pullbacks. Momentum has cooled but remains constructive, resetting conditions for another expansion leg rather than signaling exhaustion.
The primary risk to this view is a daily close below $300, which would break the macro structure and invalidate the bullish continuation scenario. Until that occurs, this remains a buy-the-dip environment, favoring patience and entries on controlled pullbacks rather than chasing strength.
Overall bias remains bullish, with ZEC consolidating above its breakout base and positioning for potential continuation into 2026.

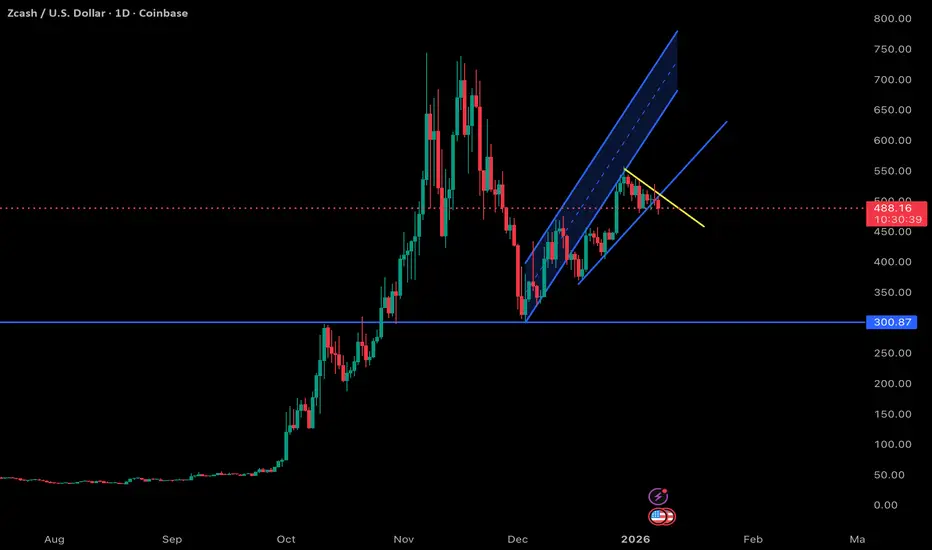
ZEC Update: Fighting back with force ZEC Update: ZEC continues to strengthen structurally, with price firmly back inside the rising channel and now pushing higher within a well-defined uptrend. The prior downside thesis has been fully invalidated, and the reclaim of the channel has clearly shifted momentum back in favor of the bulls. Price is holding above the mid-channel region and printing higher lows, which is exactly what you want to see if this move is going to continue.
The reaction off the ~300 level was the key inflection point. That level acted as a higher timeframe demand zone, and the subsequent impulsive move higher suggests strong acceptance rather than a temporary bounce. Since then, ZEC has respected the lower boundary of the channel, using it as dynamic support, which reinforces that this is trend continuation rather than a corrective retrace.
Short term, price is consolidating around the low-500s, which looks constructive. This kind of sideways-to-slightly-up consolidation within an uptrend often resolves higher, especially when it occurs above prior resistance. The projected path (yellow) highlights a scenario where ZEC continues to grind higher with some volatility, using pullbacks to reset momentum before pushing toward the upper channel region.
As long as ZEC remains inside this rising structure, the bias stays bullish. Any pullbacks into the lower channel or prior breakout areas would be considered normal trend behavior, not weakness. A loss of the channel would be the first sign that momentum is fading, but until that happens, structure favors continuation.
Overall, this looks like a strong recovery phase following a failed breakdown, with ZEC transitioning back into trend mode. Patience remains important, but the technical picture continues to improve as long as price holds this uptrend structure and avoids a decisive breakdown back below it.

ZEC/USDT - Symmetrical Triangle Before the Next Big Move?ZEC/USDT on the daily timeframe is currently showing a major consolidation phase after a strong impulsive rally. Price action is moving sideways with decreasing volatility, indicating a critical decision zone where the market is preparing for its next major move.
The overall structure clearly forms a Symmetrical Triangle, reflecting a balance between buyers and sellers.
---
Pattern Explanation
The visible pattern is a Symmetrical Triangle, characterized by:
Lower Highs (LH) forming a descending resistance line
Higher Lows (HL) forming an ascending support line
Gradually decreasing volatility during the pattern formation
This pattern is considered neutral by nature:
Upside breakout → bullish continuation
Downside breakdown → deeper correction or distribution
Since this structure forms after a strong uptrend, traders should also be cautious of potential fake breakouts.
---
Key Levels
Major Resistance:
700 – 750 USDT (previous high & strong supply zone)
Triangle Resistance:
Upper boundary of the triangle (dynamic resistance)
Triangle Support:
Lower boundary of the triangle (dynamic support)
Key Supports:
518 USDT
Psychological support zone at 440 – 460 USDT
---
Bullish Scenario
Price breaks above the upper triangle resistance with a strong daily close
Volume expansion confirms the breakout
Upside targets:
Target 1: 700 USDT
Target 2: 750 USDT (previous high)
Extended target: 850 – 900 USDT if bullish momentum continues
A valid breakout would indicate trend continuation and the beginning of a new markup phase.
---
Bearish Scenario
Price fails to break the triangle resistance
Breakdown and daily close below the triangle support
Selling pressure increases
Downside targets:
Target 1: 518 USDT
Target 2: 460 – 440 USDT
Worst case: retest of the previous demand zone below
A confirmed breakdown suggests distribution and a healthy correction before any potential long-term continuation.
---
Conclusion
ZEC/USDT is currently at a critical decision point. The Symmetrical Triangle structure signals compressed price action and stored momentum. The breakout direction will define the next major trend, making confirmation candles and volume essential before entering any position.
Patience is key — avoid entries inside the triangle and wait for confirmation.
---
#ZEC #ZECUSDT #Zcash #CryptoAnalysis #TechnicalAnalysis #SymmetricalTriangle #ChartPattern #Breakout #AltcoinAnalysis #CryptoTrading

FireHoseReel | ZEC at a Critical Range Breakout Ahead🔥 Welcome To FireHoseReel !
Let’s dive into ZCash (ZEC) analysis.
⛳️ ZEC Fundamental Overview
Zcash (ZEC) is a long-standing privacy-focused cryptocurrency, usually ranked around #16 on CoinMarketCap, enabling users to send private, non-traceable transactions with strong cryptographic privacy.
👀 ZEC 4H Overview
On the 4-hour timeframe, ZEC is trading inside a range box with resistance at $457 and support at $374. Price has reached the upper-middle area of this range, and a breakout above the range high or the midline could drive the next move toward the following resistance or support level.
📊 Volume Analysis
Zcash volume has declined over the past few days, but in the last few hours buyers have shown strength by forming a higher low. A strong volume blow-off candle has entered the market, indicating renewed buying interest.
✍️ ZEC Trading Scenarios
🟢 Long Scenario:
ZEC is currently pressing against the mentioned resistance. A breakout above this level, supported by increasing buying volume and RSI crossing above the 70 momentum threshold into overbought territory, could confirm the breakout and open the path toward the next resistance.
🔴 Short Scenario:
A breakdown below the box midline at $374, accompanied by visible selling pressure and RSI dropping below the 33 momentum zone, could trigger a move down toward the next support level.
🧠 Protect your capital first. No setup is worth blowing your account. If risk isn’t controlled, profit means nothing. Trade with rules, not emotions.

Ascending triangle in playAscending triangle is building its third wave. Watching for breakout back towards the yearly high.
Very Bullish

ZCASH expected to crash brutally to $32.00Zcash (ZECUSD) has been the revelation of this Bull Cycle as it's been the last major coin to rally from mid September to mid November, outside of the main Altseason. It broke above last Cycle's Top but for more than a month, it's been showing clear signs that the market has peaked. The last indicator to confirm that is the 1W MACD, which has completed a Bearish Cross.
ZEC's main long-term pattern has been a Channel Down since the February 20 2017 Low and the recent Cycle Top is technically a Lower High, which structurally initiates a Bearish Leg. This Bearish Leg is the market's new Bear Cycle.
The previous two Bear Cycles bottomed on the 1.05 Fibonacci extension, dropping dramatically by -97.94% and -95.78% respectively. As a result, we have a minimum Target of $32.00 (-95.78%) and can see an overextension to $13.00 (Fib 1.05), which is riskier. The most effective indicator for a long-term buy again regardless of the price, is when the 1M MACD forms a Bullish Cross.
Also, see how well the Sine Waves grasp the cyclical behavior of this pattern, timing both the Tops and Bottoms very well. We also need to mention the 1W Golden Cross, which seems to be formed just before a Bull Cycle peaks.
---
** Please LIKE 👍, FOLLOW ✅, SHARE 🙌 and COMMENT ✍ if you enjoy this idea! Also share your ideas and charts in the comments section below! This is best way to keep it relevant, support us, keep the content here free and allow the idea to reach as many people as possible. **
---
💸💸💸💸💸💸
👇 👇 👇 👇 👇 👇

ZEC starting wave C of correctionOn the four-hour time frame, the Aroon indicator is positive and showing green because of the recent strong upward price movement. The Aroon is reflecting the impulsive advance that occurred between December 1st and December 12th, which I am interpreting as Wave B.
Prior to this, there was a clear five-wave impulsive move upward, and price now appears to be in a three-wave A–B–C corrective structure. I believe that Wave B of this corrective move is nearing completion, and that price is now beginning the decline associated with Wave C.
I believe the likelihood of further downard movement to fullfil wave C of the current three wave A-B-C structure is high, like 60 to70% based on the following reasons:
Four-hour and twelve-hour structure is corrective / weakening
Momentum (MACD) has rolled over
RSI is not resetting bullishly
Aroon suggests trend strength is fading, not expanding
Elliott interpretation of Wave B nearing completion is plausible
In theory, the chart says "down to $200", but the reality is that buyers have been very active, both humans and algorithims. It seems like any price below $400 is good buy for ZEC.
$200 represents a tail-risk scenario
$330 - 350 represents a behaviorally supported zone
In my view buyers will defend the $330 to 350 price point.
This analysis represents a probabilistic scenario rather than a guarantee, and invalidation would occur if price reclaims key resistance with expanding momentum.
This post is Not Financial Advice.
ZEC minor pull back in playZEC had a nice run up from 18 December's $383 to today's $457, and I expect a cup and handle to form, with the most likely retrace to 426.50 followed by potential wicks or pressure at $417, and $412.

ZEC Sell/Short Signal (4H)The overall trend of ZEC is clearly bearish.
A bullish move occurred to collect liquidity, and the price has now been rejected. A deep drop is expected.
We have identified two specific entry points where positions should be built using a DCA strategy. The targets have been marked on the chart.
Do not enter the position without capital management and stop setting
Comment if you have any questions
thank you

ZEC Sell/Short Setup (1H)Use this setup as a scalp, not a swing trade.
Since price has reacted to a major supply zone and has formed a CP pattern below the supply, a drop is expected.
Make sure to move your stop to breakeven at the first target.
The targets are clearly marked on the chart.
For risk management, please don't forget stop loss and capital management
When we reach the first target, save some profit and then change the stop to entry
Comment if you have any questions
Thank You

ZEC Update: Back into this uptrend zone ZEC Update: My prior downside thesis is now invalidated. ZEC has pushed back into the former rising channel and is showing acceptance inside the uptrend zone, which forces a reassessment of structure. The breakdown attempt failed, and instead of follow-through to the downside, price reclaimed key levels and held, shifting the short-term bias back to the upside.
Structurally, reclaiming the channel is important. Failed breakdowns often act as fuel in the opposite direction, especially when price can hold above the lower channel boundary and build higher lows. As long as ZEC remains inside this structure, the move off the ~300 region looks less like a dead cat bounce and more like a continuation attempt.
That said, this is still a reclaim phase, not confirmation of a full trend extension yet. The mid-to-upper channel and prior resistance around the mid-400s will be key areas to watch for acceptance versus rejection. Strong continuation would require follow-through and sustained closes inside the channel, while a loss of the lower boundary would quickly put the downside back in play.
For now, I’m respecting the invalidation and adjusting accordingly. Bias shifts bullish while price holds this uptrend structure, with risk clearly defined against the lower channel support. This is a good reminder to stay flexible and let price lead, not prior expectations.

ZEC Update: Relief pump taking place, weary of further breakdownZEC is seeing a relief pump exactly as anticipated by the projected path (yellow), following the prior breakdown from the rising channel. This bounce so far looks reactive rather than impulsive, driven more by short-term positioning and broader market relief than any meaningful shift in structure. The key question now is whether price can reclaim and hold back inside the former channel.
At this stage, I remain skeptical. While price has pushed back toward the lower channel boundary, this area is still acting as resistance rather than support. Failed breakdowns typically require a strong, decisive reclaim with follow-through, and so far this move lacks the momentum and volume profile I’d want to see to confirm acceptance back inside the channel. As long as ZEC remains below that structure, this bounce should be treated as corrective.
Structurally, the broader picture still favors downside continuation. The rising channel itself formed after a sharp selloff, making it a counter-trend consolidation rather than a base. Breaking down from that pattern, even with a relief rally afterward, usually resolves with further downside once the bounce exhausts. In that context, this move looks more like a reset of short-term oversold conditions than the start of a sustained reversal.
Zooming out, this continues to align with the broader crypto environment, where markets are chopping and attempting relief rallies while higher timeframe trends work through distribution and leverage cleanup. In these phases, failed reclaims and lower highs are common, especially for higher beta assets like ZEC.
Unless price can cleanly reclaim the channel and hold above it, I expect this relief rally to fade and lead to another leg lower, with the ~300 area remaining the primary level of interest on the downside. That zone would represent a deeper structural test and likely determine whether ZEC can establish a more durable base or needs additional time to consolidate. For now, the bias remains cautious, treating strength as corrective until proven otherwise.

Zcash ZEC Update: Breakdown confirmed, hold your horses ZEC Update: Price has now decisively broken down from the rising channel, and the attempted reclaim back into the structure failed, confirming this move as corrective rather than trend continuation. Former channel support in the 390-400 region is continuing to act as resistance, and the inability to hold above it reinforces that sellers remain in control. Structurally, this shifts the bias back to the downside, with price likely to remain under pressure into year end.
From a broader perspective, this lines up with the wider crypto market showing signs of distribution and risk-off behavior following the recent expansion phase. As liquidity tightens and momentum cools across majors, higher beta and narrative-driven assets like ZEC tend to retrace deeper and test higher timeframe levels. In that context, continuation back toward the ~300 HTF support zone makes the most sense from both a technical and macro standpoint.
The ~300 level is especially important here. This would be a second test of what has recently flipped from resistance to support, making it a true validation level. A strong reaction would suggest acceptance of this zone as a higher low within a larger cycle, while a weak or impulsive break would open the door to further downside and a longer basing process. I’m cautious here, as second tests often determine whether a level holds structurally or fails outright.
Assuming the market continues to flush and reset into early next year, I’d expect conditions to improve closer to February once excess leverage and weak hands are cleared out. Until then, the focus remains on respecting structure, managing risk, and letting price confirm before getting aggressive. For now, this looks like consolidation and downside continuation within a broader market reset rather than the start of a new uptrend.
