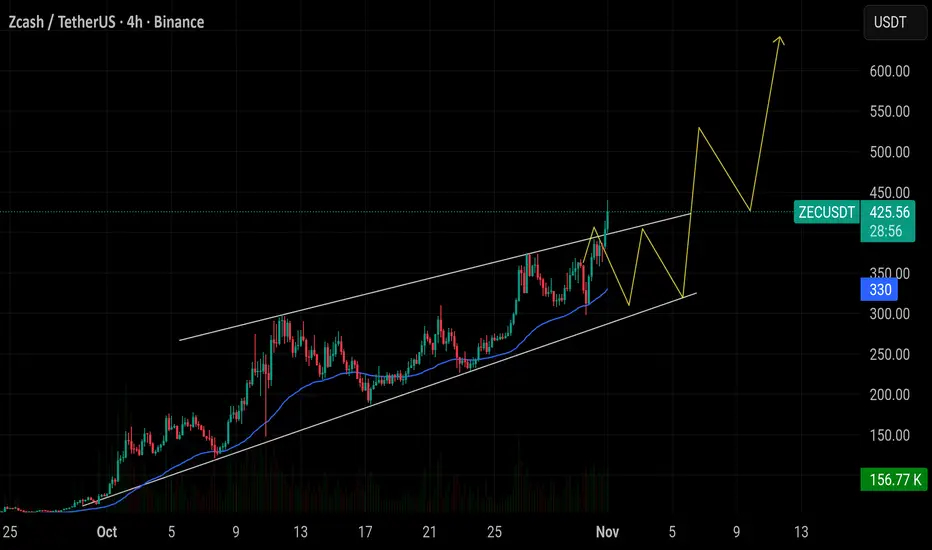
ZEC - BEARISH SETUP For me CRYPTOCAP:ZEC hitted the top here, and the FOMO wave is likely over! 🔴
I expect to see a 20%+ bearish correction from the 440$ resistance! 📉
After the beautifull setup shared this morning , I shorted the 420$ area again!
I keep an eye on the 280 - 290$ level as potential next bottom! 🍿
#ZEC #DYOR 📉
Zec

$ZEC/USDT successfully retested the $308 zone at the 50 EMA. $ZEC/USDT successfully retested the $308 zone at the 50 EMA and bounced strongly upward. The breakout above $400 confirms a clear bullish continuation pattern. With the retest already completed, momentum now favors further upside. As long as the price holds above $400, ZEC remains in a strong uptrend. The next target zone is between $500 and $600.
Bull flagPerfect setup. It's knocking on heaven's door. Will likely reject and dance within its parameters. But when it punches through, next stop is $420.69.

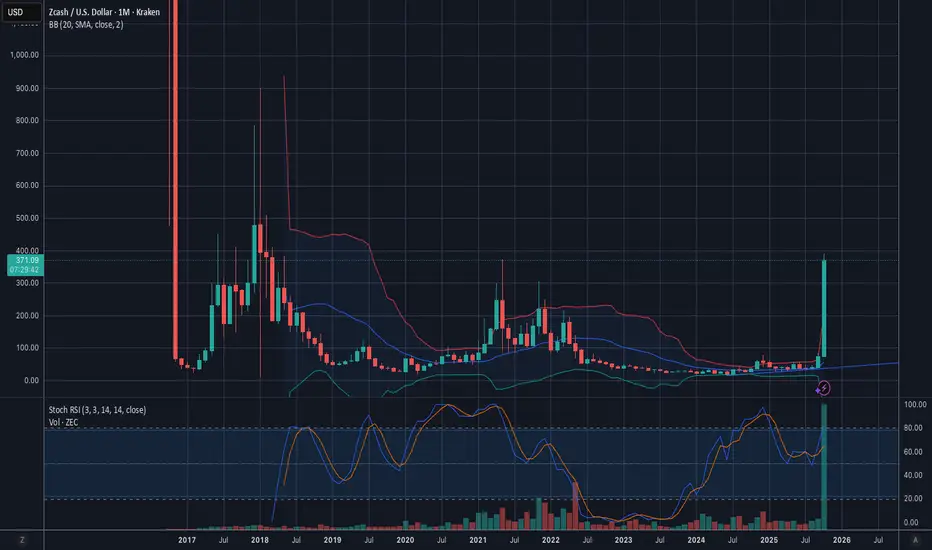
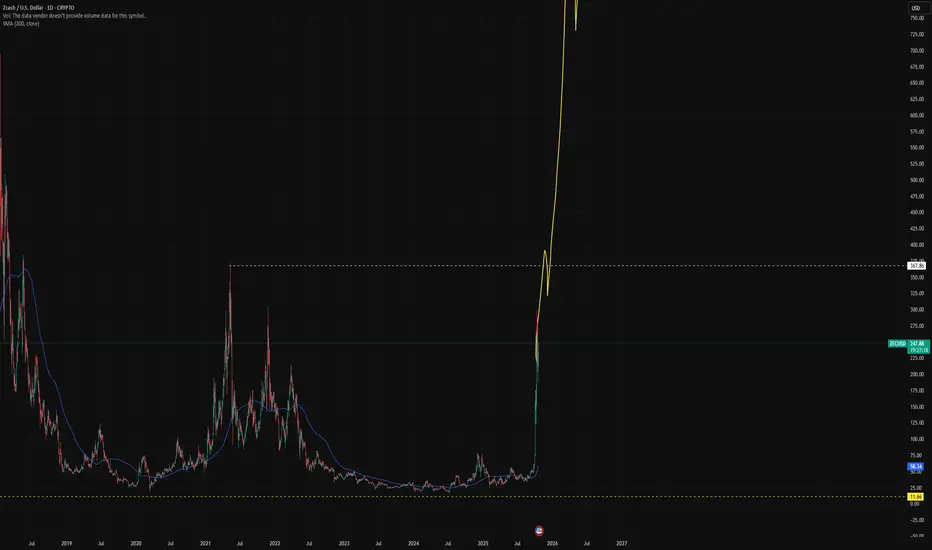
ZEC not a secret anymore with a bullish monthly close incoming ZEC has been unreal and life changing.
But this is only the beginning.
Zcash will print another candle on the monthly chart today.
The asset is looking for support above the 2021 top.
All signs are pointing to this happening.
ZEC has on exchange price history at $30k and beyond a coin.
The buy volume on the monthly chart is massive.
It's time to lock in. Tf in.
My intent for your reality is the same bliss I am seeking.
#ZECUSDT #1D (ByBit) Rising wedge near breakdownZcash had a great bull run but looks exhausted right now on daily TF.
It's printing a bearish divergence between price and volume + RSI, a retracement seems likely.
⚡️⚡️ #ZEC/USDT ⚡️⚡️
Exchanges: Bitget Futures
Signal Type: Regular (Short)
Leverage: Isolated (3.0X)
Amount: 3.9%
Current Price:
353.99
Entry Zone:
355.71 - 392.39
Take-Profit Targets:
1) 298.48
2) 241.58
3) 184.67
Stop Targets:
1) 437.28
Published By: @Zblaba
CRYPTOCAP:ZEC BYBIT:ZECUSDT.P #1D #Zcash #Privacy z.cash
Risk/Reward= 1:1.2 | 1:2.1 | 1:3.0
Expected Profit= +60.6% | +106.2% | +151.9%
Possible Loss= -50.7%
Estimated Gaintime= 1-2 months

Scalp Short – ZEC💎 Scalp Short – ZEC
Higher timeframes show overbought conditions, while trading volume is weakening.
Price action signals a potential correction phase after recent strength.
🎯 Plan:
→ Enter after confirmation of rejection from resistance.
→ TP: 355.9 | SL: 374.58 | RR: 1 : 1.85
Momentum favors short setups.
Keep positions light, trail SL as price drops.
Stay patient — wait for clear confirmation before entry.

Can LITECOIN copy ZEC's enormous rally?Zcash (ZECUSD) marginally broke its May 10 2021 Cycle Top (orange trend-line) this week, rising by more than +800% in just 2 months.
Throughout its trading history, it has been tightly correlated with Litecoin (LTCUSD). It's not uncommon to see ZEC lead the way and then LTC (purple) follow. As this chart shows, whenever the two diverged, the one always caught up with the other and converged again.
Does this mean that LTC will eventually catch up to this enormous rally? If it does indeed, the Top of the previous Cycle that it 'has to' fill is at $415.
-------------------------------------------------------------------------------
** Please LIKE 👍, FOLLOW ✅, SHARE 🙌 and COMMENT ✍ if you enjoy this idea! Also share your ideas and charts in the comments section below! This is best way to keep it relevant, support us, keep the content here free and allow the idea to reach as many people as possible. **
-------------------------------------------------------------------------------
💸💸💸💸💸💸
👇 👇 👇 👇 👇 👇

ZECUSDTMy idea is bullish for BINANCE:ZECUSDT .
But keep 220$ support.
Next target is 290 - 370
Support: 220 - 1755 - 125 - 78
⚠️Please control risk management.

Examples of Chart Interpretation Methods
Hello, fellow traders!
Follow us to get the latest information quickly.
Have a great day!
-------------------------------------
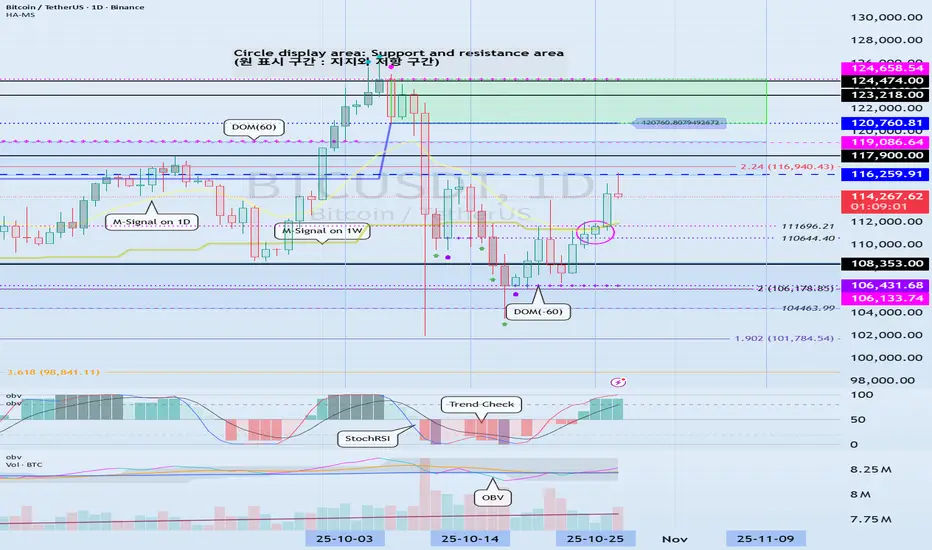
#BTCUSDT
To break above a key point or range and continue the uptrend,
1. The StochRSI indicator must be trending upward. Ideally, it should not enter the overbought zone. 2. The On-By-Signal (OBV) indicator must show an upward trend. If possible, it should remain above the High Line.
3. The TC (Trend Check) indicator must show an upward trend. If possible, it should remain above the 0 level.
Currently, only the TC indicator satisfies the above conditions.
Therefore, if the price remains above the 110644.40-111696.21 range and the above conditions are met, we should see if the price rises above 116259.91 and remains there.
If the On-By-Signal (OBV) indicator remains above EMA 1 and EMA 2 and rises above the High Line, further upside is likely.
However, if the K indicator of the StochRSI indicator enters the overbought zone and the slope changes, the upside may be limited.
When the TC (Trend Check) indicator touches its highest point, there's a high probability of forming a new high, so you should consider a response plan.
Summary of the above:
Support Zone: 110644.40-111696.21
Resistance Zone: 116259.91-119086.64 (up to 124658.54)
------------------------------------
#ETHUSDT
As mentioned in the BTC chart description, ETH is also showing similar movements.
However, the OBV indicator is just about to break above EMA 1 and EMA 2, so if it finds support near 4109.80, there's a possibility of further upside.
-------------------------------------
#ZECUSDT
Based on the BTC chart description, ZEC is likely to continue its upward trend.
The chart is broken due to the sudden surge, making it difficult to determine the duration of volatility.
--------------------------------------------
#XRPUSDT
The key is whether the price can find support at key support and resistance levels and rise above 2.9092.
------------------------------------------
Ultimately, trading will be based on the support and resistance levels drawn on the 1M, 1W, and 1D charts.
However, it is recommended to use auxiliary indicators to confirm whether to initiate a trade.
The basic trading strategy is to buy in the DOM(-60) ~ HA-Low range and sell in the HA-High ~ DOM(60) range.
However, if the price rises in the HA-High ~ DOM(60) range, a step-up trend is likely, while if the price falls in the DOM(-60) ~ HA-Low range, a step-down trend is likely.
Therefore, a fractional trading strategy is recommended.
In this context, the coin (token) currently closest to buying is XRP.
-
Thank you for reading to the end.
I wish you successful trading.
--------------------------------------------------
ZCASH Breaks 3-Year Accumulation!$ZCASH has finally broken above its 2021 high after spending over three years in a long accumulation phase. This breakout above the major resistance zone signals a clear shift in momentum and could mark the start of a strong bullish cycle.
As long as the price holds above the breakout zone, the structure remains solid, any retest toward $240–$260 could offer a healthy entry point before the next leg higher. Momentum looks powerful here.
DYOR, NFA

Zcash (ZEC/USDT): Bullish Reversal Confirmed from QML ZoneHi!
Zcash is currently showing a potential bullish structure following the completion of a QML (Quasimodo Level) pattern around the $220–$230 demand zone.
After the previous high was engulfed, the price retraced deeply into the QML zone, forming a higher low and respecting the ascending structure highlighted by the trendline. This indicates that buyers are gradually regaining control.
The recent bullish impulse from the QML zone aligns with the ascending channel, suggesting that as long as the price remains above the lower boundary, the short-term bias stays bullish.
If the momentum continues, the next key resistance levels to watch are:
$280–$300 → mid-channel resistance and previous supply area
$340–$360 → upper boundary of the channel and extended target
On the other hand, a break below $230 (QML invalidation) would signal weakness and could trigger a deeper correction toward the $190–$200 demand zone.

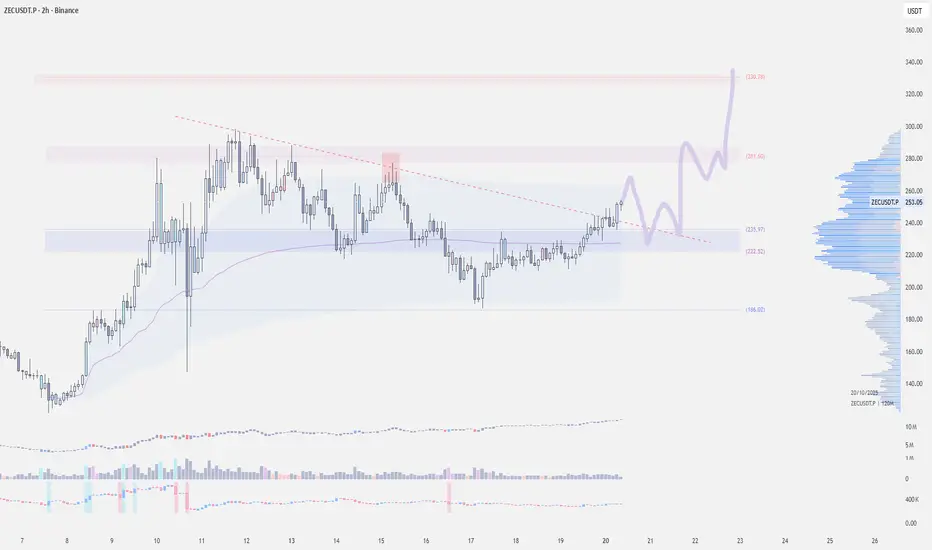
ZECUSDT - another leg up ahead!Keep your eyes on it — just like I told you before. Its target was $250–$280, and it actually hit $298 exactly. It then entered a temporary corrective phase, forming a falling wedge pattern.
This coin is an ideal pick for the current phase, and don’t worry — its bullish run isn’t over yet.
Next target: $360. I’ll keep posting updates about it regularly.
Best regards:
Ceciliones🎯

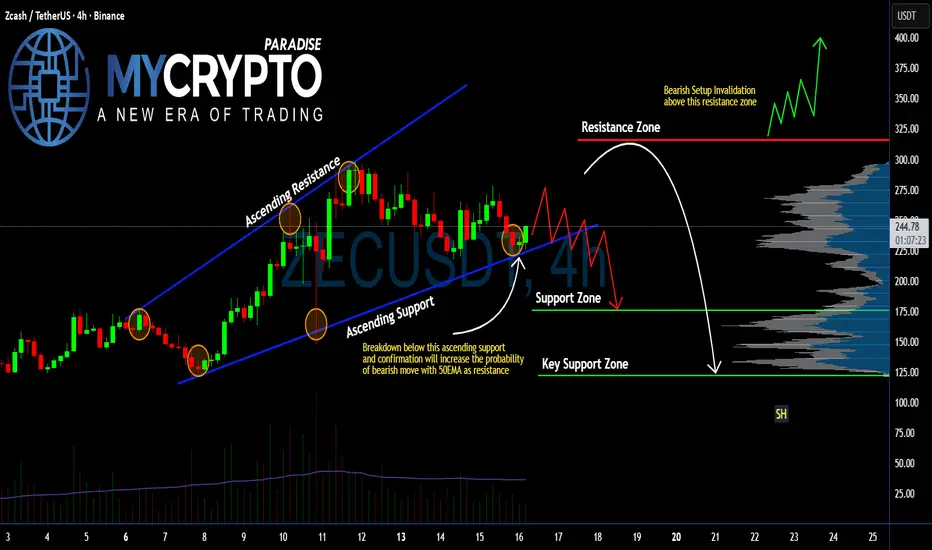
ZECUSDT Breakdown Incoming? Don’t Get Caught Long!Yello, Paradisers! Have you been paying attention to what’s happening on ZECUSDT lately? If not, now’s the time to look closely—because the signs of an incoming bearish move are stacking up fast, and getting caught on the wrong side could be costly.
💎Right now, ZECUSDT is reacting directly from a key 4H resistance zone, and the price structure is showing some serious warning signals. We’re seeing the formation of a clear Head & Shoulders pattern, which is one of the most reliable bearish reversal setups. On top of that, there’s bearish divergence showing up—indicating that upside momentum is fading, even as price attempts to push higher.
💎This kind of setup is what experienced traders wait for. For aggressive traders, there’s already a potential short opportunity from current levels. However, if you're more conservative (as you should be in this kind of uncertain environment), it's smarter to wait for a pullback and then look for a clear bearish candlestick formation. That confirmation will not only improve the probability of success but also provide a much more favorable risk-to-reward ratio.
💎But caution is key here. If price breaks and closes above the resistance zone, this whole bearish idea becomes invalid. In that case, the best move is to stay patient and wait for clearer price action before making any decisions. Jumping in early without confirmation is what wrecks most traders.
🎖Strive for consistency, not quick profits. Treat the market as a businessman, not as a gambler.
MyCryptoParadise
iFeel the success🌴

ZEC Head & Shoulders Breakdown – Dead Cat Bounce Setup?ZEC has broken down after completing a fairly large head-and-shoulders pattern, which typically signals bearish momentum. The neckline break triggered a sharp sell-off, putting pressure on support zones. Price action suggests that a rebound may be in play soon as the market searches for a local bottom.
👀 Key Zone to Watch: The $215–$210 range is the ideal bounce zone, where buyers may step in for a classic dead cat bounce. This area has confluence with prior structure and should attract tactical entries. A strong reaction here could open the door for a smart pump.
🎯 Trade Plan:
Entry Zone: $215–$210
Take Profits: $235 / $250 / $270
Stop Loss: Close below $207

ZEC on Deck — Correction CheckI expect a correction on ZECUSDT.
My downside targets are:
1️⃣ 210
2️⃣ 188
3️⃣ 156
The invalidation zone is marked in red on the chart.

ZECUSD - Oh no are we in bear market since 2 weeks ? want to finish on a good working idea before stoping publishing hehe
this double bottom formation has been seen too much time lately
I entered now
SL : 340 for now, will update lower at 310 when white trendline broke down
Also depends on BTC reaction but i think daddy is going to see 100k or sub 100k first before going a bit up (last rejection made me switch bear for some days)
first TP : 155
second TP : 60/70
Cheers not advice

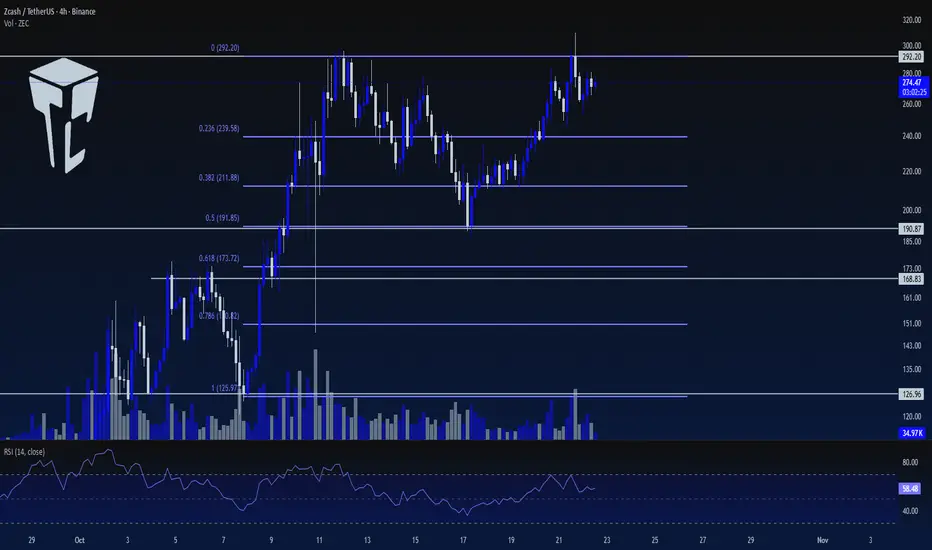
TradeCityPro | ZEC: Bullish Structure Holding Strong👋 Welcome to TradeCity Pro!
In this analysis, I want to review the ZEC coin for you — one of the Privacy and Layer 1 projects, ranked 28th on CoinMarketCap with a market cap of $4.42 billion.
⏳ 4-Hour Timeframe
This coin has a bullish trend on the 4-hour timeframe and, after its upward movement, has now entered a corrective phase.
🔍 This correction has reached the 0.5 Fibonacci level of the previous wave, and the price has now returned to the 292.20 zone, having already reacted to it once.
✔️ Breaking the 292.2 level could mark the beginning of the next bullish wave. From a momentum standpoint, the bullish trend is very strong, and with the breakout of 292.2, the momentum will likely continue.
⚡️ Currently, the volume favors buyers, and as the price approaches the 292.2 zone, buying volume is increasing, which raises the probability of breaking this resistance.
💥 The break of level 70 and the RSI entering Overbuy are strong momentum triggers for a long position.
📊 For a short position on this coin, I’ll wait until a bearish structure forms. The current structure is very bullish, so I’d rather open short positions on other coins.
⭐ We’ll get the confirmation of a bearish reversal only after the price stabilizes below 190.87.
📝 Final Thoughts
Stay calm, trade wisely, and let's capture the market's best opportunities!
This analysis reflects our opinions and is not financial advice.
Share your thoughts in the comments, and don’t forget to share this analysis with your friends! ❤️
Check if 224.47-260.42 can be supported
Hello, fellow traders!
If you "Follow" us, you'll always get the latest information quickly.
Have a great day.
-------------------------------------
(ZECUSDT 1M chart)
You might be wondering why it's rising, but you don't need to know why.
Because it's already rising.
It's a sharp rise, breaking above the important support and resistance area of 56.29-78.91.
The key is whether the price can hold above the Fibonacci 1.618 (338.52) level.
If not, we need to check for support near 220.20, the previous DOM (60) indicator level.
Since the chart was broken by a surge, I believe the next support period is crucial.
-
(1W chart)
The next volatility period is expected to be November 3-23, around the week of November 10.
-
(1D chart)
As mentioned earlier, since the chart was broken by a surge, I think we can calculate the next volatility period based on the next support period.
Until then, we need to see how the price moves after this volatility period, which runs around October 21 (October 20-22).
Looking at the current 1D chart, the HA-High ~ DOM(60) range is forming between 224.47 and 260.42. Therefore, we need to see if it can find support within this range and rise.
If it falls below 220.20, it could fall to around 115.72, so we should consider a response plan.
-
Thank you for reading to the end.
I wish you successful trading.
--------------------------------------------------

$ZEC: From Rebound to Breakout?ZEC’s fundamentals continue to strengthen. Its integration with Router Protocol enhances cross-chain interoperability — a step that bolsters Zcash’s long-term outlook even as privacy adoption remains niche.
Following a sharp pullback, Zcash has rebounded 37% from the $187 demand zone. The move reaffirmed support above the anchored VWAP and marked a breakout from diagonal resistance, signaling improving momentum.
Technically, the $270 zone stands as the next major resistance. A rejection there could lead to a retest of $230 but maintaining price action above $200 — where a short-term consolidation previously formed — the overall structure remains healthy.
ZEC Super Cycle - Good ContextA note:
It is not my norm to make posts like this, especially as long as it is. It's partially for my personal record, and also because I welcome discussion and other ideas for those who want to participate. This is highly speculative and as always do your own research.
Why Now?
ZEC (Z Cash) has existed since 2016, why is it just now gaining traction?
The privacy narrative is building strong within this market cycle, namely because it's becoming clearer and clearer that government entities have easy ways of tracking transactions on public ledger blockchains. Z-Cash is uniquely positioned in a way that appeals to long-time Bitcoin holders, and as privacy fears arise some have made a switch.
Usability, Zcash has made significant improvements to the utilization of it's privacy feature. Additionally, the fact that privacy is an optional form of transacting and not mandatory makes it more appealing, 85% of ZCash transactions done on the blockchain are via transparent transactions. New apps/wallet applications such as Zashi have also made it more appealing as they offer methods of off-ramping your zcash for direct spending.
A supply model that directly copies Bitcoin. (Well Almost)
Bitcoin Supply Limit: 21 Million
ZCash Supply Limit: 21 Million
Bitcoin Halving: Every 4 Years
Zcash Halving: Every 4 Years
Now here's some indepth differences in their supply model, and this is KEY to understanding why Zcash is going to go turbulent.
Something to understand first:
Bitcoin Block Time: 10 Minutes
ZCash Block Time: 75 Seconds
1 BTC Block = 8 ZEC Blocks for equivalent Supply Release
When Zcash First Launched in 2016 they released 12.5 ZEC per block mined, this was double the amount of new supply released that BTC First started with. Zcash corrected this with something called the 'Blossom' network upgrade in 2019, then it had another halvening in 2020, and most recently a third in 2024.
3 Halvings in 8 years.
Currently, ZEC emissions match that of Bitcoin's in 2016 (12.5 BTC per 10 min/12.5 ZEC per 10 min)
There's still one catch, 20% of the block rewards do NOT go to miners. Currently:
8% goes to the 'Electric Coin Company' - basically, focused on growth and partnerships involving Zcash.
7% goes to the 'Zcash Community Grants' used to fund development tools/infrastructure as well as marketing and community growth. There's been proof of this as new wallet/apps and options for zcash have become apparent in the last few years.
5% to the Zcash Foundation - nonprofit aimed at privacy research and maintaining zcash's node software.
The Technicals?
There is no solid reliable ZEC/BTC chart available, by reliable I mean with consistent volume. So I've created my own by pairing the ZEC/USD Kraken pairing to BTC/USD coinbase pairing, and I created a VWAP point from the beginning. In terms of BTC price alone, ZEC will hit just over 0.01 BTC, chart for reference (Logarithmic):
In terms of elliot wave theory, I'm already seeing extensions building into other wave extensions. Still in the midst of wave 3, and nowhere near it's end most likely.
I have 2 things to leave you with.
Even if you're super skeptical, if you don't have a lotta money in general and have a distaste for crypto/bitcoin in genreal, just get 1 ZCash, just 1.
Secondly, I strongly urge you to go on X (Formerly twitter) and lookup latest posts by CRYPTOCAP:ZEC , filter through the spam and see community talk/interactions just in the last hour, you will likely be surprised.
Just.
Get.
One.
#ZEC Ready to Collapse? Breakdown Here Could Trigger Panic Sell Yello Paradisers! Are you really paying attention to what’s brewing on #ZECUSDT? Because if not, you might be blindsided by what could be a brutal move down. Let's get into the #ZEC setup:
💎#Zcash has been trading inside an Ascending channel, but the momentum is clearly fading. The last bounce off the ascending support was weak, and now we are testing that same ascending support again, but this time, with growing selling pressure.
💎Current price of #ZEC is around $242, and the situation is getting critical. A confirmed breakdown below this ascending support will flip the structure bearish and open up a clean setup toward significantly lower levels. The 50 EMA, which is now acting as dynamic support, will act as resistance. It will only accelerate the downside if this breaks.
💎If this breakdown plays out and is followed by a failed retest of the broken trendline, we could easily see price dump into the Support Zone around $175, and possibly even fall into the Key Support Zone near $121, where stronger buyers may finally step in.
💎On the flip side, the bearish setup is invalidated only if #ZECUSD breaks back above the Resistance Zone at $316. That would shift momentum in favor of the bulls and could spark a sharp rally.
Trade smart, Paradisers. This setup will reward only the disciplined.
MyCryptoParadise
iFeel the success🌴
ZEC breakout of multi years resistance !ZEC / USDT
We noticed a Strong move this week
Price broke multi-years resistance line (2024/2022/2020) which is a huge breakout for this coin !
Simple thing , Holding above line = bullish
Invalidation: candle close below it

DASH and other privacy coins are back?During the recent flash crash, privacy-focused cryptocurrencies were among the least affected. ZEC reached a new high, and DASH followed suit. In light of government plans to restrict financial privacy, demand for privacy coins is making a comeback. Could this be the beginning of a privacy season?
DASH recently broke out of a year-long accumulation phase. From the perspective of Elliott Wave Theory, the bottom formed in mid-2025 appears to mark the end of wave C in an ABC zigzag correction (at important Fib retracements). It looks like we are heading into a powerful bull market.
How best to play it?
The optimal strategy is to wait for the full development of the initial five-wave impulse (wave 1) and then enter on the nearest correction (wave 2).
