ZEN Price ExplosionAfter breaking through the resistance with force, we now have to see if there is some meat to this pump, or whether it was just a classical pump & dump.
ZEN Definitely has the potential, so to know from a technical analysis point of view whether this pump is stable, I want to see some support at the $8 level where it previously found resistance.
The next place where I'd like to see support is around the $9 level to understand whether the new price boost for ZEN is here to stay, or just there temporarily.
ZEN

(invest Time!) Zen preapare for a big move (+500%)%))BINANCE:ZENBTC is again in a lowest price, It prepare for another try to break trend line, We can expect big moves and break trend line in Alt season.
Trade at your own RISK
Be Patient

ZENUSDT AnalysisAt this moment, there are 3 BUY signal present and I'm BULLISH .
Also, the risk-reward ratio is higher than 1 so if you want, you can buy right now.
If you haven't bought yet, you can buy when candles are on down trendline.
If you are holding ZEN right now, you can sell when there's a sell signal from EngineeringRobo or you can take profit at the resistance level (7.20)
After you buy, please watch out for EngineeringRobo's sell signals and consider selling it.


ZEN/BTC looks like $ETH soon breakout ?ZEN/BTC looks like $ETH soon breakout ?
buy before breakout Now trading at @0.00073 btc
, targeets are - @0.0019 -0.0025 btc

Through the Eye of The NeedleZen has been head faking a breakout that is more than due. The bottom trend line has held strong and a double bottom pattern has formed. The longer it takes to breakout, the greater the upside.
THIS IS NOT FINANCIAL ADVISE; CRYPTO IS HIGHLY VOLATILE.

A Ticking Time BombTHIS IS NOT FINANCIAL ADVISE.
This thing has been coining in a pretty triangle for its entire existence. It is possible for this to range for another month before we run into the end of the triangle pattern.


ZENBTC...You don't want to miss this breakout !! It's gonna skyThis will be a nice breakout in the next days/weeks
It's a very nice project!!!
Buy 8.500 - 7.700
TP1: 12.000
TP2: 14.000
TP 3 17.000
TP4: 20.000
No SL
It's a very nice trade...If you want to hold it as investment it will be a nice profit in next months

ZENUSDT ANALYSIS10.921)The candles are downtrend, so if you have ZEN, you should sell it. Then, you should buy it again at the support line(dashed line).
When the candles pass the resistance line(10.921) you will buy it again and wait for the good benefit:)


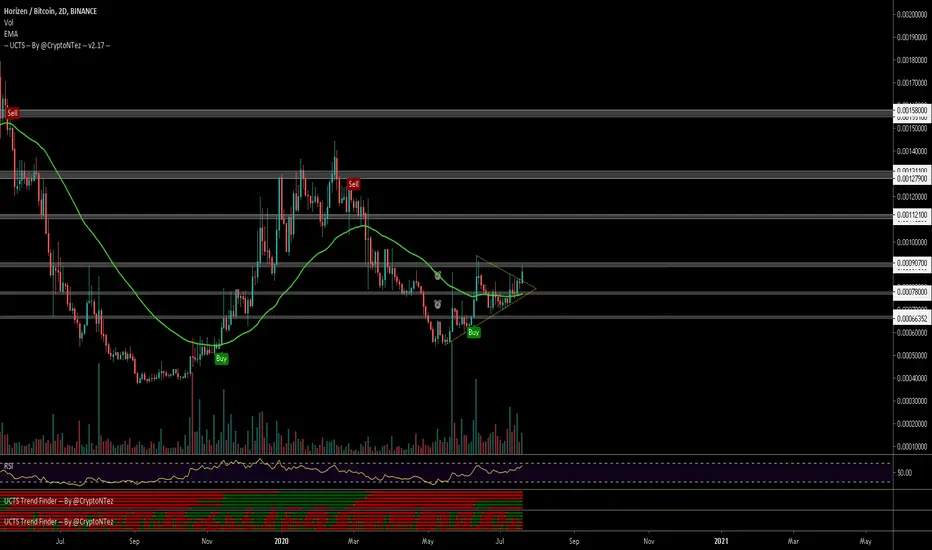
$ZEN, Retesting ~90k sats level...$ZEN
Retesting ~90k sats level as its trying to break from Symmetrical Triangle w/ UCTS Buy signal active on the 2D..
Waiting for a potential R/S flip at this level as sign of continuation toward ~112k sats or higher...
#ZEN
Zendesk $ZEN$ZEN is hitting the pivot to breakout. needs to hold above to get in. watch out for a breakout.
12 months Consensus Price Target: $94.10
if you find my charts useful, please leave me "like" or "comment".
Please don't trade according to the ideas, rely on your own knowledge.
Thx

The "W" Pattern ExplainedThis pattern is very common when looking at the altcoins trading pairs (cryptocurrency).
It looks like a "W" and works only when a higher low is present.
The "W" Pattern Explained
As prices drop and a low is hit, we get the first push up, followed by a drop that ends it in a higher low which signals that the pattern is complete.
After the second push, we get a final retrace before prices resume up.
Note: Even if you spot this pattern, you still need a plan/strategy before you trade.
You need to have a stop-loss, in case the prices drop and a target to secure/collect profits if the pattern plays.
This is Alan Masters.
Thanks a lot for your continued support.
Namaste.

Another ascending triangle forming at ZEN/BTC (LONG)There is another ascending triangle forming at ZEN/BTC so its a safe bet at this price level.
Let me know if you've got feedback! Always eager to learn!
Thank you.

$ZEN, Crossing over ~66k sats w/ increasing volume $ZEN
Crossing over ~66k sats w/ increasing volume and UCTS indicator showing Buy signals over multiple timeframes...
Taking an entry at support level seems good for potential continuation toward 78k/90k sats resistance levels
#ZEN

#ZEN/BTC 1D 115% Potential Profit. Trade Setup for July!Welcome to this quick update guys.
ZEN BTC has been trading at the bottom, certainly
Technical perspective:
Breakout of the 128 days long Falling wedge channel
Currently forming a bullish pennant
Double bottom formation
A lot of fundamentals at the end of June and July which will eventually create a lot of HYPE.
So I think buying the dips would be profitable in future.
ENTRY:
5500 TO 6330
Targets:
1. 8022
2. 8683
3. 9675
4. 10277
5. 11969
Stop Loss: 5337
If you like this idea please hit the like button to support my work.
Do not forget to follow me for more future updates on altcoins and bitcoins.
STAY SAFE
#Peace

ZENBTC Swing and Long-Term BullishZEN/BTC Swing long
ZEN/BTC Long-Term Bullish
Reversal Trend Formation
Goog Luck :)

buy the dipit looks like there could be a massive h&s playing out, it may not play out but now is imo defiantly a good time to start getting 42 zen

ZEN/BTC, BULLISH CYPHER, FALLING WEDGE, ATTEMPTING BREAKOUTIt has formed a nice harmonic and is attempting a breakout of it's immediate resistance of the falling wedge. Safest bet would be wait for it to make another attempt to breakout to enter but keep SL behind support once it bounces. I am liking what I am seeing on this and if this current pattern breaks down, I expect it to make a Bullish Bat pattern (falling to the 0.886) before its rally upwards. So overall, the R/R look good to me here as I am expecting it to test 100 WMA.
I AM NOT A FINACIAL ADVISER, DO YOUR OWN RESEARCH!

ZEN is looking for short-term upside#ZEN / BTC ( OKEx, Binance )
Buy Range : 0.0006130
Stop Loss : Daily close below 0.0005755
Target 1 : 0.0006475
Target 2 : 0.0007600
- Nice short-term bullish reversal on ZEN. Price indicators looks like sellers has gone and price could retest the last support ( now resistance )
- Indicators looks bullish. MACD crossing, RSI going up after test lows. CCI green...
- Our target points are the next demand zone for ZEN vs BTC.
- Good overview on the weekly, which show how this coin have more room to the upside with a very good risk/reward
- Perfect market situation for alts
- ZEN vs usd still sideways. So lets go !
More trading signals in my premium channel
GL

Horizen Hits Support (Full Chart Mapped)Here we have the chart for Horizen (ZENBTC) fully mapped.
On the chart above we have the most important Fib. levels marked.
Fib. retracement (support) and extension (resistance).
You can look at the "Decision Point" at 0.0006038 to know where prices will be headed next.
Below this level, ZENBTC goes bearish (we remain bullish even if prices drop).
Above this level, ZENBTC goes bullish.
Since Horizen is now trading near strong support with some early signals showing up, chances are that prices can move up here, still, the 0.0006038 needs to be conquered first for confirmation.
This is not financial advice.
Thanks a lot for your support.
Namaste.

Shilling my positions : ZEN BTCFor the series, let's shill my positions today we got :
Pair : Zen BTC
Full name : Horizen
Coin Type / main feature : Horizen (formerly ZenCash) is an incentive-driven application platform with optional zk-SNARK based privacy features that aims to provide everyone with complete control of their digital footprint. Launched in May 2017 (no ICO and no pre-mine), the leading-edge platform enables real-life use cases beyond the ZEN currency, including the ability to privately chat with others, publish information and go anywhere on the web with complete privacy.
The team is working towards releasing the Horizen platform upon the world so that anyone can build privacy-based applications with the option to monetise their creations. This will allow Horizen to bring thousands of real-life services to the mass market.
The platform itself is being built on top of a truly decentralised side-chain based system powered by Horizen’s multi-tier node network. The project utilises a sustainable funding mechanism and intends to empower all ZEN holders with decision making authority via a treasury governance system designed in collaboration with their partners, Input Output Hong Kong (IOHK).
Horizen has one of the largest node networks in the industry with 21,000 reachable nodes across 56 countries, a passionate worldwide community, a team of over 50 professionals, and an ambitious roadmap driven by continuous investments in cutting-edge research and development.
Reason for going Long / Method of trade : Macd divergence
Past history of the same trade type : Divergence of both histogram and macd line produced high bounces (30/50%+)
