ZEN Trying To Sustain Above EMA-50, May Give Pullback Upto $140Horizen price traded at $118 with a loss of 9.55% in the last 24-hour and 2.02% down in the weekly time frame. Furthermore, Horizen price bounced from the support of $100. In contrast, the market capitalization stands at $1.31 billion. Technically, investors can perceive a positive crossover in the EMA, and the price is sustaining above the 55-EMA. RSI index showcases a downward slope. Moreover, the price movement can be towards the resistance of $140 in future trading sessions.
Resistance: $140
Support: $100
ZENUSD

ZENUSDT Triangle breakoutZENUSDT (4H CHART) Technical Analysis Update
Triangle Breakout
ZEN/USDT currently trading at $133
Buy-level: $125 - $133
Stop loss: Below $113
Target 1: $140
Target 2: $150
Target 3: $165
Target 4: $180
Max Leverage: 2X
ALWAYS KEEP STOP LOSS...
Follow Our Tradingview Account for More Technical Analysis Updates, | Like, Share and Comment Your thoughts.


Horizen possible wave 5Please don't copy, trade yourself.
Ideas from others are useful and I use them myself.
Comments are welcome.
Bitcoin is falling sharply and Zen is holding strong.
Possible last wave number 5
I go into this ankle long, upon confirmation.

ZEN/USD Crypto analysis BUY THE TREND!Horizen has been of interested, particularly smart contracts and its proof of concept, and implementation. I believe in this Blockchain, as well as others!
But on the analysis side. We have started to see strong indications towards the $120 price, continuation of bullish crypto market.
Lowest ZEN price $100
Next Low $106 look for BUY orders
I am personally going to hold on to the ZEN blockchain and will continue to invest


ZENUSDT Buy signal!ZENUSDT (4H chart CHART) Technical Analysis Update
Resistance Breakout
ZEN/USDT currently trading at $68.00
Buy-level: $65.50 - 67.50 (Wait for the small retracement)
Stop loss: Below 60
Target 1: $74
Target 2: $85
Target 3: $100
Target 4: $115
Max Leverage: 3X
ALWAYS KEEP STOP LOSS...
Follow Our Tradingview Account for More Technical Analysis Updates, | Like, Share and Comment Your thoughts.

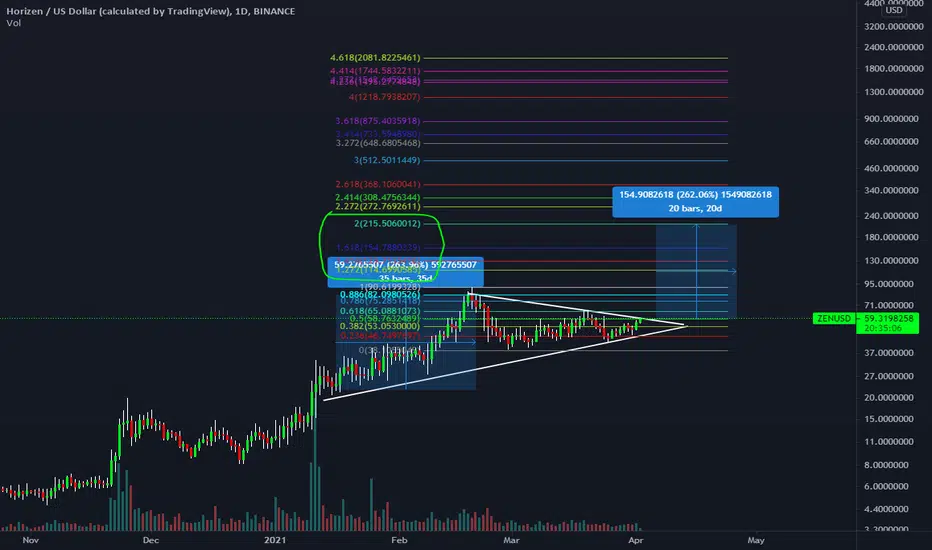
ZEN - Ascending Triangle - Long trade :)ZEN/USDT or PERP
Trade Duration - 1-3 weeks for short term TP's or 3-6 months for longer term TP's
Entry: 57.5-58.75
Stop below pennant: $53
Short term TP's = 60,61, 62, 63, 64, 65, 66 up tp $85 ( top of wedge)
Long Term TP's = $100, $200, $300


🔥ZEN uplink. HORIZEN#ZEN/USD
📌ZEN uplink
🔹Analytics: we have moved on to the lower border of the channel again, the indicators are set to buy, I have already managed to ride the channel several times before, but you don’t want to? Stop for the support line.

ZENUSD - The big picture (log scale)We're sitting at the ath area from 2018 right now. Let's see if it can become a new support line. In case the daily candle doesn't close above 56$ today I can see a retest of the 55 EMA (orange line) around 47$ and maybe even going lower. This is not a financial advice. Just an ape sharing his view.

ZENUSDPrice is still on the trend line, but unable to break 60, if it breaks 60, will ZEN go to the moon?


Horizen (ZEN) • Final major resistance before next 10xWe are just meeting final structural target based on past PA.
I still see this a hold because chances this will do another 10x from where we are.
In terms of fundamentals is still strong. Backed by Grayscale, continuous development and growing community.
In terms of technicals is still strong. Volumes show steady growing interest but nothing really usual or fomo like volume signatures, major trendlines has not been broken, trading above clouds, consistently trading above weekly averages. I see no reason to sell this coin.

HORIZEN (ZEN) GREAT POTENTIALHello Traders
As you can see in the chart above, ZEN is Extremely bullish on technicals
if we see the ZEN/BTC chart, it obviously has a great potential on both USDT and BTC pairs.
On the other hand
Recently I'm more focused on fundamentals, to
this project has robust technology. It's a privacy token, too, with a cross-chain.
Recently ETH has a high gas, so all of the scalability tokens started to pump.
------------------------------------------------------------------------
What is your opinion? Comment below.
If you like the idea, please hit the like button and follow me so that you won't miss the updates. The information given is never financial advice. Always do your research too.
Goodluck.

ZENBTC STRONG CHARTHello traders
As you can see in the chart above, Horizen (ZEN) has broken its descending Trendline, and I'm looking forward to seeing it touch the 0.618 Fibonacci level.
I will update the Fundamentals and the ZENUSDT on the next Idea.
------------------------------------------------------------------------
What is your opinion? Comment below.
If you like the idea, please hit the like button and follow me so that you won't miss the updates. The information given is never financial advice. Always do your research too.
Goodluck.

#HORIZEN #ZENUSDT #4HHi guys..its the latest analyze chart of ZENUSDT in 4H timeframe .if you are interested any crypto that you want analyze with me and any questions please do not hesitate and comment below the chart!
if u like it press like-comment and folow me.thx

Zen breaking out.Top/bottoms for the upcoming weeks. Analysis based on Gann angles and linear regression. Also it's in Grayscale's portfolio and has the fundamentals to back that up. There might be a dip to 29,4 if the crypto market circumstances drastically change.

ZEN/USD - Watch this bearish divergence!ZEN has done very well these past few weeks. However, if you are looking to buy longer term, you need to watch out for this massive bearish divergence we have here.
RSI + MACD + Volume are all painting a very clear bearish divergence on the daily timeframe with lower highs every time we went higher in price. This shows buying interest is fading and once the momentum flips, price can quick fall down to support.
Nevertheless, ZEN can still push higher, but not by much in my opinion before sell pressure will take over and bears will have a party.
Levels on the chart. Don't FOMO. :)
Like and follow if you liked this idea!

💡 ZEN : BUY Trade 🚀🚀🚀ZEN is showing strong bullish volume on btc and usdt pairs.
it has received weekly demand zone, also in buy area.
invest 1% of capital.


ZENUSDT - POTENTIAL RETRACEMENT ANALYSIS
- ZENUSDT brokeout above the previous ATH resistance.
- Price action is to printing a rising wedge pattern.
- RSI is a printing a bearish divergence signal.
SELL ENTRY ⬇️
- Breakdown below the rising wedge support.
TARGETS 🎯
- Fibonacci retracement levels
- Flip horizontal support (previous ATH).
SETUP INVALIDATION ❌
- Breakout above the rising wedge resistance.
