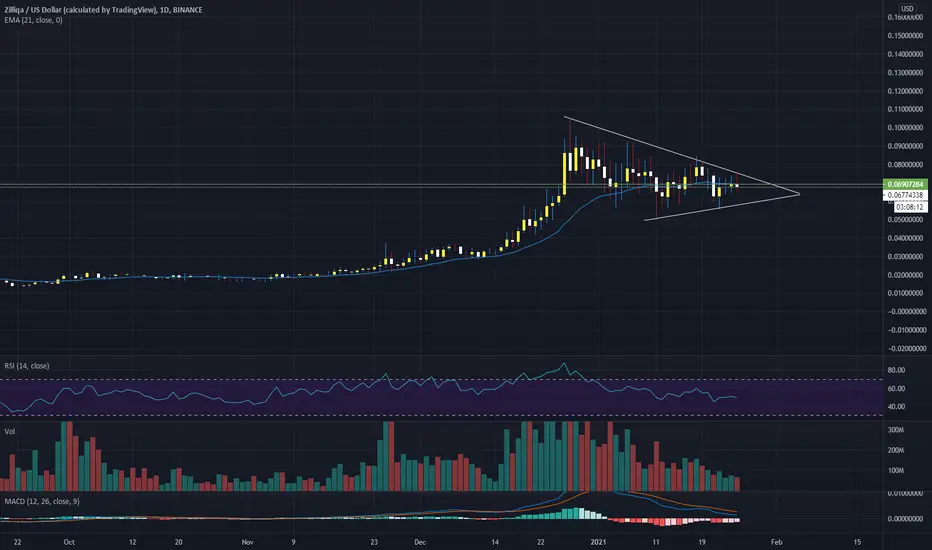
Zil Trading RangeIn the case of the breakout of this trading range, we can expect an impulse movement. Mention that a symmetric triangle is a continuation pattern.
Zilliqa

ZIL Daily outlook: Bullish flag in playHi guys.
Giving an insight on the daily chart for Zilliqa, which is one of my favs for this upcoming alt season.
Technical Targets are given according to horizontal Fib. levels, and the upward fib channel is pointing out on the overall bullishness and volatility of the coin.
Expect 0.12usd price for ZIL in the near term if everything plays out right, meaning BTC and ETH being bullish or sideways.
Not financial advice.
DYOR.
Cheers!

Z

ZILUSDT Are you still bullish ? Zilliqa daily chart. Testing EMA 50.
We are not registered or licensed in any jurisdiction whatsoever to provide investing advice or anything of an advisory or consultancy nature,
and are therefore are unqualified to give investment recommendations.
Always do your own research and consult with a licensed investment professional before investing.
This communication is never to be used as the basis of making investment decisions, and it is for entertainment purposes only.

ZILUSDT (ZILLIQA) - POSSIBLE PRICE ACTIONSANALYSIS 🔎
- ZILUSDT is consolidating in a symmetrical triangle pattern .
- A relatively big move is imminent.
- There's a breakout potential.
POSSIBLE PRICE ACTIONS
- Uptrend ⬆️: breakout above the symmetrical triangle's inclined resistance.
- Downtrend ⬇️: breakdown below the symmetrical triangle's inclined support.
TARGETS 🎯
- Uptrend ⬆️: Horizontal resistance levels (R1, R2).
- Downtrend ⬇️: Horizontal support levels (S1, S2)

zilusdt / zil / BUY BUY BUY✔🎁👍👌The goals of this symbol are ahead and it can start a positive trend by touching these three resistances


ZILUSDT/ZIL BEST TIME FOR BUY ✔️⌚This is the best time to buy Zill currency. I have drawn the resistance in front of this currency for you. Please proceed with science and analysis, I hope you will make a good profit. Observe the profit and loss limit ✔️👌🏿😉

VET / ZIL ; will she follow? (same as ADA)Same as the ADA / ZIL basic-follow-fractal.
VET IMO has quite a scammy background. I don't fundamentally like how/where the platform is actually in use. That said its one of, if not the biggest player in SUPPLY CHAIN application. An important factor no doubt.
This token has a lot of die hard bag holders and had some of the best momentum in 2017. The pump bots will go hard on this one at some point.
VET is a way to hopefully increase my ADA/ETH positions.

Z

ZILBTC has confirmed a big breakoutBull flag and down channel:
On daily time frame chart, the price action of Zilliqa has formed a bull flag. This flag is in fact a down channel. Within this channel the price action has broken down the daily EMA 10 and 21 but having bounce from the support of channel. The volume is also decreased.
SMAs on daily chart.
On daily chart, the price action of Zil has broken down the 25 SMA and having good support of 50 simple moving average. The 50 SMA is at the same level where we have the support of the down channel.
EMAs on weekly chart.
On the weekly time period chart, the price action is testing exponential moving average 10 as a support.
Break out the down channel:
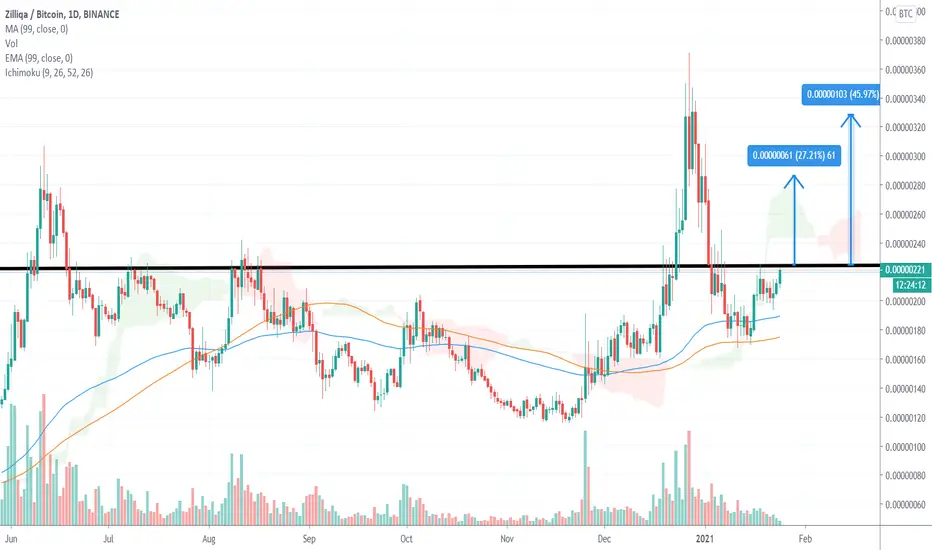
Now if we switch to the Zilliqa with Bitcoin pair, then on long-term weekly chart, it can be seen that the price action has broken out the down channel and after re-testing now the price action is likely to move up. It is quite good confirmation of a firm break out.
Conclusion:
On daily chart, the price action is behaving like a bull flag and in Bitcoin market it has broken out the big channel on long-term. Therefore it can be possible that now the priceline of Zilliqa will start a major move to the upside from here.
ZLong


ZILLIQA DAILY CHARTS- In this chart we can see the possible options
of movement. We can see that the price can break the flag. If the price goes back, we could look for incorporation in the bearish divergence.
- The other option is that the price breaks down and we could look for support in the support marked as a rectangular area. This is a relevant volume area and it is possible that the price will return to it, which would be a great opportunity to buy if confirmation is given.
Z

ZILLIQA WEEKLY CHARTSIn the weekly chart we see how a turning pattern marked by a semicircle has been formed. We see that the price breaks through the resistance area with a lot of volume and today the price is forming a bullish flag, indicating that a continuation pattern is likely. We see in more detail how we could take advantage of the movement in the daily chart.
Z


ZILUSDT- A Breakout Is Imminentsimple yet powerfull analysis for ZILLIQA / TETHERUS or all other pairs
trade at your own risk
Monthly Levels, ZIL_USDT
Buy at/above 0.08410 0.1406
Target 1 0.2499
Target 2 0.3904
Target 3 0.5622
Target 4 0.7652
Target 5 0.9995
Resistance 1
0.25
Resistance 2
0.39
Resistance 3
0.77
Resistance 4
1.00
Resistance 5
ZILLIQA / TETHERUS


My winer!!Holding and buying to the moon. This project is one the best ever and I believe Ziliqua will pass Ethereum sooner.


ZILBTC a mega bullish setupHey friends, hope you are well, and welcome to the new update on Zilliqa coin.
Bull flag and re-testing of a EMAs:
In USD market, on the daily time frame chart, the price action of Zilliqa has formed a bull flag and moving in a down channel. In the meanwhile, it is also using exponential moving averages with the time period of 10 and 21 as support.
Down channel has been broken out:
On the long-term weekly chart, the price action of Zilliqa coin with Bitcoin pair was moving in a down channel. Now the price line has broken out the resistance of this channel and re-testing the previous resistance as support to confirm this breakout. We also have 25 and 50 simple moving averages as support at the same level of support of the channel that was previously working as resistance. The 25 SMA also formed a bull cross with 50 SMA as well.
Ichimoku bearish cloud broken out:
On the same long-term weekly chart, in Bitcoin market the price action of Zil has also broken out the Ichimoku bearish cloud and now re-testing the previous resistance of cloud as support to confirm this breakout.
Big Shark move:
On the long-term monthly time period chart, the price action of the Zilliqa with Bitcoin pair has completed last leg of bullish Shark pattern and entered in potential reversal zone. 1st the priceline found a support at 0.00000050 btc and then found another support at: 0.000001150 btc . Simple moving average 7 is forming bull cross with SMA 25.
Conclusion :
As the priceline of Zilliqa has completed a very firm bullish setup in the Bitcoin market to move up against the BTC. Therefore, there are strong chances that the Zilliqa will also cross the previous high that Zilliqa set in the previous bull run.
For exact buy and sell targets for this trade, and other harmonic trading signals you can join:
www.patreon.com
ZLong
