#zil I can see one of the cleanest charts in Crypto.
both scenarios can give back 55X (5500%) for those who want to invest.
NFA
Zilusdt

ZIL to retest channel resistanceNow days everybody wanna talk like they got somethin to say but, but ZIL comes out when they movin' their lips.... ZIL still relatively close to channel support. A flip above the MACRO POC will send the PA toward the channel resistance level. Don't miss out on this SLEEPING GIANT GEM ZIL!!!

ZILUSD - Similar BottomsSimilar higher low bottoms, price is attempting to breakout of a strong downtrend
Good for the bulls, much less for the bears
Horizontal lines intersect with each bottom point

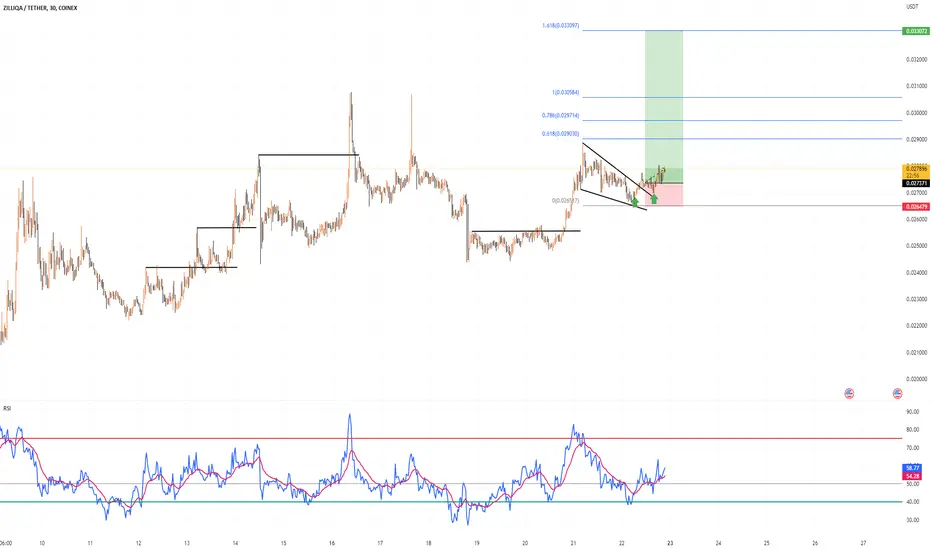
ZIL has 2 possible movement scenariosZIL has created an Inverse Rounded Bottom Pattern which means the price should do a bit of correction and goes bearish for sometime. the Pattern has not been broken yet but when it happens, the price shall Decrease as much as the measured Price movement which is shown on the chart.There could be another Scenario which will be that the Price breaks the pattern Upwardly and Reach the resistance level that is shown on the chart and why is that possible? well if you pay attention to RSI, you can see that the price has reached the oversold area which is a bullish signal so we should consider the possibility of a bullish movement as well. The Price shall do a movement pretty soon so we can predict the incoming movement right after.
_ _ _ _ _ _ _ _ _ _ _ _ _ _ _ _ _ _ _ _ _ _ _ _ _ _ _ _ _ _ _ _ _
🌍Thank you for seeing idea .
Have a nice day and Good luck

$ZILUSDT: Low risk buy signalWeekly trends have often been a good way to ride crypto swings, so I keep an eye on them. Nice setup here in Zilliqa's chart.
Best of luck!
Cheers,
Ivan Labrie.

$ZIL ZILIQA SWING TRADE IDEAFlip and hold 0.0365 for a swing long on ZILIQA $ZIL. Key levels marked for trading

ZILUSDT can produce a massive jump of nearly 60%ZILUSDT resistance became the support, while the price continues to produce HHs and HLs. This is a strong bullish pattern and there should be a continuation of the uptrend, potentially going exponential.

Fast long on ZILFast long on ZILUSDT. The idea that we move in the flat channel and now after bottom line will move to up level of this channel. Will see...

ZILUSDT Failure and departure from compression rangeFailure and departure from compression range
BREACK OUT TRIANGLE PATTERN
STRONG BUY SIGNAL
ZIL/USD SHORTZil on 4h charts RSI divergence, Stoch Rsi losing momentum and rejecting of resistance. Expecting to break down the trend line and go down.

ZILUSDT Analysis - 11 JANUARY 2023Hello Guys, Today's Analysis is on the ZILUSDT Symbol in a 1H Time frame, I Hope it Will be Useful for You, Don't Forget to Like, Follow, Comment


The price has reacted positively to the strong monthly supportZIL has registered a growth of more than 45% in the last 24 hours. The price has reacted positively to the strong monthly support area, confirming the fake breakout of the previous floor support area at $0.020. Therefore, due to this high buyer power, if the daily candle closes strong, pullbacks can create strong positive reactions. One of the resistance levels that can cause many negative reactions is considered in the range of $0.027 to $0.030.
Therefore, considering the high power that can be created at this level, the possibility of forming a range area below this resistance is high. The potential for a trend reversal is built into the daily time frame, and simply making a higher floor that leads to a higher ceiling can help reverse the trend. The bullish candles are in the spike phase on the 4-hour time frame, which, if a pullback is observed, can enter a narrow bullish channel to fully hit the plotted resistance. If ZIL breaks through resistance, it has a high potential for further growth in the long term and very high targets.

Fast long on ZILFast long on ZILUSDT. Truing buy to second low level. I hope that it will be tested and then go up with brake up level of this small flat channel. Will see...

ZILVery simple ... Very clear!
Everything is marked on the chart.
This is my personal opinion. Please do not trade based on my analysis and data.

💁♂️ ZIL/USDT _ 12H 💁♂️ HI Everyone
As you can see, the price is fluctuating in the specified box.
If the price can penetrate above the 0.02360 range, the possibility of price growth up to the 0.02490 range can be considered.💹
Support range 0.02226/0.02120 ‼⚠
The range of resistances is 0.02490/0.027❗
❎ (DYOR)...⚠⚜
WHAT DO YOU THINK ABOUT THIS ANALYSIS? I will be glad to know your idea 🙂✌
IF you like my analysis please LIKE and comment 🙏✌

Good price for ZILThe current market gave us a good entry point for ZIL.
Why is it?
1.
Zil is a blockchain for casino, betting and gambling intudsry.
Zil develops web3 games
Zil announced own web3 console (physical product BTW). And showed prototype.
I expect release of console and growing token price to more than 1$.

ZIL is more liquidity to the downside!We should have add 1 ATR above our swing high in our previous trade if you could go back to the recent analysis. Now, ZIL is getting more liquidity with a beautiful rejection testing the previous high.
(Not a financial advice)

“ZIL” IS GOING BY THE STRUCTURE DOWN!After seeing a loss os momentum on the 4H timeframe, we can see on the 1H a break of the low creating lower-low and its being retested now. The target as we can see on the 4H is giving us almost 1 to 4 risk to reward ratio. It’s better to use trailing stop-loss.
“None of these are a financial advise, is for education only”

ZIL!! Strong Volatility Happening! If we see a nice breakout this could have a very nice and clear profit targets! Even though we are in a bear market overall, we have to aim for small targets as anything could happen with BTC consolidating at this point.

ZILUSDT Testing Support and Into A New ATH After Correction EndsZIL Uptrend Looks Decent, Currently Testing Support levels and waiting for the correction to end so we can Resume our way to the Top, No Solid Trend penetration till this moment, It's Possible to break the trend line, an update is coming after a technical sign shows up, Till now we are eligible to enter the trade.
Trade Infos>>>>>
Entrance Candle: Bullish Harami ( Reversal Of Bear Price )
Trade Type: Swing
Average Time: 1 - 2 Months
Wallet % : 10%
Entry Area: 0.185 - 0.16
TP: New All Time High ( 0.28 )
Estimated Profit: Average 70%
...............
Notices: 1- Sticking to instructions is better for maximizing profits.
2- check the trade type and average time... If you are not patient ignore this trade.
3- Stop Loss isn't required since we are in a bull run and Targets will be reached eventually.
4- If you are willing to take the trade with more than 10% of your wallet .. do so at your own risk ( mentioned Percentages are recommended ).
5- This is not a Self-Biased thought... it's an Analysis based idea.

Trading opportunity for ZILUSDTBased on technical factors there is a Long position in :
📊 ZILUSDT
🔵 Long Now 0.02117
🧯 Stop loss 0.01856
🏹 Target 1 0.02455
🏹 Target 2 0.02900
🏹 Target 3 0.03530
💸RISK : 1%
We hope it is profitable for you ❤️
Please support our activity with your likes👍 and comments📝

ZILZIL is bullish for long term in Weekly frame
C needs couple more weeks to get it just be patient
also it has a positive divergence in RSI as well
good accumulation area in that box
peace :)
