ZOOM looking very weak The darling of the pandemic lost a lot of its momentum over the past 40 days or so (vaccines and other prophylactics are certainly major catalysts for the drop). I think ZOOM is still a good stock for the long term but it already lost about 42% from ATH and still looks very weak here.
BEARISH SIGNALS
1. Price has been butting against support for several consecutive days. One could read this as strong support that will hold the price but the price hasn't been able to move up either.
2. Price is below the 14, 21, and 50 emas (50 ema is not on the chart).
3. Price is getting dangerously close to the 200EMA and 200 MA (not on the chart), which are normally seen as divisors between uptrend and downtrend. Price is still (barely) above both though so we cross that bridge when/if it we get there. This is something to be on your radar though.
4. There is a rounded top that formed. The price seems to be sitting on the neckline at the moment and could see a reversal from there but the other indicators + volume don't favor that scenario (one could also read the lower trendline as the neckline but since the price found support here for several consecutive days my interpretation is that this is the neckline).
5. MACD is way below 0 and not showing any sign of reaction at the moment.
6. -DI is above +DI (red line above green line) and the ADX crossed above 20, showing a potential strong trend is on its way (a down trend in this case).
7. OBV is in divergence with price showing opposing forces on the market. One will eventually win. Doesn't mean it has to happen soon or at a quick pace, but OBV and price are in disagreement.
SCENARIOS
1. Given these indicators I would be more prone to bet on price moving lower than moving higher. This doesn't need to happen soon (and doesn't need to happen at all) but that is what these chart indicators are showing.
To minimize losses if the price goes down, keep an eye on the 200EMA, which is just below the trendline, and the 200 MA, which is at around $315 at the time of this writing. If the price breaches and closes below the 200MA it could signal the beginning of a downtrend.
2. Volume has been very low so we could be trading on a range for a little longer and perhaps this scenario will change. However, at the moment things don't look favorable for a bullish move.
3. A retracement (move up) could happen as well since the price is holding at the neckline. If the price moves up, pay attention to the .236fib retracement level (around $399.57). If there isn't much volume at that point and indicators are still not showing bullishness you can sell some shares and wait to see what ZOOM does next.
Safe trades!
***If you get anything out of this TA, please like and follow for future updates and more TA. Thanks a lot!***
***THE IDEAS SHARED HERE ARE MY OPINION. THIS IS NOT FINANCIAL ADVISE TO PLACE TRADES. PLEASE DO YOUR OWN RESEARCH AND ANALYSIS BEFORE BUYING/SELLING STOCKS.***
ZOOM

ZM - Zoom - Watching for Reaction @ Daily 200ema/Weekly 50emaZM
Buyzone = Reaction @ Daily 200ema support/.5fib @345.42
and Weekly 50ema @306
TTM, Macd, Stoch are all setting up.
Cost Avg Down Areas = 288/216
1st Target = .618@402
2nd target = .786@485
3rd Target = ath 588
HODL Target = 700+
______________________________________________________________________________________________________________________
This content is for informational and educational purposes only. This is not in any way, shape or form financial or trading advice.
Good luck, happy trading and stay chill,
2degreez

All the items you need for a long setup on ZOOMLet's see all the items we need to understand to develop a long setup on zoom
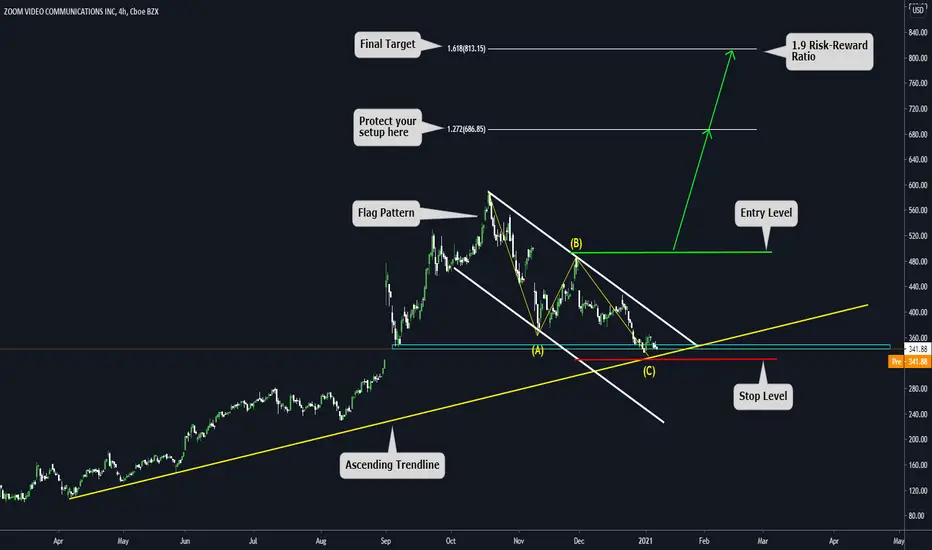
CONTEXT: It's essential to have a context aligned with our view before developing setups. In this case, our Context is a bullish ascending trendline that converges with a support zone, creating a great area to think about a reversion of the direction
STRUCTURE: Supported on the previous item, we can see a FLAG Patter. From a technical perspective, flag patterns are considered continuation structures, meaning that after the breakout of it, we should see a continuation of the price in the previous direction before the consolidation.
TARGET: To define our Target, we use Fibonacci Extenssions; in this case, you have to identify the previous impulse before the correction and draw the extension from there (if you don't know how to draw fibo extensions check the link to related ideas. There you will have a full explanation of it) / Its imperative to always have Risk Rewards ratio above 1.5 on your trades, in this case, we have 1.9 so we are good.
SETUP: Now that all the previous items are OK, we will define our Entry level above B / Stop loss below C / Break-Even level on the first Fibo Extension / Final Target on the 2nd fibo Extension.
RISK: Your account will always be protected if you risk 1% of your trading capital on any given trade; that way, you can absorb losing trades without compromising your whole account.
$ZM Has Come Into Support Area - Reversal WatchLook at how the price on $ZM reacted when CCI previously broke into the green box. I would add this one on my watch list for the reversal. Especially if it trades above $342.
If this occurs, my price target is $375 then $389. I've marked some key pivot areas on the chart to watch intraday.
If price opens below $336, you can take a short trade to the support level below. However, I would not take it with RSI being so low.

ZOOM (ZM)| Short-, mid-term reversal area!Hi,
It is a short-, or mid-term opportunity because we don't know exactly when the lockdowns will end (people start to go back into their offices and start using video communication services a bit less) but atm looks like we can catch some technical movement.
Slowly the vaccin starts to kick in but let's see, there can be many-many obstacles considering vaccin and even covid itself so that's why I consider that the investment on Zoom should be short-, or mid-term.
Techincally the buying area stays $260 - $320 and the criteria:
1) Weekly EMA 50
2) AB=CD equal waves from the top
3) The mid-round number 300
4) Fibonacci golden ratio
5) 50% drop from the ATH
6) Small resistance on Daily matching nicely with other criteria
Do your own fundamental research and if this matching with my technical analysis viewpoints then you are ready to go! If it doesn't match then...skip it!!
Good luck,
Vaido

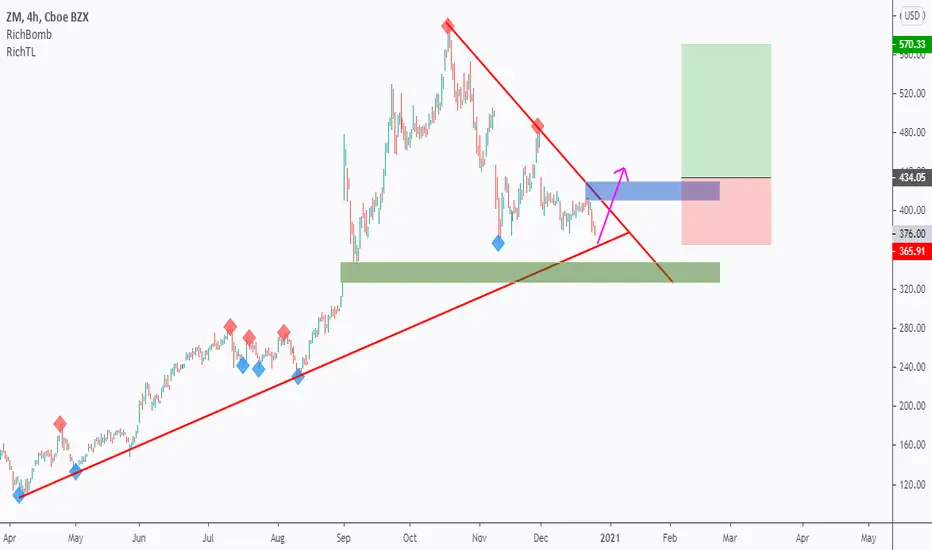
Zoom Bounce off gap closeI like Zoom off this level. SL can be placed below the 200MA and the close of the power earnings gap seen in September. Sets up for great RR

$ZM **REQUESTED** Gross Overvaluation Will Catch Up Soon$ZM Video Breakdown going into the New Year.

Zoom or BustIf the first leg up extends farther than the lowest orange line then this specific strategy is void.
That is all.


Zoom - downtrend starting?One of the most overpriced comapnies in the whole markets - NASDAQ:ZM may finally be starting its breakdown.
Despite Nasdaq strength today, company is showing very poor relative strength and deliberate breakdown of major support line.
Could be good short opportunity.

ZOOM Trend-Following Setup!Hello everyone, if you like the idea, do not forget to support with a like and follow.
on DAILY: ZOOM is sitting around strong trendline in brown so we will be looking for trend-following buy setups on lower timeframes.
on H4: ZOOM is forming a trendline in red but it is not valid yet, so we will be waiting for the third swing to complete around it consider it our trigger swing.
Trigger: Waiting for a momentum candle close above the gray area to buy.
and until the buy is activated, this one would be overall bearish and can still dive a little below the brown trendline. or till the green demand zone.
Good luck!
ZOOM attractive levels to watch out. Zoom Video Communications
The video communications specialist Zoom Video Communications (NASDAQ:ZM) didn't pay a dividend and didn't repurchase any shares during 2020. But shareholders made billions by just holding the stock throughout the year. The stock price increased by 501% during that time frame, which corresponds to an increase in the market cap of $98.2 billion.
As the need for remote communications surged during the coronavirus pandemic, consumers and enterprises massively adopted Zoom's simple and easy-to-use video communications platform. Given its sudden and unexpected success, the company faced several significant cybersecurity challenges during the first half of the year, but that hasn't scared users away.
In addition to dealing with its security issues, the company has been expanding its core video communications offering into a unified communications platform, partly thanks to its recent Zoom Phone offering. As an illustration, this year, the research outfit Gartner included Zoom for the first time in its magic quadrant for unified communications as a service, positioning the company as a leader based on its ability to execute and its completeness of vision.
As a result of this strong execution, the number of Zoom customers with more than 10 employees surged by 485% year over year to 433,700 during the last quarter, which led to stellar year-over-year revenue growth of 367% to $777 million.

$ZM Zoom is stronger than ever$ zm, I believe, the Zoom share still carries surprises, as it has achieved widespread with the Corona pandemic, this does not mean that it is linked with the pandemic only - rather, it is strange that it still attracts huge numbers of users despite the emergence of the vaccine


Zoom December - January uptrend chartHere is my take on Zoom for the upcoming weeks.
On Nov 10th and Dec 14th it clearly formed a double bottom, the RSI bounced off of that and drawing a Pitchfork on the bottom of Nov 10th (A), And the Top of Nov 30th (B) and the bottom of Dec 14th (C) can clearly show us a new trend, on Dec 21th in the open it clearly got rejected off the first resistance that the pitchfork is showing, and it bounced off yesterday (Dec 22th) at 396 on the support line.
The KDJ indicates that a trend on the 2-hour timeline might be due, we just need to see the first few hours of the market today. If it falls below 403 today, it failed. If not, then we will be in an uptrend towards January.
Also, it is forming a descending wedge, so there are numerous signs of a bullish trend. Share me your thoughts as well.
Thanks!

$ZM - Bull Target $432.5 & Bear Target $380Bull Flag Target $432.5
Break Below Bull Flag Target $380


Zoom december 13th week chartMy point of view of ZOOM, looking at different trend lines, resistance and support, and the rsi. Also if you think about the fact that the vaccine is only for emergency use for now, makes sense that ZM and other 'work from home' stocks should not dump next week, also we can see numerous lockdowns, for example in Germany, and the US.
Im overall bullish, even tho we might see a 360's to form a double bottom.


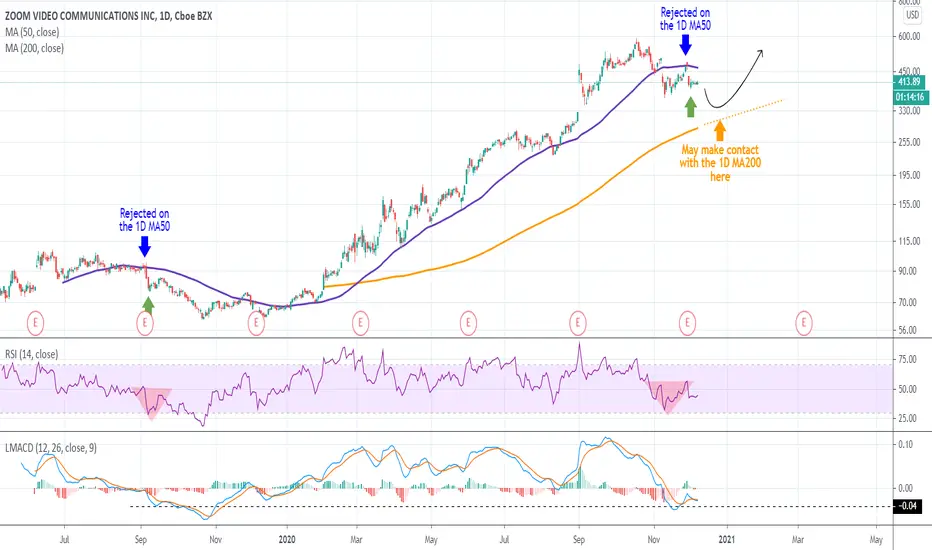
ZOOM Some pressure left before recoveringZM got rejected last week on the 1D MA50 and this is not an encouraging development. The reason is that it brings back memories of the last 1D MA50 rejection on September 06 2019. At that time, it took ZOOM three-four months before it started rising (we all know the parabolic rise more than made up for this 4 month waiting). Even the RSI is printing a similar pattern.
In my opinion in order to buy ZOOM, I want to either see the 1D MA200 being tested and hold or a weekly close above the 1D MA50. Next Target $800.
** Please support this idea with your likes and comments, it is the best way to keep it relevant and support me. **
--------------------------------------------------------------------------------------------------------
!! Donations via TradingView coins also help me a great deal at posting more free trading content and signals here !!
🎉 👍 Shout-out to TradingShot's 💰 top TradingView Coin donor 💰 this week ==> TradingView
--------------------------------------------------------------------------------------------------------