ZRX/BTCStoch RSI oversold
Potential long position, take profit up to 10'000 satoshi
Overall still feeling pretty bearish, will not be making an entry
Zrx

#ZRX #cryptocurrency at support while doom and gloom everywhereWhat to do?
Chart is pretty self explanatory, with obvious signs of past support in the highlighted green region. Price level indicated would be the level at which I see last area of real support, underneath which the support channel may be invalidated by heavy selling pressure. I'd look to take half position here and half near 8750 Satoshis if we get there and would be surprised if it didn't hold. Given the current environment, anything is possible. 0x has had some good fundamental developments lately, so coupled with the TA, it's one of the more interesting trades for me.
I've been working on other projects and trading less because of the general environment, but some coins and the general environment seem to be approaching value-level areas which make trading/investing more palpable now. Of course, risk manage accordingly as we're certainly not in (and maybe not close to) a general bull market yet.

SHORT ZRXHead and Shoulder formation on 1D chart. Short it on bitfinex.
---------
Leave a like/ follow.

$zrx pop zonewe know this thing loves huge spikes and the next run will be just as insane as the rest.
the box on the chart is the target just be wary of bitcoin dumps and if it does shoot for the lowest entry possible.

Analytics ZRX/BTCWe observe a stable downward channel. The current support area is 0, 00009120 - 0.00009080. In case the price passes this area, the next support level is the lower line (blue on the chart) of the channel, so the price may drop to a global support level of 0.00005600.
If the price of an asset is slowly going upstream, then it go to the top line of the channel, should observe price after that. Because were observed massive sales for a large volume on the asset within a month, pay attention - if the rate is rising up to 0.00010850 for today, this will be a sign that the price is being manipulated for the further sale of the asset.
In relation to the BTC, 0x did not drop very much, the price kept in its channel.

2 steps for 0x project doubling your moneyNow that we were in buy zone and accumulated ZRX, we must think what we do with them.
I think in short period zrx will double it's value and already started .... 1.5$ is the target , but first we need 2 moves , one to reach 1 dollar fast , and second to beat 1 dollar after reaching a hit near it. keep you updated


A big Inverted Cup & Handle on Bitcoin chart.This Inverted Cup & Handle pattern is visible clearly on every time frame of Bitcoin , also volume decreasing which is Bearish when price rising.
Possible target is around 6600-6700.
This pattern is visible on many other coins charts like ADA , TRX , XLM , ZRX , BNB ,... and even bullish NANO . They following BTC .

Technical Analytic for #ZRX #0x (29/08) - CryptoStation#ZRX (ZRX/BTC)
Buy : 115-116
Flash Sell : 118-120-122-124
Short Sell : 125-130-135-140
Stop : 105
Follow me for more signals
inbox me for more and more signals

0x: HUGE triangleZRX has formed a symmetrical triangle. The buyers and sellers are getting squeezed. This is a great buy opportunity.

ZRX WAYSThis Trend Analysis is for a long term investment in ZRX 0X(no indicators).
Stop Loss 9800. if it goes under this zone it would mean we starts a Bearish falls.
everything in the chart. easy.
Happy Tr4Ding !


ZRX ETH ready to set new ATH?* Bullish Ichi indicators
* Bullish signal HA candle printed on TrendMaster
VPVR ain't got too much resistance upwards by the looks of it.
Thoughts? Thanks

ZRX/USDGreat to see so many coins making a complete wave 3. ZRX is now in a take profit zone after a nice 3rd wave. its funny how this will be the point that a lot of everyday people will be comfortable to buy it and chase it.. and then not understand when it starts to fall.. They will then panic sell at a loss.. Map your trades, get your entries and take your profits in the right areas.
Entry here was .67
Target 1 .77 Target 2 .82
Look for a possible wave 4 retrace buy around .72 cents

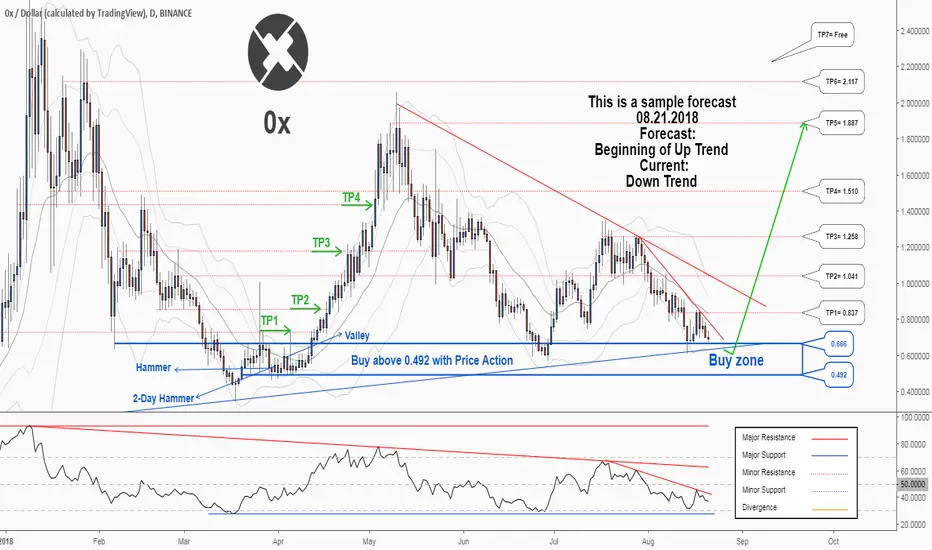
There is a possibility for the beginning of an uptrend in ZRXUSDTechnical analysis:
. 0X/DOLLAR is in a downtrend and the beginning of uptrend is expected.
. The price is below the 21-Day WEMA which acts as a dynamic resistance.
. The RSI is at 37.
. While the RSI and the price downtrend in the Daily chart are not broken, bearish wave in price would continue .
Trading suggestion:
. There is a possibility of temporary retracement to suggested support zone (0.666 to 0.492). if so, traders can set orders based on Price Action and expect to reach short-term targets.
Beginning of entry zone (0.666)
Ending of entry zone (0.492)
Entry signal:
Signal to enter the market occurs when the price comes to "Buy zone" then forms one of the reversal patterns, whether "Bullish Engulfing" , "Hammer" or "Valley" in other words,
NO entry signal when the price comes to the zone BUT after any of the reversal patterns is formed in the zone.
To learn more about "Entry signal" and the special version of our "Price Action" strategy FOLLOW our lessons:
Take Profits:
TP1= @ 0.837
TP2= @ 1.041
TP3= @ 1.258
TP4= @ 1.510
TP5= @ 1.887
TP6= @ 2.117
TP7= Free
