Transition point to short-term uptrend: 0.1839Hello?
Hello traders!
If you "Follow" us, you can always get new information quickly.
Please also click “Boost”.
Have a good day.
-------------------------------------
(ZRXUSDT chart)
During day trading, if support is found at important support and resistance points or sections, it often turns into a sharp uptrend.
In that sense, if you look at ZRX's chart,
The volume profile section of the 1M chart is 0.2004.
Therefore, the key is whether it can rise above 0.204.
Therefore, no matter which chart, that is, the 1W chart and 1D chart, the support and resistance points are formed, the most important thing is whether it can eventually break above 0.204.
(1W chart)
The key is whether it can receive support around 0.1649, the volume profile section of the 1W chart, and rise above 0.2274.
(1D chart)
To summarize the movements of the 1M, 1W, and 1D charts,
- It appears ready to transition to a short-term uptrend as it rises above 0.1721, the HA-Low indicator point on the 1D chart.
- Accordingly, if the price rises above 0.1839 and is maintained, it is expected to lead to a movement to rise to the volume profile range of 0.204-0.2274.
- If it rises above 0.204-0.2274, it is expected to lead to an attempt to break upward through the 0.2488-0.2785 range, and if it succeeds, it is expected to form a new wave.
-------------------------------------------------- -------------------------------------------
** All explanations are for reference only and do not guarantee profit or loss in investment.
** Trading volume is displayed as a candle body based on 10EMA.
How to display (in order from darkest to darkest)
More than 3 times the trading volume of 10EMA > 2.5 times > 2.0 times > 1.25 times > Trading volume below 10EMA
** Even if you know other people’s know-how, it takes a considerable amount of time to make it your own.
** This chart was created using my know-how.
---------------------------------
Zrx

ZRXUSDT Broadening wedge!ZRXUSDT Technical analysis update
Buy zone : Below $0.180
Stop loss : $0.171
Take Profit 1 : $0.187
Take Profit 2 : $0.205
Take Profit 3 : $0.238
Thanks
Hexa

ZRX LOOKS BULLISH (12H)Hi, dear traders. how are you ? Today we have a viewpoint to BUY/LONG the ZRX symbol.
For risk management, please don't forget stop loss and capital management
When we reach the first target, save some profit and then change the stop to entry
Comment if you have any questions
Thank You

Resistance, Support, and MomentumZRX is currently trading at $0.2481. The RSI of 69 indicates slight overbought conditions. The $0.2530 Fibonacci level acts as resistance, while the $0.2238 Fibonacci level provides support. The EMA 50 at $0.2175 acts as support, and the EMA 100 at $0.2131 acts as stronger support. The positive MACD value of 0.0040 suggests upward momentum. In a bullish scenario, breaking above $0.2530 and staying above the EMAs could lead to further gains. In a bearish scenario, failing to break resistance and dropping below the EMAs could indicate selling pressure. Key levels: Support at $0.2238, $0.2175, $0.2131 and Resistance at $0.2530.

zrxIt reacted in the first resistance zone. I am waiting for correction for each of the green lines to buy for higher goals. Of course, confirmation of the movement and trend is very important.

ZRX/USDT - 0x: Falling_Wedge◳◱ We've detected a Falling Wedge pattern on the NEWCONNECT:ZRX / CRYPTOCAP:USDT chart. This pattern is a bullish indication and could indicate a potential trend reversal. The next resistance key levels are at 0.2293 | 0.2377 | 0.2529 and the major support zones are respectively at 0.2141 | 0.2073 | 0.1921, We may consider buying at the current price zone at 0.1989 and targetting higher levels.
◰◲ General info :
▣ Name: 0x
▣ Rank: 164
▣ Exchanges: Binance, Bybit, Huobipro, Gateio, Poloniex, Mexc
▣ Category/Sector: Financial - Decentralized Exchanges
▣ Overview: 0x is a permissionless protocol to facilitate trading of Ethereum based tokens including ERC-20, ERC-721, and other Ethereum standards. 0x is not itself a decentralized exchange, but instead a system of smart contracts that connects liquidity providers and market makers in order to provide exchange functionality in a range of applications.
◰◲ Technical Metrics :
▣ Mrkt Price: 0.1989 ₮
▣ 24HVol: 209,930.306 ₮
▣ 24H Chng: -1.045%
▣ 7-Days Chng: -10.50%
▣ 1-Month Chng: -12.74%
▣ 3-Months Chng: -0.73%
◲◰ Pivot Points - Levels :
◥ Resistance: 0.2293 | 0.2377 | 0.2529
◢ Support: 0.2141 | 0.2073 | 0.1921
◱◳ Indicators recommendation :
▣ Oscillators: NEUTRAL
▣ Moving Averages: SELL
◰◲ Technical Indicators Summary : NEUTRAL
◲◰ Sharpe Ratios :
▣ Last 30D: -1.58
▣ Last 90D: 0.53
▣ Last 1-Y: -0.23
▣ Last 3-Y: 0.46
◲◰ Volatility :
▣ Last 30D: 0.49
▣ Last 90D: 0.95
▣ Last 1-Y: 0.93
▣ Last 3-Y: 1.25
◳◰ Market Sentiment Index :
▣ News sentiment score is N/A
▣ Twitter sentiment score is 0.61 - Bullish
▣ Reddit sentiment score is 0.39 - Bearish
▣ In-depth ZRXUSDT technical analysis on Tradingview TA page
▣ What do you think of this analysis? Share your insights and let's discuss in the comments below. Your like, follow and support would be greatly appreciated!
◲ Disclaimer
Please note that the information and publications provided are for informational purposes only and should not be construed as financial, investment, trading, or any other type of advice or recommendation. We encourage you to conduct your own research and consult with a qualified professional before making any financial decisions. The use of the information provided is solely at your own risk.
▣ Welcome to the home of charting big: TradingView
Benefit from a ton of financial analysis features, instruments and data. Have a look around, and if you do choose to go with an upgraded plan, you'll get up to $30.
Discover it here - affiliate link -

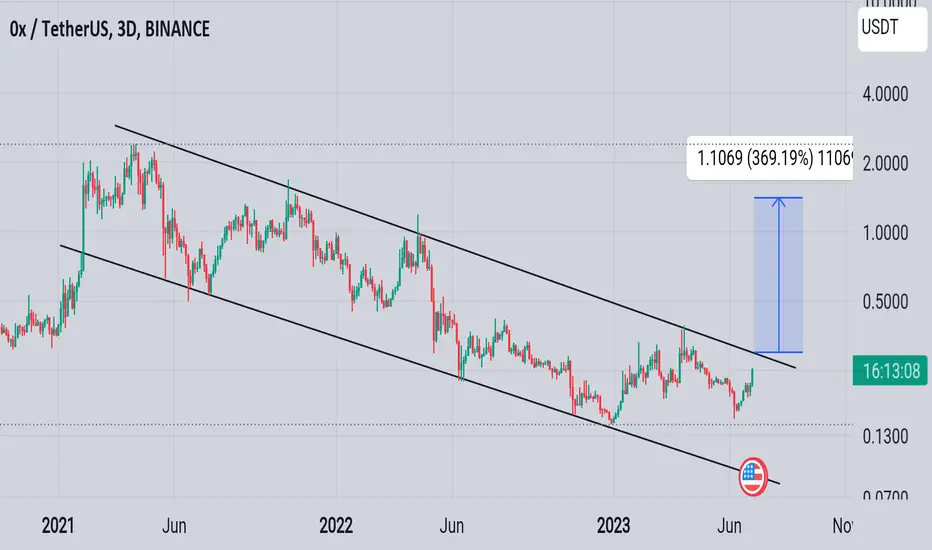
Zrx Getting Ready Formed Descending Channel In 3 Days Timeframe & Testing Channel Resistance Incase Of Breakout Expecting 220 - 240% Bullish Wave
ZRXUSD - Inverted H&SInverted H&S on an angle
This is the 4Hr chart but can be viewed on the daily.
The angle makes the recovery a bit more difficult but it should still see a bounce at the right shoulder point.
Bars pattern shows my thoughts.

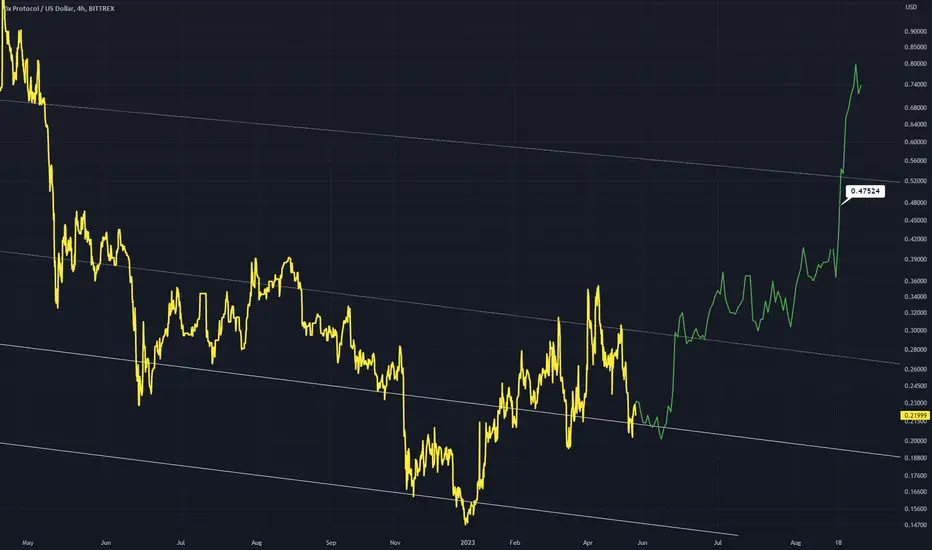
ZRXUSD - Recovery StructureAn idea for ZRXUSD showing an inverted H&S on the side I expect the right shoulder to provide bullish results hitting an upper trend line that could act as resistance at .47 Bars pattern for emphasis
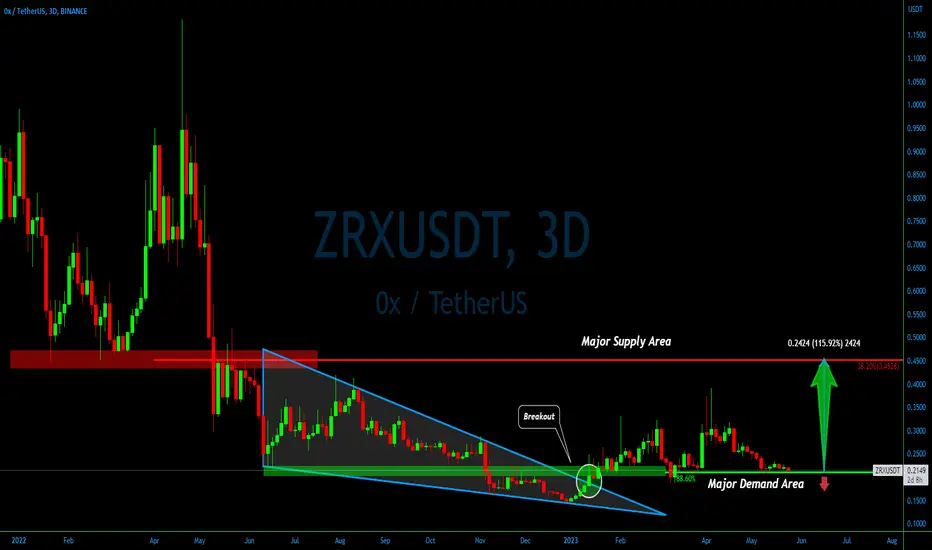
Breakout from the Wedge: #ZRXUSDT Signals Potential 115% Gains💎Earlier this year, #ZRXUSDT broke above the Falling Wedge pattern, signaling a potential uptrend. The subsequent formation of higher highs and higher lows further reinforces bullish outlook.
💎In recent weeks, #0X has been consolidating just above the 88.6% Fibonacci support, aligning with a significant supply/demand zone established over the past year. As long as we maintain a daily close above the 88.6% Fib level, the stage is set for a remarkable price surge of over 115% in the weeks ahead.
💎Our attention now turns to the nearest major resistance and supply area near the 38.2% Fibonacci retracement. This presents a key target for potential gains.
💎While it's essential to acknowledge the current downtrend visible on the daily timeframe, it becomes paramount to closely observe the price action around the current support. MCP team is eagerly watching for signs of strength and confirmation.
💎Stay tuned, Paradisers! We'll be keeping a close eye on the developments and providing you with timely updates on #ZRX. Let's navigate this market together and seek those opportunities for success.
ZRX/btchello traders
this price action for zrx with btc pair
zrx breakout downtrend channel and now in the strong support zone
zrx ready for next move ?
good luck

Ox (ZRX) formed bullish Gartley for upto 90% rallyHi dear friends, hope you are well and welcome to the new trade setup of Ox (ZRX) token with US Dollar pair
Previously I shared a long-term trade setup on a monthly time frame, unfortunately the priceline broke down a long-term support of $0.30 but it is still moving in the potential reversal zone and can start a massive move from here.
Now on a smaller (weekly) time frame, ZRX has formed another bullish Gartely pattern.
Note: Above idea is for educational purpose only. It is advised to diversify and strictly follow the stop loss, and don't get stuck with trade

ZRXUSDT TODAYPLZ DO NOT SELL MY SIGNALS
1-Apply your own risk management.
2-Daily and Weekly Targets
3-Hunt the profits at any level you see convenient for you.
4-Grey Zone for entry,
5-Orange Level Exit by OCO
6-Yellow levels are targets.
have a good day guys.

ZRX midtermhello dear trader
zrx in the uptrend channel
you can buy at dynamic suport and sell in the yellow resistance 😅
good luck❤️

ZRX has promissing targets ahead!#ZRX confirmed higher low following is natural angle + hurdled intermediate descending TL. Possible paths are mostly bullish from here. Risk: losing ascending support.

Ox (ZRX) formed bullish Cypher for upto 34% rallyHi dear friends, hope you are well and welcome to the new trade setup of Ox (ZRX) token.
Previously I shared a long-term trade setup for ZRX, which is stil in play as below:
Now on a 4-hr time frame, ZRX has formed a bullish Cypher move for another price reversal.
Note: Above idea is for educational purpose only. It is advised to diversify and strictly follow the stop loss, and don't get stuck with trade

ZRX Technical Analysis, Overbought or Bullish Trend?ZRX is currently trading at $0.3448, and on a 4-hour timeframe, we see an RSI of 70. This suggests that the price is currently overbought, and we may see a correction or consolidation soon. However, we shouldn't rely solely on RSI, as other indicators can provide more insight.
One such indicator is the Fibonacci levels. ZRX is currently trading above the 0.5 level at 0.3205, indicating a potential bullish trend. However, the price has not yet reached the 1.0 Fibonacci level at 0.3737, which may serve as a resistance level. It's important to keep in mind that Fibonacci levels are not the be-all and end-all of technical analysis, but they can be useful when used in conjunction with other indicators.
Speaking of other indicators, we can also look at the Bollinger Bands. ZRX is currently trading near the upper band at 0.3467, which may indicate that the price is overbought. Conversely, the lower band at 0.2571 may serve as a support level if the price were to drop. The middle band at 0.3019 can also indicate the overall trend.
The volume oscillator is currently at +7.15%, which may suggest that there is buying pressure in the market. Additionally, the MACD value is positive at 0.0150, indicating that the price may continue to increase. However, the stochastic oscillator is at 81.80, which may suggest that the price is overbought and could be due for a correction.
So, what does all this mean for ZRX? Well, we can't predict the future with 100% accuracy, but we can use these indicators to form a more informed opinion. While the RSI suggests that the price is overbought, the positive trends in the volume oscillator and MACD may indicate that the price will continue to rise. On the other hand, the high stochastic oscillator may suggest that we'll see a price correction soon.
When it comes to key prices, we can look at local support and resistance levels. A solid support level may be found at the lower Bollinger Band of 0.2571, while resistance may be found at the 1.0 Fibonacci level of 0.3737. It's important to keep an eye on these levels, as a break in either one could signal a change in the overall trend.
Overall, ZRX is an interesting asset to watch. By combining various technical indicators, we can get a better idea of where the price may be headed in the short term.

ZRX - Falling Wedge and Down ChannelPrice is currently within a large down channel
I expect a move up to the top of the channel and then revert back to the norm of back within the channel
It is possible that price breaks the channel and continues up to the thick horizontal line. Speculative though.
Falling Wedge Breakout

#ZRX Wait until wave 4 correction is completed to buyThe 1-hour time frame is completing a full cycle, which is currently in the 4th correction cycle. After completing this correction, it can complete the 5 ascending wave up to the specified area.

ZRX COIN PUMP 60% IN TWO DAYS , WHAT NEXT ?in last two days zrx coin almost pump opto 62%... and now currently trade at 0.33$.
if you buy this token few days ago then i recommand you that book your profit... becauze we did not see any important news and update behind this pump.
rsi and others indicators now look bearish om zrx token.
if you open position in short on zrx token btween 0.35-0.36$ then must use stoploss.
if you did not open any position in short then wait till its price reach at 0.40$ minimume.... and don't use upto 2% fund this coin .
1st support area 0.29$ & 2nd supprt area is 0.24$.
follow me for update about crypto.

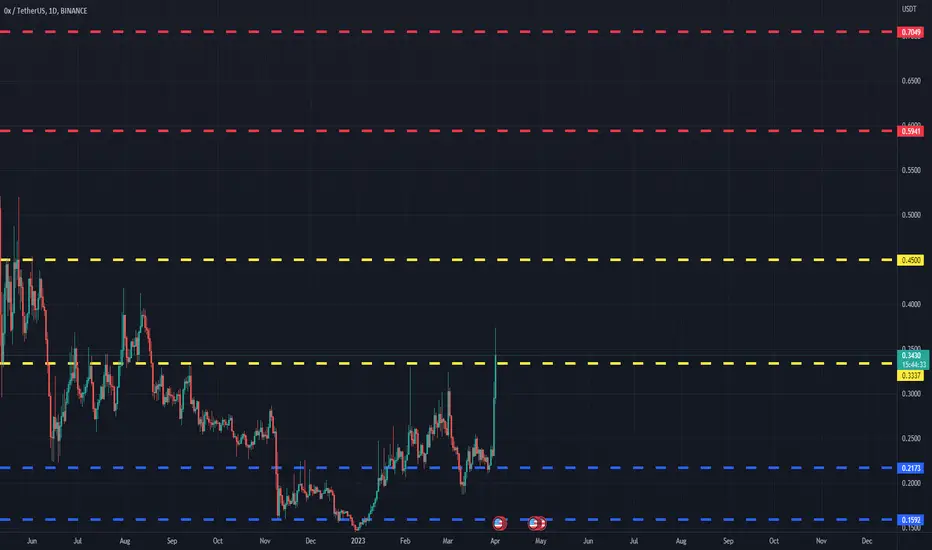
ZRXUSDT(0x) Daily tf Range Updated till 01-04-23ZRXUSDT(0x) Daily timeframe range. solid pump where btc dominance still high. a clean break from #0.3337 open a space till #0.4500. it got some decent volume now so its not that hard. if selling pressure takes over a failed break will lead it back to lower levels.
0x maybe or ZRXnot sure what this protocol is seeking to accomplish but they are at a significant discount when looking at the value. once the market turns around this along with everyhting else will run, this will have some nice gains for a simple trade

zrx#ZRX Assuming the run up by traders speculating the base protocol by #coinbase if this has legs we can short around the labeled price. #OP ran up via the partnership, people who missed it want to long
@0xProject
due to their NFT coinbase partnership?
