GOLDPreferably suitable for scalping and accurate as long as you watch carefully the price action with the drawn areas.
With your likes and comments, you give me enough energy to provide the best analysis on an ongoing basis.
And if you needed any analysis that was not on the page, you can ask me with a comment or a personal message.
Enjoy Trading ;)
Futures market

NQ Short (forced trade)Well, this is a forced trade opp. It means that iam not very sure but i would take this opp anyways.
Here are my two cents. ES looks bullish to me, while NQ is bearish. Which is something odd.
Anyways, here is the trade. Be careful taking it with size, because iam very well could be wrong.
Good luck everyone!!

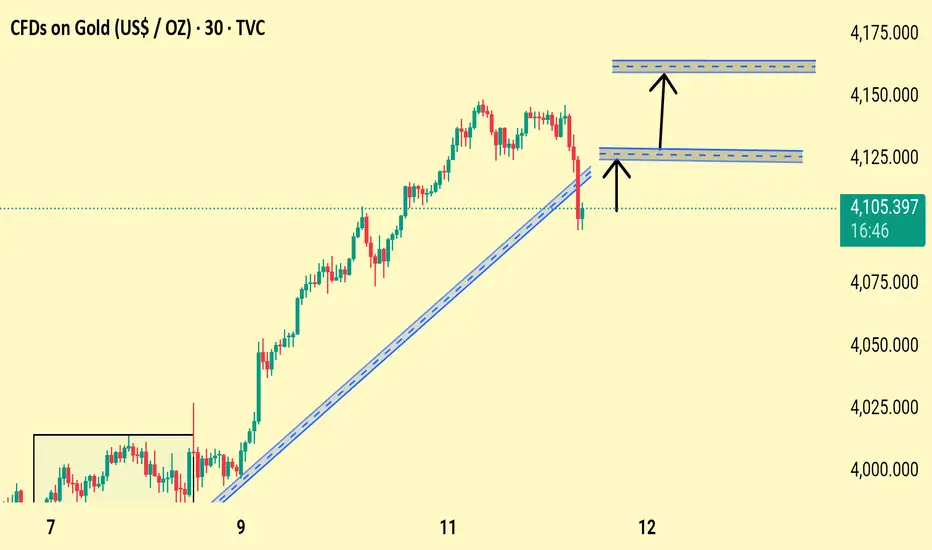
Gold Price Rebound Setup After Trendline Break – Bullish TargetsGold has pulled back sharply after breaking below the ascending trendline, but price is now stabilizing near the 4100 zone. Chart highlights two key bullish reaction levels around 4120 and 4158, where buyers may re-enter. A clean push above 4120 could open the path toward the upper resistance near 4158, signaling continuation of the broader uptrend.
✅ Trend Break but Recovery Attempt
Price broke below the rising trendline, showing short-term weakness. However, buyers quickly reacted, pushing price back above the 4100 level.
✅ Key Levels to Watch
Immediate resistance: 4120
Next bullish target: 4158–4160 zone
✅ Bullish Scenario
If gold holds above 4100–4105, price can retest 4120.
A breakout above 4120 should trigger momentum toward 4158–4160.
✅ Bearish Risk
A drop back below 4100 invalidates the bullish setup and may push price toward 4060.

GOLDWaiting for price to break out of the potential range between 4095 - 4147.
Looking for a retest of the range @ 4147 to continue bullish long term to 4380.
This is just an idea, please remember to trade according to your plan.

Gold Intraday Trading Plan 11/13/2025As predicted, gold rose from 4100 for another 1k pips and closed the day just below 4200. Today should be another buying day. I am looking to buy from 4157, targeting 4281.

Gold Regains Its Shine as Buyers Take Control of the Market!Hello traders,
After days of consolidation, gold surged sharply during the Asian session , reclaiming the key psychological level of $4,000/oz. The weakness of the U.S. dollar, combined with expectations that the Federal Reserve may cut interest rates in December , has reignited investor optimism. Meanwhile, efforts by the U.S. Congress to end the government shutdown have further strengthened gold’s position as a safe-haven asset.
On the chart, gold is showing a strong rebound from the $4,000 support zone , where buyers previously stepped in with significant volume. The potential scenario suggests that price may pull back slightly toward $4,000 before continuing its climb toward the $4,200 resistance area, which aligns with the previous swing high and a key supply zone.
If price breaks above $4,200, the bullish momentum could extend further , targeting the $4,300 area in the medium term. Market sentiment remains firmly in favor of the bulls, and gold appears ready for a fresh breakout this week .
Wishing you all successful trades!

Gold Pulls Back to 4200 – Awaiting Direction Confirmation📊 Market Overview
Gold (XAU/USD) has just dropped from the resistance zone $4218–$4219 down to $4203.
The market is currently reacting near the support zone $4200–$4205, with buying pressure starting to appear, but short-term bullish momentum is weakening.
The H1 trend remains slightly bullish, with EMA20 & EMA50 pointing upward, providing support around $4205–$4210.
📉 Technical Analysis
• Main Trend: Slightly bullish (bullish bias).
• EMA20 & EMA50 H1: Upward sloping, support at $4205–$4210.
• Resistance: $4218 – $4222, further $4230 – $4235
• Support: $4205 – $4200, further $4195 – $4190
• RSI H1: Dropping from overbought → warning of a short-term pullback.
📌 Outlook
• The $4205–$4207 zone is a key support; if price holds, a rebound toward $4212–$4215 is likely.
• If price breaks below $4205, a deeper drop toward $4195–$4190 may occur.
• H1/H4 candle signals will determine the next breakout direction; priority is to BUY on support bounces and SELL on clear rejection at resistance.
________________________________________
💡 Trading Strategy
🔺 BUY XAU/USD: $4190 – $4193
• TP: 40 / 80 / 200 pips
• SL: $4186
🔻 SELL XAU/USD: $4233 – $4236
• TP: 40 / 80 / 200 pips
• SL: $4239

The mistake that kept me broke for 2 years!Hey @TradingView Community, I want to tell you something personal...
For two years, I was stuck.
I kept losing trades and I couldn’t figure out why.
It wasn’t because I didn’t work hard.
It wasn’t because I didn’t study the charts.
It was because I was following a trading style that looked smart on paper but failed in real life.
Every week, I waited for that ONE “perfect” setup.
I told myself, “This is how real traders do it.”
But most weeks, nothing came.
And when I finally saw something, I was either late or scared to take it.
Then came the worst part.
After waiting for days and missing good trades, I got frustrated.
So I started forcing trades just to feel like I was doing something.
And of course, I lost even more.
It became a loop:
Waiting → Missing → FOMO → Losing.
Even more? I traded based on emotions and started to add to losing positions! And of course, more losses.
It was too complicated, too slow, and not made for real traders like us.
And of course, everything was built on a foundation of simple to advanced chart patterns and Smart Money Concepts (SMC), candlestick patterns, Elliott waves... I’ve experimented with nearly every well-known form of technical analysis you can think of.
After thousands of hours of studying and backtesting the charts, we discovered a powerful and consistent edge rooted in Wave Analysis.
From our research and findings, we developed our own unique system, the We Trade Waves Wave Analysis Concept. You can see the proven results on our website.
But we also realized that analysis is only one part of the equation, the most important part is building the right mindset and finding your own balance, all while following a proven trading system like the one we’ve built and refined today.
We created a trading system you can follow in a simple and calm way.
You need a working trading system that takes about 15 to 30 minutes a day, and it actually works.
The system that helped me get my time, focus, and money back.
It's the same We Trade Waves system we are teaching to We Trade Waves members now.
And don't forget WTW 4 Golden rules!
1) Do not jump in
2) Do not over risk/trade
3) Do not trade without Stop Loss
4) Never ever add to a losing position!
Take with care,
Alain M(Coach)
WTW Team
TVC:GOLD NYSE:DOW SP:SPX NASDAQ:NDX

Shutdown Deal in Focus | Gold Prices Pause Before Key VoteGOLD | Overview
Gold steady ahead of U.S. House vote on government reopening.
Gold prices remained steady on Wednesday as investors awaited a U.S. House of Representatives vote on a deal to reopen the federal government, an outcome that could restore economic data visibility and shape expectations for future Federal Reserve rate cuts.
Technically:
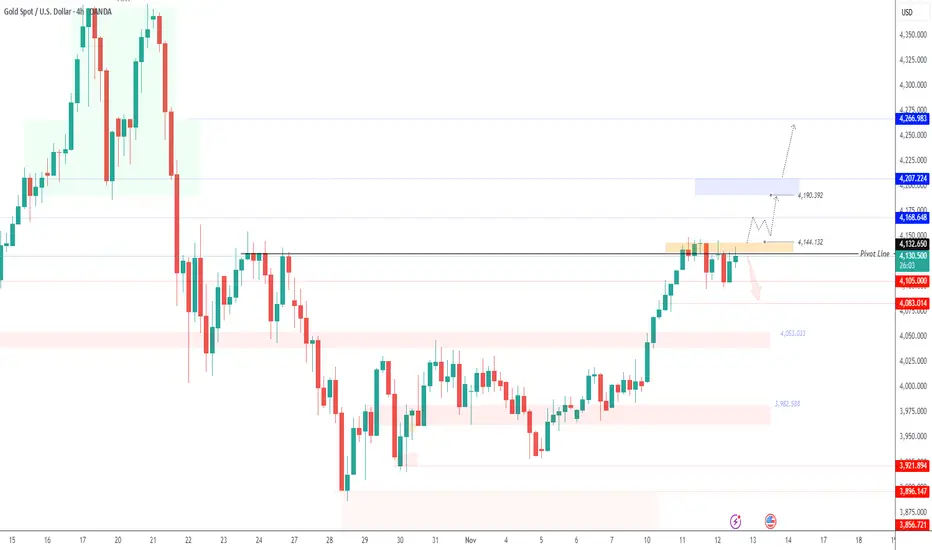
Gold maintains a bearish bias while trading below the 4132–4144 pivot zone, with downside potential toward 4104, and a break below this level could extend losses to 4083 and 4053.
However, a 1H close above 4145 would shift sentiment to bullish, targeting 4168 and 4190, with further extension possible toward 4207.
Pivot Zone: 4132 – 4144
Resistance: 4168 · 4190 · 4207
Support: 4104 · 4083 · 4053
Gold Market Moving Exactly As MappedVANTAGE:XAUUSD tapped perfectly into my OG Demand Zone around
4,020–4,050 and buyers stepped in exactly where the system expected. The bounce carried straight into my upper OG Supply Zone, and today’s wick shows clear hesitation right on the zone border.
The structure is still holding a bullish tone as long as price stays above the OG Trend Zone support at 4,050–4,100.
My X-pattern intersection also acted as a confluence pivot, guiding the move into the current rejection point.
Short-term 🐼 I am watching for a sweep of the supply zone highs and a cleaner reaction.
Mid-term I still prefer long setups only after a pullback into my green demand zone where momentum can reload.
Both OG Zones and OG Trend Zones played this move with precision. The system mapped the bounce, mapped the continuation, and is now catching the rejection area.
📊 Current bias: Neutral to bearish inside supply
🟢 Long interest: Rebuilds on a dip back into demand
🔴 Short interest: Only if supply shows clean rejection
📆 Watching daily close for confirmation

Gold price analysis November 13
Gold continues to maintain its bullish momentum after successfully breaking above the 4150 resistance zone. This breakout confirms the strength of the uptrend, with the recently broken area now acting as a solid support base. The next target that buyers are likely aiming for is around 4250, before testing the all-time high zone.
From a trading perspective, the focus remains on BUY setups—either on breakout entries or pullbacks to support. As long as price holds above 4150, the bias stays bullish and traders can consider holding positions to extend profits along the trend.
BUY setup: Watch for price reaction around 4150 support
💬 Feel free to share your thoughts and analysis below. I’d love to hear different perspectives from the community!

XAUUSD Trade IdeasSell at zones. only enter after 5 minute Bearish confirmation. If it cross without bearish confirmation then zone will be invalid. Make sure to enter only after 5 minute confirmation.

GOLD XAUUSD GOLD ,the daily structure held buyers firmly at 4100-4099 level and they will face a strong daily rejection approaching the neckline of the daily double top structure at 4260-4255 zone .
the probability is high that buying will extend into this zone ,my argument is backed by daily ascending trend line cross and the daily retest.
if 4120 rejection holds then we will retest 4107 yesterday high and keep the buying into 4260-4255 zone .
GOODLUCK.

Gold is correcting.This analysis is based on the principles of Elliott Wave. According to my analysis, we are facing a Zigzag correction. Wave A has completed as a 5-wave downtrend. The current uptrend is wave B, which has appeared as a multiple zigzag (so far double). I think we will soon see a downward wave C of the Zigzag.

Gold Price Rebound Setup from Support ZoneGold price is consolidating above the support zone near 4,100 after a pullback from the resistance level around 4,140. A potential bullish rebound could target 4,120 first, with an extended move toward 4,135 if momentum strengthens.

SILVER | Inverse Head & Shoulder Forming – Big Move Ahead?#SILVER is currently moving sideways and forming a perfect Inverse Head & Shoulder pattern on the 1-hour timeframe
This pattern often signals a potential bullish reversal, but we’ll wait for confirmation — a clean breakout above the neckline or resistance zone.
Trade Plan:
Wait for breakout and retest of the neckline/resistance
Enter long after confirmation
Use proper risk management (SL below the right shoulder)
If the breakout holds, #SILVER could start a strong bullish rally soon!
What’s your view on this setup? Are you bullish or waiting for more confirmation?
Drop your thoughts in the comments!
#Silver #XAGUSD #PriceAction #TechnicalAnalysis #TradingSetup #ChartPattern #HeadAndShoulders #BullishReversal #TradingViewCommunity

SILVER XAGUSD SILVER demand floor at 48-47$ will be challenged at 51.385$-52$ zone, should we break and close above this level we could be seeing more upswing into 54.303-55 zone and a retest supply roof .
key fundamental outlook
Electronics & Electrical: Silver’s unmatched electrical conductivity makes it vital in smartphones, data centers, automotive electronics, and other high-tech devices.
Solar Photovoltaics (PV): Rapid growth in solar panel production has sharply increased silver demand
Electric Vehicles (EVs): EVs use 25-50 grams of silver per vehicle in electrical contacts, battery management, and thermal system
5G Infrastructure: Silver is used extensively in 5G equipment, including connectors and amplifiers.
Medical uses (antimicrobial properties), water purification, advanced computing cooling systems, and IoT continue to expand silver's demand base.
Supply Deficit: The silver market has experienced a supply deficit for several consecutive years, tightening physical availability and supporting prices.
Safe-Haven Demand: Alongside gold, silver benefits from investor demand during geopolitical and economic uncertainties.
silver remains bullish despite pullback ,price will keep rising .

Gold Trade Plan 12/11/2025Dear Traders,
Gold will continue its bullish trend within the corrective phase.
The 4150–4160 zone is very important — if it breaks strongly, I expect the price to move toward the 4190–4200 area.
Regards,
Alireza!

Gold Maintains Uptrend, Watch for Pullback to Buy with Cash Flow🔍 Context & Market Structure
After a strong upward impulse from a low liquidity area, the price has broken the downtrend structure and formed a bullish BoS on H1.
Currently, gold is accumulating above the Support Zone at 4,183 USD after creating a new peak and leaving a FVG just below the current price .
Above is the Liquidity Zone $$$ around 4,232 USD – a concentration of sell-side stop losses and buy-side profit-taking orders, likely to create a “final push” that attracts liquidity.
=> Overall: the main trend remains bullish , prioritising waiting for a pullback to discount levels to buy with the trend rather than chasing orders at high levels.
💎 Key Technical Zones
Liquidity Zone $$$: around 4,232 USD – upper liquidity area, prone to profit-taking reactions.
Current FVG: price gap area just below the current price (around 4.20x) – expected to “fill the gap” before continuing.
Support Zone 1: 4,183 USD – nearest support, confluence with the area where the upward impulse began to slow.
Support Zone 2: 4,140 USD – stronger support, aligning with the old structure.
Liquidity Clear: 4,101 USD – lower liquidity area, if swept, it would be a very attractive discount for swing buyers.
📈 Proposed Trading Scenarios
1️⃣ Main Scenario – Buy with the trend at FVG / 4,183 USD
Priority to wait for the price to:
Either fill the FVG around 4.20x and show a rejection candle,
Or clearly retest Support 4,183 USD with a bullish reversal signal on M15–H1.
When a confirmation signal appears:
→ Consider buying (BUY) around 4.19x – 4.18x .
Stoploss: below 4,175 USD (below the nearest low and support).
TP reference:
TP1: 4,210 USD
TP2: 4,232 USD (Liquidity Zone $$$)
TP3: trailing if the price breaks through 4,232 and maintains the bullish structure.
2️⃣ Alternative Scenario – Deeper Pullback Before Continuing Upward
If the price clearly breaks 4,183 USD and closes an H1 candle below:
→ Avoid buying hastily, wait for the price to continue adjusting to Support 4,140 USD or even Liquidity Clear 4,101 USD .
At these zones, if there appears:
strong rejection candles,
or small reversal structures (bullish ChoCH on M15),
→ Then consider buying at a discount with better RR, targeting a return to 4,183 → 4,210 → 4,232 USD.
3️⃣ Short-term Sell Scenario (for experienced scalpers only)
If the price hits Liquidity Zone 4,232 USD but shows strong rejection (long wick, high sell volume):
→ Consider short-term sell scalp back to the 4.20x – 4,183 USD area.
This is a counter-trend trade, so:
keep the volume small,
short TP,
tight SL above the newly formed peak.
⚠️ Risk Management Notes
Do not FOMO buy when the price is testing near the 4.23x area – this is a prone-to-sell area.
Prioritise waiting for a pullback to FVG / Support for a better entry point and RR.
Always adjust volume according to actual SL, avoid over-leverage during strong market volatility.
“Buy the dip in liquidity zones, do not chase orders at the peak – that's how to go with the big money flow.”

OUTLOOK XAUUSD 1H Analysis (13th November 2025)This is not a financial advise, It's just a trading idea.
BUY/SELL SCENARIOS:
BUYS:
1) Body candle close above the 4211.72 level.
2) Retest the Previous Daily High at the 4211.72 level.
3) Create a 5/15m Bullish Engulfing Candle to capitalize on BUYS towards the 4272.50 level.
SELLS:
1) Sweep the Previous Daily High at the 4211.72 level.
2) Create a 5/15m Bearish CHOCH with a body candle close (with a FVG).
3) Retest the 5/15m Bearish CHOCH Level to capitalize on SELLS towards the 4149.00 level.
Trade smart, Trade according to your plan.

GOLD USD📊 GOLD / USD – 2H Technical Analysis
Price is currently trading around 4,195, still below the key 4,254 pressure zone.
The market remains in a clear bullish channel with momentum gradually slowing down as price approaches this critical area.
🔹 Current Structure:
The uptrend is still intact with higher highs and higher lows.
4,254 acts as a potential liquidity / reaction zone where short-term rejection or consolidation may occur.
If the price holds above 4,232 – 4,213, continuation toward the 4,336 – 4,370 supply zone is likely.
A strong rejection from 4,254 could trigger a correction toward 4,100 (major demand area).
🔹 Expected Scenario:
Price may first push up to test 4,254, then react with a minor pullback before continuing higher.
If momentum breaks through cleanly, bulls may target the 4,336 – 4,370 range.
📈 Bias: Bullish, but with caution near 4,254 (liquidity zone).
⚠️ Disclaimer:
This analysis represents personal opinion only and is not financial advice.
Always manage your own risk before taking any trades.
