Gold daily projection Gold opens the Asian session around the 4180’s, aligning with the daily candle formation that seeks to reclaim bullish momentum. With buyers gradually re-establishing control, the market is projecting a continued move toward the 4250’s, where higher-timeframe interest remains concentrated. follow for more insights , comment and boost idea
Futures market

Gold market daily projectionGold market opens at 4210, completing a mitigation of 4195 before continuing its bullish daily projection.
With upside momentum still dominant, 4237 remains a key upside level yet to be taken out, serving as the immediate liquidity target for continuation. follow for more insight ,comment and boost idea.

XAUUSD Bullish Reversal Setup – Breakout Target AheadGold (XAUUSD) is currently reacting from a major intraday support zone after a sharp correction. Price has tapped into the lower liquidity area and is showing early signs of potential bullish reversal.
🔶 Key Levels & Structure
Strong Support Zone: Price is testing a major demand area where previous bullish moves originated.
Breakout Zone: A minor breakout is expected once price breaks above the short-term resistance structure.
Strong Resistance: A bigger bearish liquidity block sits below, but the market is currently respecting the upper demand.
Breakout Target: If bulls gain momentum, price could push toward the 4165–4175 supply area.
📈 Bullish Scenario
If price holds above the current support and breaks the short-term structural high, we may see a clean bullish continuation toward the upper breakout target zone.
📉 Bearish Scenario
Failing to hold current support could drag price back down into the lower liquidity pools before any strong reversal attempt.
📝 Overall Outlook
Market structure favors a bullish recovery, but confirmation is required through a clear breakout of short-term resistance. Traders should wait for strong candle closures to avoid false moves.
🔥 Title Suggestions
Gold Ready for a Bullish Breakout from Key Support
XAUUSD Reversal Setup – Watching the Breakout Levels
Gold Analysis: Strong Support Holding, Breakout Target Ahead
XAUUSD Bulls Preparing for Next Rally


Bullish breakout?WTI Oil (XTI/USD) is reacting off the pivot, which acts as a pullback support that aligns with the 50% Fibonacci retracement and could bounce to the 1st resistance.
Pivot: 59.54
1st Support: 59.01
1st Resistance: 60.82
Disclaimer:
The opinions given above constitute general market commentary and do not constitute the opinion or advice of IC Markets or any form of personal or investment advice.
Any opinions, news, research, analyses, prices, other information, or links to third-party sites contained on this website are provided on an "as-is" basis, are intended to be informative only, and are not advice, a recommendation, research, a record of our trading prices, an offer of, or solicitation for, a transaction in any financial instrument and thus should not be treated as such. The information provided does not involve any specific investment objectives, financial situation, or needs of any specific person who may receive it. Please be aware that past performance is not a reliable indicator of future performance and/or results. Past performance or forward-looking scenarios based upon the reasonable beliefs of the third-party provider are not a guarantee of future performance. Actual results may differ materially from those anticipated in forward-looking or past performance statements. IC Markets makes no representation or warranty and assumes no liability as to the accuracy or completeness of the information provided, nor any loss arising from any investment based on a recommendation, forecast, or any information supplied by any third party.

Gold is about to break to the upside.Gold was sideways for a while. So we could not find any trade. But it is about to break now.
Get ready...

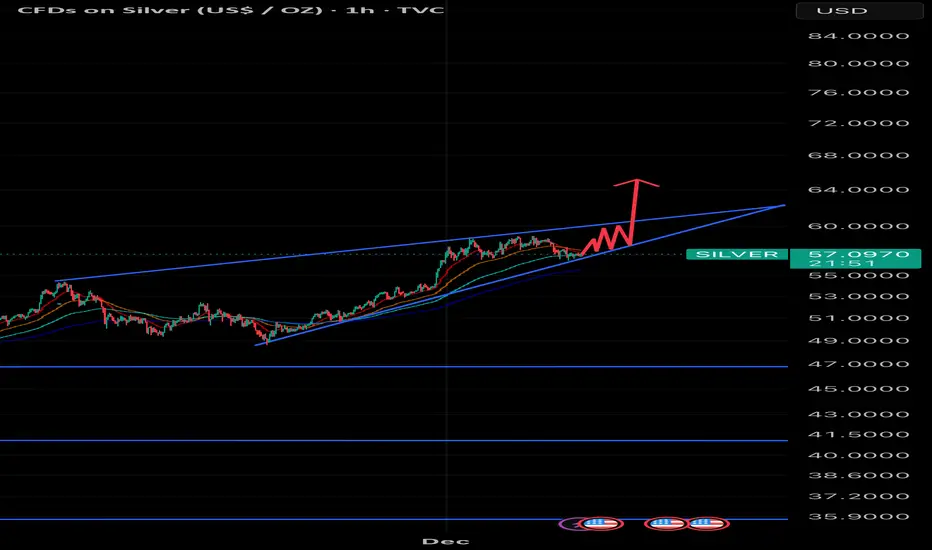
XAGUSD--LONG--Long bias
--entry and tp levels are as shown on the chart
--Also check below 12M chart I published before. (I added down below)

WILL GOLD STILL GO SIDEWAYS TODAY? WHAT DO YOU THINK?1. Overview
Yesterday's candle formed a Doji → the market is hesitant, not showing a clear main trend.
Today, if the candle closes below the support zone → prioritize SELL,
If the candle closes above the resistance zone → prioritize BUY.
2. Expected Trend
The market is likely to move sideways within the range:
4170 ⇄ 4220
Strategy: Trade according to the zone – follow the breakout of any boundary.
3. BUY ZONES
4180-4175
4155-4160
🔸 SL: 100 pips
🔸 TP: 100 pips
4. SELL ZONES
4217-4220
4230-4333
4240-4244
4260-4265
🔸 Wait for a clear price reaction in the zone before entering a trade.
5. Important Notes
Plan applies before the 22:00 news.
Break any zone, then follow that zone. Do not try to catch tops and bottoms.

Gold ready to blast Yesterday's gold rices were sideways in a range .
Now trying to breakout from consolidation and readyvto move .
Details shared in chart


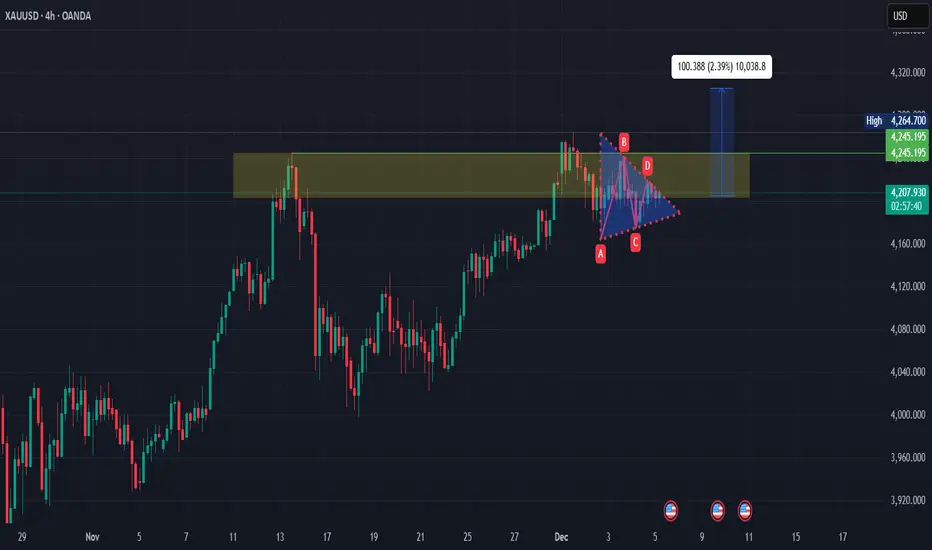
Symmetric Triangle Formation Once we get a clear close outside the symmetric triangle we can enter a trade.
Minimum 100points we can expect out of this trade. My view is bullish, so I am expecting this to break upwards i.e crossing the tringle ~4221 resistance level.
i.e minimum target can be ~4305 - ~4320 or
Current market is in a strong resistance level you can see it in the yellowish highlight zone.
We need to be careful in this zone trade with lesser quantity is wiser.
Never forget to protect your funds.
Gold Long Entry: gold looks strong, money will flow to XAUUSDgold is looking very strong bullish and any dip level liquidity zone will be a very good buying opportunity < Gold Long Entry: gold looks strong, money will flow to comodities

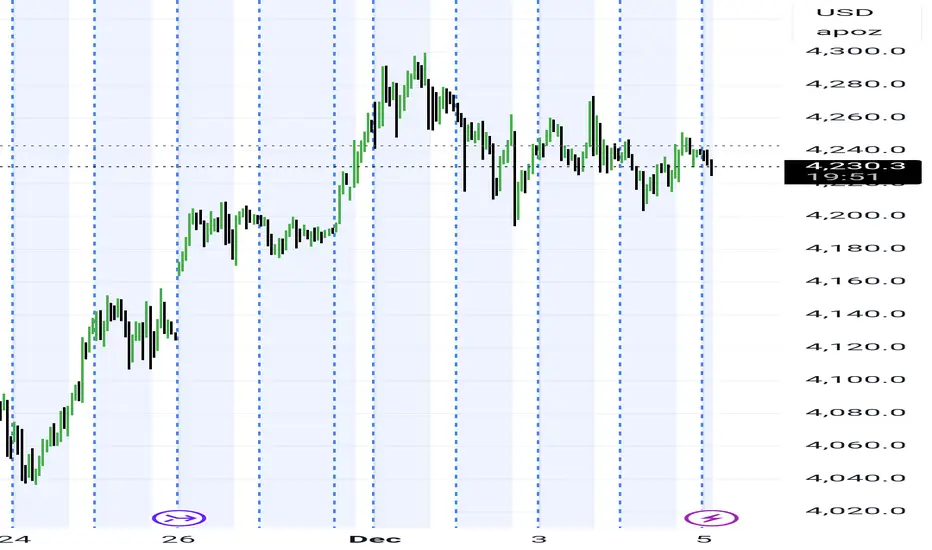
5/12/25 Can Bears Get FT Selling or Retest Above 20-Day EMA?
Thursday’s candlestick (Dec. 4) was a bear bar closing in its lower half with a small tail below.
In our previous report, we stated that traders would watch if the bears could create follow-through selling and close far below the 20-day EMA, or if the market would trade slightly lower but close with a long tail below and above the middle of the candlestick.
The market traded lower and closed below the 20-day EMA.
The bulls hope the selloff (Nov 26) will form a major higher low.
The bulls hope to get a reversal from a large wedge pattern (Jan 17, May 8, and Nov 26).
They see any pullback simply as a retest of the November 26 low, and want it to be weak (overlapping candlesticks, poor follow-through selling), forming a higher low major trend reversal.
They must produce strong follow-through buying above the 20-day EMA to show they are clearly in control.
The bears want the 20-day EMA to act as a resistance level, followed by a retest of the November low.
If the market trades higher, they want the November 19 high to act as resistance (around 4250-4300 area)
They hope for a strong third leg down to form the wedge pattern, with the first two legs being Nov 13 and Nov 26.
Fundamentals
• Production: Production may be down in December.
• Refineries: Buying interest is there at these low prices. Not paying premiums vs spot futures.
• Exports: ITS first five days of Dec: TBA
The market sold off in a tight bear channel, followed by a tight trading range in November, which could be a possible final flag, followed by a second leg sideways to down (Nov 26).
The market formed a pullback towards the 20-day EMA this week.
Next, traders will see the strength of the retest of the November 26 low. Will it be strong, breaking below the Nov 26 low? Or will it be weak, perhaps stalling around the December 2 low area?
Bulls want a strong bull bar today so that the weekly candlestick will close in its upper half, while the bears want a strong bear bar today so that the weekly candlestick will have a bear body and a long tail above.
Today (Friday, Dec. 5), traders will watch to see whether the bears can create follow-through selling and close far below the 20-day EMA, or will the market trade higher to retest the area near the 20-day EMA instead?
Andrew

Copper Shows Steady Relative Strength Against Equities (HG1!/SPYCopper continues to show steady relative strength against the S&P 500 on the daily timeframe.
Because copper is highly sensitive to economic activity, this ratio often provides an early read on underlying growth trends and industrial demand.
Key observations from today’s structure:
• Price remains above key moving averages, reflecting improving trend stability
• RSI is firm, showing constructive momentum
• Volume behavior supports the recent advance
• ATR remains controlled, indicating steady rather than volatile movement
A rising HG1!/SPY ratio often aligns with improving macro conditions and stronger growth expectations.
Monitoring this ratio across multiple timeframes helps clarify whether economic momentum is strengthening or weakening beneath the broader equity surface.

The Market Doesn’t Wait — But Winners Don’t Hesitate.The market has transitioned into a short-term bearish cycle after sweeping the buy-side liquidity above 4243. A clean CHoCH → BOS sequence confirms the shift from bullish displacement into redistribution, signaling bearish orderflow dominance.
📌 1. CURRENT TREND — MARKET STRUCTURE
The chart is showing a short-term bearish structure on H1 because:
- After forming a HH, price broke the previous low → BOS to the downside.
- Current structure: LH → LL → LH → minor HL → LL.
- Price is heading toward the 4,181 – 4,163 support zone, which is a major structure low.
➡️ H1 trend: short-term bearish (deep pullback)
➡️ Higher-timeframe trend (H4/D1): still bullish → this drop is a corrective move.
📌 2. KEY LEVELS — SUPPORT & RESISTANCE
Main Resistance
- 4,225 — previous swing high and key liquidity target.
Major Support Zones
- 4,181 — mid-range support, likely first reaction point.
- 4,163 — key structure low; strong zone where a new HL may form.
📌 3. MAIN SCENARIOS
Scenario 1 (Primary Scenario): Price taps 4,181 → small sweep → pushes up
Price may form a small internal LL/HL pattern near 4,181.
Potential for liquidity sweep / double bottom.
If price confirms, it will push back toward:
- 4,200
- 4,215
- Main target: 4,225
➡️ This aligns with the higher-timeframe bullish trend + H1 pullback.
Scenario 2 (Cleanest & Highest RR): Price sweeps 4,163 then reverses
- A strong liquidity grab around 4,163 forms a major HL.
- This is where smart money typically accumulates positions.
- A bullish BOS afterward confirms the reversal on H1.
➡️ Best risk-to-reward setup.
📌 4. ENTRY – SL – TP
🎯 ENTRY 1: 4,181 – 4,185 (after rejection/confirmation)
SL: below 4,172
TP1: 4,200
TP2: 4,215
TP3: 4,225
🎯 ENTRY 2 (safer, high RR): 4,163 – 4,168
SL: below 4,150
TP1: 4,185
TP2: 4,200
TP3: 4,225
📌 5. SUMMARY
H1 structure is bearish, but it is simply a deep pullback inside a bullish higher-timeframe trend.
The best long setups are at 4,181 and 4,163.
Once a new HL forms, bullish continuation targets 4,225.
Every pullback is a chance — not a punishment. Stay patient, trust your structure, and execute like a pro.

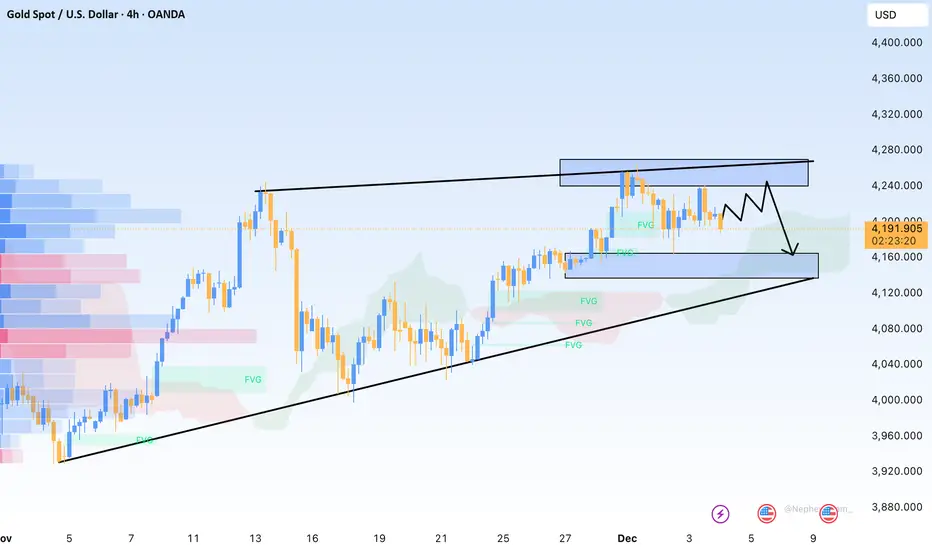
XAUUSD – 30m | Channel Break → Retest → Bearish Liquidity Sweep OANDA:XAUUSD
The 4,240 resistance remains a strong rejection point, with price now trading inside a lower-timeframe distribution. Liquidity sits below 4,177 and 4,155 where previous reaction points remain untested. As long as market holds beneath 4,240, the downside continuation remains the more probable scenario.
Key Scenarios
📉 Bearish Continuation (Primary Plan)
Confirmation: Lower-high → rejection from 4,210–4,220
🎯 Target 1 → 4,177.5 (Liquidity sweep)
🎯 Target 2 → 4,155 (Support zone base)
📈 Bullish Invalidation
A clean break and hold above 4,240 would flip the structure bullish again.
Current Levels to Watch
Resistance 🔴: 4,240.677
Support 🟢: 4,177 | 4,155
⚠️ Disclaimer: This analysis is for educational purposes only — not financial advice

Gold Buy iminent buy because i can and if it loses it loses. market is in consolidation and it lloks like a buy from the daily chart

Day 80 — From Green to Red: The Danger of OverstayingEnded the day -$256 trading S&P Futures. I was actually up +$250 early in the session, but I made the mistake of itching for more after playing it safe with small gains all week. I decided to size up to 6 contracts on a Buy signal that looked solid, but the market had other plans. We saw a "flash crash" out of nowhere that stopped me out, only for price to rip all the way back up after tagging the 10-minute MOB. It felt scammy, stressful, and honestly, it ruined the day. It’s a harsh reminder that right now, the longer you stay in this market, the more dangerous it gets.
🔔News Highlights: *S&P 500, NASDAQ END HIGHER, VIX FALLS AS INVESTORS BRACE FOR KEY INFLATION DATA
📈
Key Levels for Tomorrow:
Above 6840= Bullish Level
Below 6830= Bearish Level


London setup London will create the low of the day & NY session will be a continuation of London session today with greater portion of displacement.
Gold Surges on Weak US Data but Momentum FadesHello everyone,
Last night, spot gold on the international market saw a sharp rally of several dozen dollars per ounce after the US released a series of economic reports that came in weaker than expected — particularly labour market data, which strengthened expectations that the Fed may accelerate its rate-cutting path. This is generally positive for gold, as lower interest rates reduce the opportunity cost of holding non-yielding assets.
However, shortly after the breakout, the market witnessed a large wave of profit-taking from institutional investors, causing gold to reverse and drop sharply.
The downside pressure did not come solely from profit-taking; it was also reinforced by a US economic backdrop showing mixed and increasingly unstable signals: weak employment data, slowing growth prospects, and rising expectations of imminent Fed rate cuts. These factors have left capital flows uncertain — torn between holding gold for safety or shifting toward risk assets as US equities recover slightly.
From my perspective, gold is now standing at a critical crossroads:
Weak US data could support another upward leg.
A dovish Fed remains a strong underlying foundation.
But persistent profit-taking may prolong the short-term correction.
Gold’s next move will depend heavily on upcoming US economic releases this week and how the market reacts to shifting expectations around the Fed’s monetary policy.
Wishing everyone a clear-headed and successful trading day ahead!
Rising Channel / Ascending TriangleLooks like this could be a good set up for silver right now for ATH. Looking for 65 once fomo starts after break out above 60 levels.