$XAU ANTICIPATION Oooooookkkaaaay!!!!!
Mr Gold!!!
Got busted last night!!! found my way 91/100 and here we are!!! 🏦
Tricky here, me personally I think she can do it…… I’m Bullish. I still want to see some play into $4300+
The only way to get that imo is to bounce out $4011 BEFORE $4073 or the high of today!!!!
Max low ends on $3983…
Pay attention to $4066!! She holds weight to the whole idea!
Right now we need to dip out $4011 and the focus should be shifted to a breach on $4025!!! This my friends, is the first class ticket to $4300!
All the best, happy trading and keep watch on $4011-$3983. It’s pay day….
LFG Traders!!!! 💼
Futures market

XAUUSD – Developing (C) Wave Structure Inside Channel
Gold is currently forming a clean Elliott Wave structure inside an ascending channel, and the internal price action suggests we may still be inside a developing Wave (C) before a much larger bearish reversal.
Current Elliott Wave Outlook
The move from the 3,998 low has unfolded as:
Wave (A) – impulsive leg up into the top channel boundary
Wave (B) – corrective decline back to channel support
Wave (C) – still under development, with internal subwaves forming
Inside Wave (C), the chart shows:
(1) completed impulsive wave
(2) corrective pullback into the 0.786 retracement
(3) projected extension toward the upper channel boundary (1.272–1.618 confluence zone)
(4) expected pullback
(5) final push into the top resistance zone of the pattern
This aligns perfectly with the Fibonacci cluster around:
1.13 → 4,112
1.272 → 4,130
1.414 → 4,150
1.618 → 4,154
Bigger Picture
The entire structure appears to be forming a rising wedge / diagonal-like pattern, suggesting that once Wave (5) of (C) completes, a sharp and aggressive bearish reversal is expected. The large red arrow on the chart reflects this expectation.
What to Watch
✔ Price reaching the 4,130–4,155 area (strong fib resistance)
✔ Reaction at the top channel boundary
✔ Momentum divergence on RSI as Wave (5) forms
✔ Breakdown below the lower channel for confirmation of the larger drop
A clean 5-wave completion inside this wedge typically leads to a fast and deep correction.

Gold is in a local correction.Gold is in a local correction.
I will wait for an h1 confirmation to work in the long direction.
The Asian range is 1.56%, so there may be some stagnation until the news.
The short on h1 is quite solid, so long entries must be validated properly — meaning the h1 consolidation should be clean, preferably with an IMB h1, and not compression-based on LTF.
If the price continues to fall, I will wait for a consolidation below the Fractal D1 and work toward the Fractal W1.
But that would be from Monday.
Today is more of an informational day, so it's not worth taking local trades. It’s better to wait for the best setup that fits my plan.
News:
🔴 USD 16:45 — Flash Manufacturing PMI
🔴 USD 16:45 — Flash Services PMI
🟠 USD 17:00 — Revised UoM Consumer Sentiment

lets fly gold!!buy
follow chart .
simple waves .
when everyone holding sells . just BUY
cot data . big buyers stepping in .
ride it

4067 or 4093 drop to 40114067 or 4093 drop to 4011
just a concept to retest 2 red candle zone on 1h TF
Looks like retracing up always depends on 1H candle

buy & sellsee and take target
Hello
According to the classic strategy, in this area we have a delicious sandwich that can help us take advantage of the two positions that are available to us.

XAU/USD: Gold Set to Test Downtrend Line!⏰ Timeframe: 30m
📅 Update: 11/21/2025
🔍 Market Context
After adjusting from the 4,107 USD area, gold is moving sideways in the liquidity rebalancing zone – indicating a tug-of-war between the two sides.
The consecutive CHoCH – BOS movements forming around the 4,006 USD bottom show that buying pressure is starting to reappear.
The current decline seems to be just a correction phase, not yet showing enough signs of a complete reversal of the medium-term uptrend structure.
📊 Technical Structure
Downtrend line: continues to act as dynamic resistance – a confirmation area for the recovery trend if broken.
OB Bullish (4,006 USD): confluence with the previous liquidity bottom, is a potential BUY Zone.
Break–Resistance (4,045 USD): the first level to surpass to confirm buying pressure.
OB Bearish (4,086–4,107 USD): short-term supply zone – short-term SELL Zone, may witness profit-taking reactions if the price touches it.
🎯 Market Outlook
1️⃣ Priority Scenario:
– Price may retest the OB Bullish / BUY Zone (4,006–4,025 USD).
– When a clear upward reaction appears, gold is likely to break through the downtrend line, heading towards OB Bearish (4,086–4,107 USD).
2️⃣ Alternative Scenario:
– If the price does not hold the 4,006 USD area, the short-term structure will be invalidated, opening the possibility of retreating to a lower equilibrium area around 3,985 USD.
💎 Key Zones
BUY Zone: 4,006 – 4,025 USD → demand zone confluence OB + liquidity bottom.
SELL Zone: 4,086 – 4,107 USD → potential supply zone if the recovery trend is activated.
🧠 Analyst’s View
Gold is in a short-term accumulation state with signs of capital flow gradually leaning towards the buyers.
The retest phase of the 4,006 USD support area will be the key confirmation for a reversal – retest – continuation phase.
As long as the price stays above this area, the priority remains a buy-the-dip scenario in the short term.
🛡️ Risk Note
The market is operating in a "break or hold" zone – clear confirmation is needed before following the trend.
Analysis is for technical and educational purposes, not trading advice.

XAUUSD IDEAWhy the Upcoming NFP Matters So Much???
There has been no unemployment report for more than 7 weeks, so the market lacks fresh labor-market data.
When uncertainty is high, NFP surprises have a stronger market impact.
The Fed minutes recently showed concern about inflation → markets now expect less probability of a December rate cut (33%).
Therefore, Friday’s employment numbers may change rate expectations sharply.
Market forecasts
NFP: +50K expected (vs. +22K in August) market expects a modest recovery.
Unemployment rate: 4.3% expected.
Wage growth: 3.7% y/y.
Impact on Gold (XAUUSD)
Weak NFP / rising unemployment / slower wages dovish Fed expectations lower yields bullish for gold.
Strong NFP / lower unemployment / stronger wages hawkish Fed expectations yields rise bearish for gold.
This NFP is therefore a binary catalyst.
Trade Plan (XAUUSD Sell 4052–4055)
Your setup suggests you expect stronger labor data OR hawkish Fed repricing, creating downward pressure on gold.
Entry Zone
Sell zone: 4052–4055
This implies:
Price is approaching resistance
Market may be pricing in too much optimism for gold
You expect rejection near 4055
Take-Profit Levels
TP1: 4025
Short-term support area. Logical frst liquidity zone.
TP2: 3985
A deeper correction level; aligns with a bearish continuation after NFP if the data strengthens the USD and yields.
TP3: 3947
A major downside target.
This suggests:
Expectation of a significant repricing after NFP
Possible return to the bottom of the recent swing range
Would require strong NFP or a hawkish reaction from bond markets
Logic Behind the Sell Setup
Gold is sensitive to Treasury yields and Fed expectations.
Markets currently have high uncertainty → if NFP is strong, the adjustment may be sharp.
Price near 4055 likely corresponds to:
A technical resistance
A potential area where buyers may be exhausted ahead of risk events
Thus, selling into that resistance with multiple targets allows for:
Quick partial profit (TP1)
Medium-term continuation (TP2)
Strong NFP shock scenario (TP3)

short sell finding its way to the market... patience paysxauusd is running a short buy manipulation but the real jackpot comes on a short sell

QuyetP | GOLD: Downtrend Still Intact. 3900 Remains the TargetThe bearish structure on OANDA:XAUUSD remains clean, and nothing in yesterday’s volatility changed the broader picture.
I did get stopped out during the spike, but the key point is this:
the market never broke the bearish narrative.
So after the shakeout, I re-entered fresh short positions at better prices — and the downside roadmap stays the same.
Intermarket backdrop:
- TVC:DXY still firm → limits any sustainable gold upside.
- Yields steady → no macro flow supporting XAU.
- Risk sentiment mixed → no clear safe-haven bid.
Price action continues to show weak buying and strong selling pressure. Every bounce fades quickly, signaling lack of real demand.
Bias stays firmly bearish.
And the destination hasn’t changed:
👉 Target: 3900.
We stay focused on price, not on short-term noise.
Momentum, structure, and intermarket alignment all point in one direction — down.
Check the previous analysis in the link below.

Gold: Bullish scenario if support holdsPrice is reacting inside a 4H support zone.
Although both the 4H and 15m structures remain bearish, the market has shown a fake bullish CHoCH near support earlier and has now produced another bullish CHoCH. With liquidity positioned above the price and key resistance levels at 4072 and 4098, there is a probability of a short-term bullish correction toward these liquidity areas. As long as the 4H support zone holds, I will monitor for continuation of this potential upward move.
support:4033 , 4018
resistance:4072 , 4098

Best spot to go long on OIL / WTINeed I to say more.
Oil has had not one but three attempts to go and break the $56 level which we consider as a base price since some time now for this commodity and it has failed. Then it has has a very decent upwards impulse (which for the time being we will take as an A wave) followed by quite a long and structured correction with a false break out inside as well. At this point, it cannot get better than this to go long from today's low.
First target is the +0.27% of the aforementioned impulse that took the price from $56 of October 20 to $62 of October 24.
Levels on the chart, trade with care. If structured properly this is at least a 1:10 risk to reward operation.
Please follow us for updates.

XAUUSD | Gold Signal | Now 21, 2025 SELL TREND TARGET FOR TODAY 📊
Based on the current trend, structure is strong to bearish. But right now, there’s still a chance for price to make a retracement first.
HAYATE is monitor the structure to see which one is safe whether we BUY first or continue SELL trend.
HAYATE target for this setup we should be able to collect around 100–150 pips++.
♾️Gold sell now @ 4046 - 4050
💰TP1 - 4043
💰TP2 - 4039
🚨SL - 4053

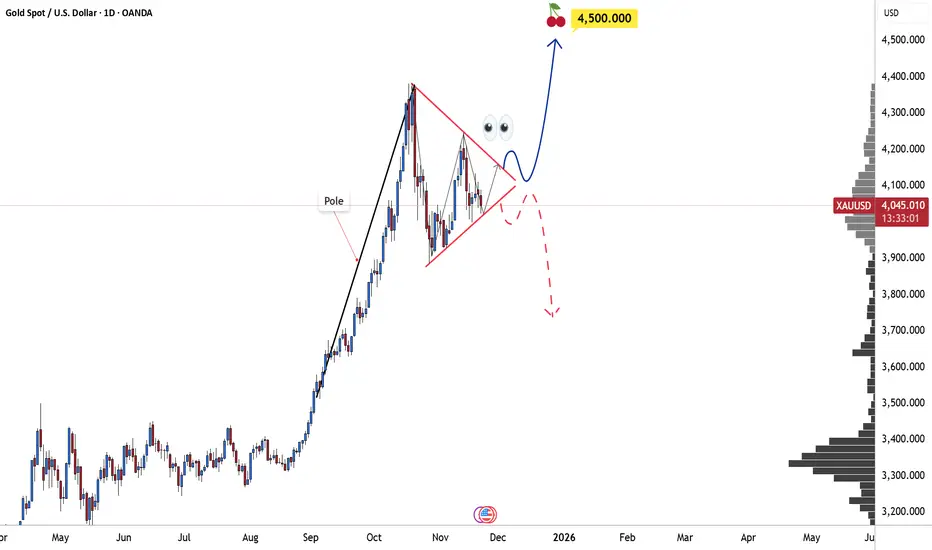
Gold at a Turning Point: Will It Rise or Fall?As we zoom in and take a closer look at how GOLD is moving, one thing becomes immediately clear:
The market has just shown a powerful upward surge, but now something intriguing is happening. The price is compressing, forming a tight, small triangle, a sign that the market is building up energy. In moments like this, there are usually two potential paths, but given the bullish context, I can almost feel that a breakout to the upside is the more likely scenario.
What do you think? Do you agree with me?
Let me know your thoughts in the comments! And trust me, joining the TradingView community is one of the best ways to improve your skills as a trader every single day.
Just a reminder: this isn't financial advice, but rather my personal take on the chart.
Gold at a Critical Level: Will the Channel Hold or BreakXAUUSD Analysis – Key Rejection at Lower Channel Support
Gold has just shown another rebound from the lower boundary of the ascending channel, a level it has respected consistently since October 28. However, yesterday’s strong NFP data increased expectations that the Federal Reserve will not cut rates in December, which strengthens the U.S. dollar and creates potential downside pressure on gold.
If bearish momentum builds, gold could move toward the 4000 zone, completing the current fractal. This would be a dangerous level, as breaking below 4000 would mean losing the bullish channel and could send price back toward the 3950 support area.
Since today is Friday and liquidity tends to be lower, we may also see sideways movement between 4100 and 4020, as the market waits for next week’s catalysts.


XAUUSD: Sell ideaOn XAUUSD as you can see on the chart we have the breakout with force the vwap indicator by sellers so it's mean that we would have a hight probability to have a downtrend.

LiamTrading – XAUUSD H1 | Gold breaks upward trend, short...LiamTrading – XAUUSD H1 | Gold breaks upward trend, short-term decline prevails
Gold has dropped more than $20 in a short time, down over 1% on the day and is approaching the area below 4,030. The previous upward structure has officially been broken, 4040 can no longer hold, today's focus continues to be on selling according to the trend until the support area 4000–398x shows a clear reaction.
Macro Analysis
Gold prices fall simultaneously with weakening expectations of a December rate cut: JPMorgan no longer forecasts the Fed will cut rates in December, unlike the previous scenario of a 25 bps cut.
Some other organizations still believe that rising unemployment and weak economic data may force the Fed to cut rates by 25 bps in the next meeting.
The market is pricing the possibility of a December rate cut at nearly "50–50", creating significant uncertainty and putting short-term pressure on gold, although in the long term it still benefits if the rate cut cycle occurs.
Technical Analysis H1 – Declining structure, price channel, and support area
After breaking 4040, the price creates a series of Lower High – Lower Low, confirming the Dow declining structure on H1.
A falling channel is forming; the upper boundary of the channel coincides with the short-term resistance area 4050–4060.
Area 4000: important psychological bottom. If decisively broken, the medium-term structure may shift to a deeper correction phase.
Buy zone 3987–3989:
Strong support confluence + Fibonacci extension area (1.618/2.272) of the current decline.
Optimal area to watch for a rebound if there is a clear reversal signal.
Main resistance of the day:
4052–4054: retest area of old support + upper boundary of the falling channel → suitable for a sell rebound scenario.
Today's Trading Scenario (LiamTrading)
Scenario 1 – SELL according to the downtrend (priority)
Entry: 4052–4054
SL: 4060
TP: 4030 → 4015 → 3990
Logic: Price rebounds to resistance area + upper boundary of the falling channel, suitable to continue selling according to the trend. Priority when M15 shows rejection candles (pin bar/bearish engulfing) around 405x.
Scenario 2 – BUY at strong support area 398x (catching the rebound)
Entry: 3987–3989
SL: 3980
TP: 3999 → 4014 → 4040 → 4080
Logic: Area 398x is a strong support confluence; only activate when there is a clear price reaction (long lower wick, reversal pattern on M15–H1). This is a counter-trend order, so reduce volume and take partial profits.
Note risks and invalidation
H1 closes above 4060: short-term declining structure weakens, need to pause all sell orders and reassess.
H1 closes below 3980: buy zone fails, risk of further decline to lower areas; at this point, only prioritize selling.
Always keep risk per order at 0.5–1% of the account, reaching about +1R should move SL to breakeven.
Are you leaning towards continuing to sell according to the trend or waiting to catch the bottom at 398x? Leave a comment and follow LiamTrading channel on TradingView for daily XAUUSD updates.

Price consolidate position (Gold expected Target)According to macroeconomic data, there is a 40% chance of rate cuts in December in the meantime, while a 4.4% unemployment rate would slow down the US economy. So gold is expecting a small correction and get reversal upward to till target as posted my ideas.., I am too confident

GOLD consolidation. GOLD has been moving sideways. Could have a BreakOut by next week and continue to rise.

A SELLA sell at 4034-40 sl at 4055, if it fails no trade till Monday and I believe it will sell more

Gold Weakening Inside Triangle – Bears Eye $3,950 SupportGold is currently consolidating inside a symmetrical triangle formation between 3972 support and 4025 resistance showing reduced volatility and awaiting breakout confirmation. The structure suggests indecision but with a slight bearish bias due to repeated lower highs.
Sell Zone: 3995-4020 (near upper triangle resistance and 0.382-0.5 fib region)
Stop Loss: Above 4046
TP1: 3950 TP2: 3915 TP 3: 3885
⚠️ Current bias: Neutral to bearish unless gold breaks and holds above 4025-4046 zone. Weak low near 3886 may attract liquidity if bearish pressure continues.
Note
Please risk management in trading is a Key so use your money accordingly. If you like the idea then please like and boost. Thank you and Good Luck!

Gold Price AnalysisGold maintained a wide range of fluctuations, with bulls and bears locked in a tug-of-war. The daily chart closed with a doji, with the price hovering around the middle Bollinger Band. The RSI indicator is close to the midline, and the 10-day and 7-day moving averages are converging. The Bollinger Bands on the 4-hour and hourly charts are gradually narrowing. Friday's intraday movement is expected to remain within a wide range, continuing to observe the price action within the 4040-4110 range. The trading strategy remains to sell high and low, focusing on short-term trading.
On the 1-hour chart, gold continues its weak and volatile movement. After last night's data release, it attempted to rise but ultimately failed to break through the 4110 level, encountering resistance and falling back. The short-term trend remains weak, with resistance still present above 4110. Intraday, any rebound encountering resistance at 4110 should be used as an opportunity to sell on rallies.
Key Levels:
First Support: 4062, Second Support: 4040, Third Support: 4016
First Resistance: 4100, Second Resistance: 4118, Third Resistance: 4141
Gold Intraday Trading Strategy:
BUY: 4040-4045, SL: 4030, TP: 4060-4070;
SELL: 4105-4110, SL: 4120, TP: 4090-4080;
More Analysis →
