XAUUSD – Channel Break + Liquidity Hunt Analysis🔥 XAUUSD Market Structure Update – Liquidity Grab + Bearish Reversal Setup
Gold is currently trading inside a corrective channel after rejecting the major supply zone. The market has built clear liquidity pools above the recent highs, suggesting a potential liquidity sweep before a bearish continuation.
📌 Key Points in This Setup:
Price pushed into the upper supply zone, creating liquidity right above it.
The rising channel shows weak bullish momentum, indicating a possible reversal.
After liquidity grab, sellers may take control and push price back toward the support area marked below.
Target scenario:
Sweep liquidity → Reject from supply → Bearish impulse → Drop toward support area
🎯 Trading Idea Summary
Bias: Bearish after liquidity sweep
Entry Concept: Wait for a fake-out above liquidity and a strong rejection
Targets: Support zone below
Reasoning: Market is respecting supply zones, liquidity engineering, and channel structure confirming weakness
Futures market

GOLDMost traders use candlestick charts or bar charts (HLOC). Candles show the “open, high, low, close” of each time-block and give a quick sense of price movement & volatility.
Orobel
+2
IG
+2
Long-term charts (monthly or yearly) help you see broad trends; short-term (minutes, hours) show volatility — potential trading opportunities.
Orobel
+1
Because gold is priced in USD, dollar strength affects gold price: when USD weakens, gold tends to rise (and vice versa).

Current Gold Analysis M5 04-12-2025🚀 Option 1: Bullish Breakout Setup
GOLD (XAU/USD) is coiling up! 📈 The price action on the chart is forming a clear ascending structure/bull flag right below a key Resistance Zone at .
I’m watching for a decisive breakout and retest of this level to confirm the next leg up. If buyers step in, we could be targeting and beyond!
Setup: Long on confirmed break above . Risk Note: Always trade with a Stop Loss and manage your risk. Never risk more than you can afford to lose.
#XAUUSD #Gold #Forex #TradingSetup #Bullish #TechnicalAnalysis"
📉 Option 2: Bearish Rejection/Reversal Setup
"Is the Gold rally running out of steam? 📉 XAU/USD is showing signs of exhaustion at the upper Resistance Level around on the chart.
We've seen a clear rejection (bearish engulfing/pin bar) suggesting sellers are stepping in. I’m looking for a move back down to test the major Support Zone near .
Setup: Short on confirmed rejection below . Risk Note: This is a counter-trend move—exercise extreme caution and maintain tight risk management.
#XAUUSD #GoldTrading #Bearish #MarketAnalysis #GoldPrice #ForexSignals"

Buy Limit.Price moved lower during the London Session yday however I think this was caused by responsive sellers.
It is possible there is enough initiative buying activity present to move price upwards however as price did trade relatively comfortably lower in yesterday's session I would like to see a move down to VAL before I take a buy entry.

GOLD SHORTExpecting SHORT on GOLD
Potential ENTRY & TP are on the chart
SL - depends on your risk
GOOD LUCK

GOLD – MARKET OUTLOOK | Watching 4208 for DirectionGOLD – Technical Overview
Gold is approaching the 4187 support level, and a break below this zone would open the way toward the next supports at 4169 and 4151.
From 4151, a bullish rebound is likely as this level represents a strong demand zone.
On the upside, a 1H close above 4208 would shift momentum back to bullish, targeting 4226 → 4233, and a breakout above this area may extend the move toward 4255.
Key Levels
Pivot Line: 4208
Support: 4187 · 4172 · 4151
Resistance: 4226 · 4233 · 4255


XAUUSD – 30M | Bullish Structure Holding Demand | Liquidity TargOANDA:XAUUSD
Price previously consolidated in a wide accumulation range, then broke out into a trending phase. As long as support holds, bulls remain in control and may push toward the final target zone where liquidity is resting above previous highs.
Key Scenarios
✅ Bullish Case 🚀 (Primary Setup)
Hold above 4,200 →
🎯 Target 1 → 4,230
🎯 Target 2 → 4,245
🎯 Final Target → 4,260 – 4,270
❌ Bearish Case 📉 (Invalidation Zone)
If price closes below 4,190–4,180 →
Downside targets → 4,155 → 4,110 → 4,022
Current Levels to Watch
Resistance 🔴 → 4,245 / 4,260
Support 🟢 → 4,200 / 4,155
⚠️ Disclaimer: This analysis is for educational purposes only. Not financial advice

XAUUSD – 1H | Bearish Channel Continuation SetupOANDA:XAUUSD
Gold lost bullish momentum after the rejection at the top resistance and is now following a corrective channel lower. The market is likely seeking liquidity toward the next support zone. As long as price remains below the resistance levels and inside the bearish channel, sellers hold the upper hand.
Key Scenarios
❌ Bearish Case 📉 (Primary Bias)
If price stays below 4,211 – 4,244, continuation downside expected:
🎯 Target 1: 4,130
🎯 Target 2: 4,024
🎯 Final Draw: 3,999 – 3,984
✅ Bullish Case 🚀 (Invalidation)
If price breaks and closes above 4,244.420, bearish setup invalidates and price may attempt a move back toward:
🎯 4,280+
Current Levels to Watch
Resistance 🔴: 4,211.141 • 4,244.420
Support 🟢: 4,130.881 • 4,024.780 • 3,999.332
⚠️ Disclaimer: This analysis is for educational purposes only. Not financial advice.

Gold (XAU/USD) Breakout Setup: Demand Zone Retest and Upside TarOverall Structure
The chart shows Gold Spot (XAU/USD) on the 30-minute timeframe, and it highlights:
A descending channel (blue parallel trendlines).
A support zone (yellow box).
A stop-loss zone (red area).
A long (buy) projection toward a high target point around 4,265.
1. Descending Channel
The price has been moving inside a clearly defined downward-sloping channel.
Currently, the price is:
Testing the upper boundary of the channel.
Showing signs of attempting a breakout.
This suggests momentum may be shifting.
2. Strong Support Zone (Yellow Box)
The highlighted yellow zone around 4177 – 4160 acts as:
A demand zone where buyers previously stepped in.
The chart suggests a potential retest of this area before a bullish push.
The projected price action line (blue sketch) shows:
Dip → retest support → breakout → rally.
3. Stop-Loss Zone (Red Area)
Under the yellow support sits a stop-loss / invalidation zone around:
4160.107 (marked explicitly)
This implies that if price drops below this level, the bullish scenario becomes invalid.
4. Bullish Target
The projected target is drawn high above the current price:
4265.369 – 4265.645
This is a large upward move, suggesting:
A breakout from the channel
A continuation to a new high
The vertical grey rectangle indicates the expected profit zone of the trade.
5. Trade Logic Implied by the Chart
Bullish thesis:
Step 1: Price dips back into 4177 → 4160 zone
Step 2: Buyers defend the zone
Step 3: Breakout above descending channel
Step 4: Rally toward 4265 target
This is a classic pullback-to-support before breakout structure.
Risk:
Break below 4160 invalidates the buy idea.
6. What This Chart Suggests
In summary:
Bullish signals:
A descending channel that often breaks upward after weakening momentum.
Strong demand zone highlighted.
Clear projection showing expected reversal and breakout.
Bearish risk:
If support fails, downside continuation is likely

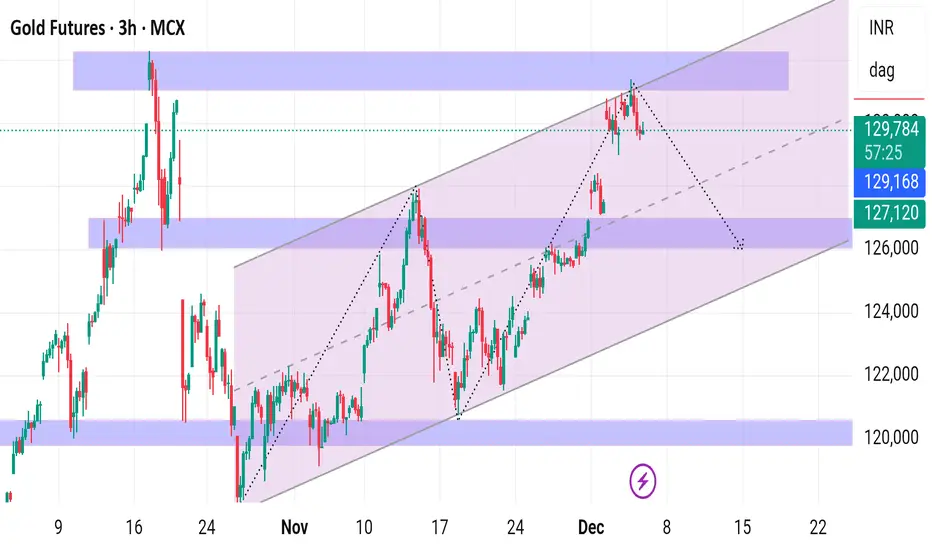
Gold with technical analysis and its key support and resistance Gold with technical analysis and its key support and resistance
Gold is in a rising parallel channel on the 3‑hour chart, currently reacting lower from the upper boundary, so short‑term bias is for a pullback within an overall uptrend.
Key levels to watch are supports near 129,175–127,120 and resistance around 131,200–131,500 and the channel top.
## Trend structure
- Price has been respecting a well‑defined ascending channel since early November, with higher highs and higher lows confirming an uptrend on this timeframe.
- The latest swing has reached the upper band of this channel and shows rejection candles, indicating supply pressure and possible short‑term exhaustion of buyers.
## Support zones
- Immediate intraday support is near the mid‑channel and prior breakout area around 129,100–129,200; a hold here keeps the uptrend structure intact.
- Deeper support sits at 127,100–127,200, aligning with the channel lower boundary and previous demand zone; a sustained break below this area would signal a potential trend change or larger correction towards 125,000 and then 122,000.
## Resistance zones
- The first and most important resistance is the recent high and channel top region near 131,200–131,500, where repeated rejections suggest strong sellers.
- If price can close firmly above this band, the channel’s upper projection opens room for further upside, with next resistance coming from measured channel extension and recent technical levels around 133,000–133,500.
## Trading view
- As long as price stays inside the rising channel and above 127,100–127,200, the primary trend remains bullish and dips into support can be treated as buy‑on‑dip opportunities with tight risk control.
- A breakdown below the lower channel with volume would favor a shift to sell‑on‑rise, targeting the lower horizontal supports mentioned, while any fresh breakout above 131,500 would invalidate the short‑term bearish pullback idea and resume the up‑leg.
Selena | XAUUSD – 4H | Bullish Continuation Setup 4400$ WaitingFOREXCOM:XAUUSD
Gold continues to build bullish structure after forming accumulation in the previous range zone. The market broke out, retested demand, and maintained higher-lows inside the ascending channel. Current pullback into the Entry Zone (4122–4140) aligns with channel support + demand, suggesting potential continuation toward the upper boundary and major resistance around 4380–4410.
Key Scenarios
✅ Bullish Case 🚀
Hold above demand zone + channel support:
🎯 Target 1: 4320
🎯 Target 2: 4380
🎯 Target 3: 4410 (final top channel line)
Trigger: bullish rejection or bullish engulfing from 4122–4140.
❌ Bearish Case 📉 (Invalidation)
Break and 4H close below 4052 (Invalid zone):
🎯 Downside Target: 3990 → 3920 strong support
Current Levels to Watch
Resistance 🔴: 4320 / 4380 / 4410
Support 🟢: 4140 / 4122 (Entry Zone)
Invalidation: 4052
⚠️ Disclaimer: This analysis is for educational purposes only. Not financial advice.

GIFTNIFTY IntraSwing Levels for 04th Dec '25
Macro Cues: RBI commentary hints at steady rates amid inflation (CPI at 5.5% YoY); Putin-Modi summit (Dec 4-5) eyed for defense/energy boosts, but no major announcements yet. Sectoral: IT resilient (+0.5%), banks drag (-0.8%) on rupee pressure.
[ Level Interpretation / description:
L#1: If the candle crossed & stays above the “Buy Gen”, it is treated / considered as Bullish bias.
L#2: Possibility / Probability of REVERSAL near RLB#1 & UBTgt
L#3: If the candle stays above “Sell Gen” but below “Buy Gen”, it is treated / considered as Sidewise. Aggressive Traders can take Long position near “Sell Gen” either retesting or crossed from Below & vice-versa i.e. can take Short position near “Buy Gen” either retesting or crossed downward from Above.
L#4: If the candle crossed & stays below the “Sell Gen”, it is treated / considered a Bearish bias.
L#5: Possibility / Probability of REVERSAL near RLS#1 & USTgt
HZB (Buy side) & HZS (Sell side) => Hurdle Zone,
*** Specialty of “HZB#1, HZB#2 HZS#1 & HZS#2” is Sidewise (behaviour in Nature)
Rest Plotted and Mentioned on Chart
Color code Used:
Green =. Positive bias.
Red =. Negative bias.
RED in Between Green means Trend Finder / Momentum Change
/ CYCLE Change and Vice Versa.
Notice One thing: HOW LEVELS are Working.
Use any Momentum Indicator / Oscillator or as you "USED to" to Take entry.
⚠️ DISCLAIMER:
The information, views, and ideas shared here are purely for educational and informational purposes only. They are not intended as investment advice or a recommendation to buy, sell, or hold any financial instruments. I am not a SEBI-registered financial adviser.
Trading and investing in the stock market involves risk, and you should do your own research and analysis. You are solely responsible for any decisions made based on this research.
"As HARD EARNED MONEY IS YOUR's, So DECISION SHOULD HAVE TO BE YOUR's".
Do comment if Helpful .
Follow notification about periodical View
In depth Analysis will be added later (If time Permits)

WTI Oil - Price Squeeze
Fundamental backdrop
Global supply continues to outpace demand: new data shows world oil output rising sharply while demand growth remains modest, pushing inventories up toward multi-year highs.
Still, recent geopolitical tensions — including strikes on Russian infrastructure — have kept a risk-premium intact, helping crude avoid a steeper slide.
Technical view
West Texas Intermediate (WTI) is trading around US $59–60/barrel, just above a key support zone near $56.00. The chart shows a wedge-like consolidation, suggesting volatility could erupt soon. Meanwhile, Bollinger Bands are narrowing — a typical “squeeze” that often precedes a breakout (in either direction).
Momentum is flat: the relative strength index (RSI) hovers near 50, and price remains below the 50-day moving average — technically neutral, but prone to sudden moves.
If oil breaks up from the wedge and tops the narrowing Bollinger Bands, a rally toward $62–65 is plausible. But with strong oversupply and soft demand, a breakdown below $56 could trigger a deeper slide — possibly into the mid-$50s.

XAUUSD M15 BUYING SETUP Buy Setup Buy Zone: 4190 – 4185 Confirmation: Bullish candle from the demand zone Targets Target 1: 4213 Target 2: 4230 Final Target: 4243 Stop Loss Below 4180 Bias: Short-term Bullish

Balancing Range & The 4190 PivotCOMEX:GC1! COMEX_MINI:MGCG2026 FOREXCOM:XAUUSD
Traders. Update on the current auction structure.
Market Context (No New Money): We have yet to see any "New Money" or Initiative Buying enter the market. Yesterday developed as another Balance Day, capped by some late-session liquidation.
The Reality: The auction remains range-bound between 4,290 (High) and 4,190 (Low). Without a fresh catalyst, price is simply rotating within this established bracket.
Structure & Key Levels:
Bullish Scenario: If Gold can hold acceptance above Yesterday's Low, the rotation favors a re-test of the upper distribution around 4,260 – 4,270 later this week.
Bearish Scenario: The line in the sand is 4,190. A breakdown and acceptance below this level changes the context significantly, likely dragging the auction down to repair the November Balance Area (~4,100).
Plan:
Stance: Neutral / Range Trading.
Execution: Fading the extremes of the 4290-4190 range until we see a breakout with volume confirmation.
Talk to you for the next update.

GOLD BUY TO 4,241 NOW.....GOLD took out the liquidity area and price is heading for a pull back into my inside bar zone fill with demand orders also confirming with falling wedge breakouts and a pull back......

XAUUSD Long: Channel Support Holding — Buyers Target 4,300 ZoneHello, traders! The price auction for XAUUSD has been unfolding within a clearly structured bullish progression after a period of heavy distribution inside the Supply Zone. Earlier, gold established a wide Range between the Supply and Demand areas, with multiple sharp rejections forming the top of the structure. Eventually, sellers pushed the price lower, initiating a corrective decline that developed into a well-defined Triangle Pattern, marked by a descending Triangle Supply Line and a rising Triangle Demand Line. This compression ended with a clean breakout to the upside, signaling the beginning of a new bullish phase. Following the breakout, XAUUSD formed a Pivot Point near the mid-range level, where price briefly rejected before continuing its upward trajectory. Another notable phase was the formation of an inverse Head-and-Shoulders structure, confirming buyer strength after a fake breakout below the neckline. This reversal pattern provided the foundation for the current bullish continuation.
Currently, gold is trading inside a strong Ascending Channel, respecting both channel boundaries with consistent higher highs and higher lows. The latest breakout from the mid-channel zone has kept the bullish structure intact, and after a corrective pullback to the lower channel boundary, price is attempting to resume upward movement. As long as price holds within this channel, the market dynamics favor a continuation toward the 4,300 resistance target, which aligns with the upper boundary of the channel and the previously broken structure.
My scenario for the development of events is bullish, with expectations of a rebound from the lower channel boundary followed by a continuation toward the 4,300 resistance level. In my opinion, maintaining structure within the ascending channel supports further upside as long as buyers defend the 4,110 support region below. Manage your risk!

Report 4/12/25Report summary
Global markets are rotating around a single macro hub: Japan. Super-long JGB yields keep pressing higher as the Bank of Japan signals it will “thoroughly discuss” another rate increase at the Dec. 18–19 meeting; 30-year JGBs hit fresh records and 10-year JGBs are referenced near ~1.9%, while the 10-year U.S. Treasury closed about 4.09% earlier in the week. A BOJ that tightens sooner forces a partial un-wind of yen carry, softens the broad dollar, and supports duration and gold. Into today’s close the WSJ Dollar Index is lower on the week (around 96.4–96.8), U.S. equities are firmer, spot gold is near record territory, and oil stays heavy.
Market reactions
The risk complex leaned risk-on even as rates volatility remained elevated. The S&P 500 and Dow added to recent gains (S&P ~6,829–6,849; Dow ~47,474–47,883), while the WSJ Dollar Index slipped (≈96.39–96.82), reflecting yen and euro strength at the margin. Gold futures settled around $4,215–$4,273/oz, maintaining a powerful up-trend. WTI January futures remain under pressure near the high-$50s per barrel (~$58.6), underscoring the demand/discipline standoff in energy.
Japan remains the global swing factor. Tokyo core CPI is running at 2.8% y/y, and BOJ guidance has pulled forward market expectations for another hike. That has driven super-long JGB yields to multi-decade highs and nudged U.S. 10-year yields back above 4%. The key transmission is via reduced appetite for foreign duration by Japanese lifers/pensions and the prospect of a gradual carry-trade un-wind.
Strategic forecasts (1–3 months)
Baseline. A “firm-but-not-frantic” BOJ path and fading U.S. recession odds keep global growth on a modest expansion track. With BOJ normalization proceeding and the Treasury term premium contained, the dollar’s broad trend tilts lower; risk assets oscillate but avoid a disorderly de-risk. In this base case, S&P 500 makes incremental highs on breadth improvement while gold consolidates above the $4,000 handle as real rates top out. WTI stabilizes in a $55–65 range absent new supply shocks.
Upside scenario. If BOJ proceeds cautiously and U.S. data moderate without cracking, the dollar leg lower extends and equities rerate further; Dow leadership broadens beyond mega-cap tech, and gold grinds higher on central-bank demand and currency diversification flows.
Downside scenario. A quicker BOJ hiking cadence or a liquidity air-pocket in global rates could force a sharper carry un-wind (USDJPY lurches lower), tighten global financial conditions, and hit cyclicals and small caps. Oil would likely weaken first on growth angst before rebounding on OPEC+ discipline headlines; gold would catch a haven bid.
Fiscal and political implications
Japan’s mix of rising local yields and hints of additional policy support limits outbound demand for U.S./EU duration at the margin, a quiet tightening of global financial conditions that the U.S. Treasury must navigate through a heavy auction calendar (e.g., steady bill/coupon issuance shown in the WSJ borrowing schedule). If BOJ normalization persists, Treasury will lean more on domestic real-money and banks to absorb supply, keeping the long end range-bound rather than collapsing.
In Europe, the policy mix is still growth-light and bank-friendly at the margin. The BoE’s decision to relax elements of bank capital requirements into 2027 (as reported this week) and constructive commentary around U.K. banks’ earnings capacity reduce the odds of an aggressive fiscal “tax raid” and bolster loan growth optics, supportive for U.K. financials and London listings into 2026.
Principal risks
Policy error at the BOJ remains the near-term macro swing risk. A step-change in Japanese rates could spark a disorderly carry exit and Treasury-market illiquidity just as U.S. refunding needs stay sizable. Secondary risks include any surprise U.S. data that re-accelerate inflation (re-steepening in real rates), or an energy-market supply disruption that turns WTI’s drift into a spike.
Opportunities
Positioning for a softer dollar while hedging rate volatility is the most robust cross-asset expression. That favors quality global equities funded by a modest underweight to the dollar, selective long duration via the belly if 10-year USTs hold ~4–4.25%, and strategic gold exposure while oil is cheap versus history and OPEC+ optionality. In regional terms, selective Japan financials benefit from a steeper local curve; U.K. banks screen better on regulatory optics and earnings leverage after the shift in capital stance.
Asset-by-asset impacts and levels
XAUUSD (Gold). Momentum remains constructive with futures near $4,215–$4,273/oz as the dollar softens and real yields stall. Base case: consolidation above $4,000 with breakout risk if BOJ tightening coincides with any U.S. growth wobble. Risk: a sharp real-rate back-up would cap gains.
S&P 500. The index holds near highs (~6,829–6,849). A softer dollar/benign real-rate path supports earnings translation for multinationals and risk appetite. Watch breadth, small-cap participation, and any funding-stress spillovers from Japan.
Dow Jones. The Dow trades ~47.5k–47.9k, reflecting cyclical leadership and bank strength. If U.K./U.S. bank policy optics keep improving and rates volatility calms, industrials and financials can extend.
USDJPY. The pair trades around ¥156 per dollar this week, with risk skewed to yen strength if BOJ guidance hardens at the Dec. 18–19 meeting. A measured grind toward ¥150 is plausible on carry normalization; a disorderly dash through ¥150 would imply broader deleveraging.
DXY / WSJ Dollar Index. The WSJ Dollar Index is down on the week (≈96.4–96.8), consistent with firmer yen/euro. Baseline is a gentle drift lower if BOJ tightens and U.S. data cool. Upside dollar risk revives with a U.S. inflation surprise.
Crude Oil (WTI). Front-month WTI sits in the high-$50s (~$58.6). Demand concerns and ample non-OPEC supply keep a lid on rallies, but position-cleaning looks advanced; risk/reward improves on dips toward mid-$50s with OPEC+ supply management as the catalyst.

XAU/USD – Intraday AnalysisXAU/USD – Intraday Analysis: Sideways Structure and High-Probability Trade Levels
Gold continues to move inside a clear range-bound structure, respecting both the upper supply zone and the lower demand zone on the H1 timeframe. The chart shows repeated swing rejections at the top of the range, suggesting that buyers are losing momentum while liquidity continues to build above the equal highs.
The market is forming a harmonic zig-zag pattern with lower-timeframe exhaustion signals, and price remains below the 9-EMA, indicating short-term bearish pressure. Until price breaks out convincingly, intraday traders should continue focusing on trading the edges of the range.
Key Technical Levels
Resistance Zone (Sell Zone)
4235 – 4242
This zone has been tapped multiple times with strong rejection wicks.
Liquidity rests above the equal highs, making this area ideal for short setups if price sweeps liquidity and fails to break structure.
Support Zone (Buy Zone)
4168 – 4175
Strong reaction area where buyers defended the range low multiple times.
Watch for liquidity sweep followed by bullish reversal confirmation.
Technical Confluence
1. Trendline Reaction
Price is respecting the descending internal trendline, suggesting continuation of the bearish leg if 4205–4210 fails to break.
2. Fibonacci Confluence
The upper resistance aligns with 0.786 – 0.886 Fibonacci retracement of the previous downswing.
The lower support aligns with the 1.0 – 1.272 Fibonacci extension of the corrective leg.
3. EMA Structure
Price is trading below the 9-EMA, confirming the short-term bearish bias.
EMA acts as dynamic resistance inside the range.
4. RSI Behavior
RSI repeatedly rejects the 60–70 zone, indicating a weakening bullish attempt.
Neutral RSI at mid-range supports the sideways scenario.
Intraday Trading Strategy
Scenario 1 – Sell the Range High (High Probability)
Plan:
Wait for liquidity sweep above 4235–4242
Look for bearish engulfing or BOS (Break of Structure) on M15
Enter short targeting:
TP1: 4205
TP2: 4188
TP3: 4170 (range bottom)
This aligns with the projected pattern on the chart.
Scenario 2 – Buy the Range Low
Plan:
Wait for price to sweep 4168–4175
Enter only if bullish confirmation shows (pin bar, BOS, or bullish FVG fill)
Targets:
TP1: 4200
TP2: 4220
Scenario 3 – Bearish Breakout
If price rejects the upper zone and breaks below 4170, momentum may accelerate downward.
Targets below 4170:
4150
4135
Market Outlook
Gold continues to consolidate, and this phase typically leads to an explosive move. Until a breakout occurs, trading inside the range edges provides the best risk-to-reward setups.
If you find this analysis helpful, save it and follow for more daily strategies and updated market structure insights.

GOLD LIKELY TANKINGgold selling opportunities emerged. usdjpy on double bottom and most likely to buy, giving gold as a correlation pair to sell further more. but this is not an A+ setup due to lack of 2 or more validations. so lets see how it plays out

Gold's Big Wait: Is $4300 Coming Next?The chart shows that Gold (XAU) has been stuck in an important and sensitive area for some time, currently in a ranging phase.
Consolidation Zone: The price is clearly moving between the support level of 4175 and the key resistance at 4250. This consolidation suggests that the market is gathering energy after previous moves and is compressing the spring for a big move.
Bullish Target: Given this consolidation, there is a high probability that buyers are preparing to break the ceiling at 4250. If this breakout is confirmed, the next price target will likely be the 4300 area.
Important Trading Tip: Smart traders will wait until the price clearly breaks out of this range. Avoid rushing. Wait for the price to stabilize (confirm) above 4250 before entering a Buy position for the 4300 target.
