XAU/USD) Bullish trend analysis Read The captionSMC Trading point update
Technical analysis of XAU/USD (Gold) on the 1-hour timeframe. Here’s a detailed breakdown of the idea:
---
Context & Structure
The market has been in an uptrend, confirmed by a strong impulsive leg upward.
The current pullback retraced into a key demand zone (highlighted blue box), aligning with:
The 0.705 – 0.79 Fibonacci retracement zone, often a high-probability reversal area.
The EMA(50) at 4,092, which provides dynamic support.
---
Key Technical Elements
1. Demand Zone (Blue Box):
Price has tapped into the discount area of the previous bullish move. This area is expected to attract buyers.
2. Fibonacci Confluence:
The retracement aligns with the 70.5–79% zone, suggesting potential exhaustion of the pullback.
3. EMA Support:
EMA(50) and EMA(200) are both trending upward, reinforcing bullish structure continuation.
4. Liquidity Sweep:
The lower wick into the demand zone may represent a liquidity grab before the next bullish leg.
---
Projected Scenario
Expected reaction: bullish rejection from the 0.705–0.79 zone.
Price is anticipated to form a short-term higher low and then continue upward.
Target Point: 4,161.261 — aligns with the prior swing high / equal highs liquidity area.
---
Trade Idea Summary
Bias: Bullish continuation
Entry Zone: 4,100–4,090 area (within blue zone)
Confirmation: Bullish reversal candle or break of minor internal structure upward
Target: 4,161
Invalidation: Clean break below 4,085 (below demand zone and EMAs)
---
please support boost 🚀 this analysis
Futures market

XAUUSD Short: Rejection From Supply Targets $4,070 Demand LineHello traders! Gold (XAUUSD) is showing signs of a potential corrective move after a strong bullish rally from the $3,950–$3,970 Demand Zone, where multiple fake breakouts confirmed the presence of strong buyers. This area coincides with the ascending Demand Line, which has provided consistent support for price growth. Each touch on this line has led to notable bullish impulses, signaling accumulation and strengthening buyer momentum.
Currently, the price approached the $4,140–$4,160 Supply Zone, which aligns with both a Supply Line and the neckline of a previous Double Top pattern. This confluence area represents a critical resistance zone where sellers have historically regained control. The current rejection from this level suggests that a short-term pullback could be underway as the market seeks to retest lower support.
I expect the first key area to watch is the $4,070 pivot level, which aligns with the Demand Line. This zone is expected to act as dynamic support for a potential rebound. If price holds above this level, the bullish structure remains valid, with a possible retest of the $4,150–$4,160 Supply Zone. However, a confirmed break below $4,070 could trigger a deeper correction toward the $3,950 Demand Zone, where fresh buying opportunities may emerge. Manage your risk!

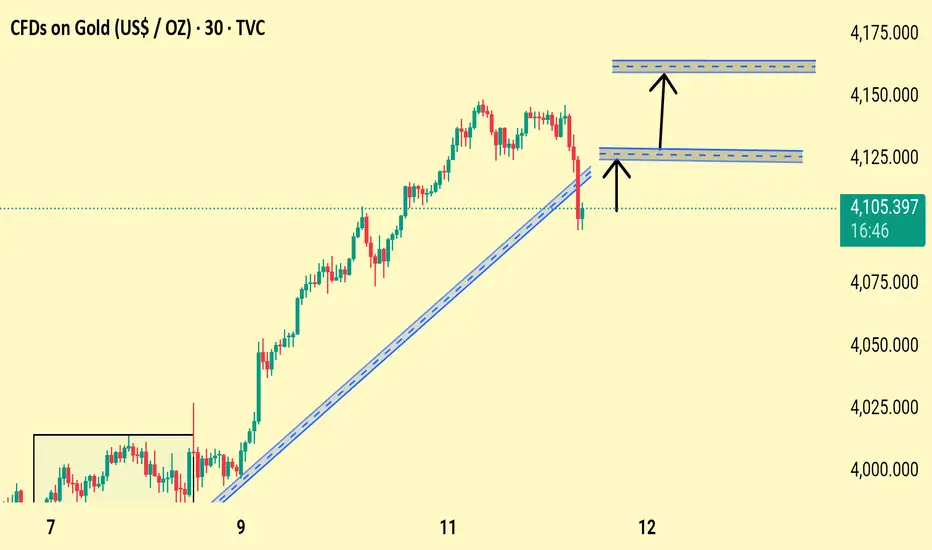
Gold Price Rebound Setup After Trendline Break – Bullish TargetsGold has pulled back sharply after breaking below the ascending trendline, but price is now stabilizing near the 4100 zone. Chart highlights two key bullish reaction levels around 4120 and 4158, where buyers may re-enter. A clean push above 4120 could open the path toward the upper resistance near 4158, signaling continuation of the broader uptrend.
✅ Trend Break but Recovery Attempt
Price broke below the rising trendline, showing short-term weakness. However, buyers quickly reacted, pushing price back above the 4100 level.
✅ Key Levels to Watch
Immediate resistance: 4120
Next bullish target: 4158–4160 zone
✅ Bullish Scenario
If gold holds above 4100–4105, price can retest 4120.
A breakout above 4120 should trigger momentum toward 4158–4160.
✅ Bearish Risk
A drop back below 4100 invalidates the bullish setup and may push price toward 4060.
GOLD 4H CHART ROUTE MAP UPDATE & TRADING PLAN FOR THE WEEKHey Everyone,
Please see our updated 4h chart levels and targets for the coming week.
We are seeing price play between two weighted levels with a gap above at 4042 and a gap below at 3964. We will need to see ema5 cross and lock on either weighted level to determine the next range.
We will see levels tested side by side until one of the weighted levels break and lock to confirm direction for the next range.
We will keep the above in mind when taking buys from dips. Our updated levels and weighted levels will allow us to track the movement down and then catch bounces up.
We will continue to buy dips using our support levels taking 20 to 40 pips. As stated before each of our level structures give 20 to 40 pip bounces, which is enough for a nice entry and exit. If you back test the levels we shared every week for the past 24 months, you can see how effectively they were used to trade with or against short/mid term swings and trends.
The swing range give bigger bounces then our weighted levels that's the difference between weighted levels and swing ranges.
BULLISH TARGET
4042
EMA5 CROSS AND LOCK ABOVE 4042 WILL OPEN THE FOLLOWING BULLISH TARGETS
4147
EMA5 CROSS AND LOCK ABOVE 4147 WILL OPEN THE FOLLOWING BULLISH TARGET
4264
EMA5 CROSS AND LOCK ABOVE 4264 WILL OPEN THE FOLLOWING BULLISH TARGET
4340
EMA5 CROSS AND LOCK ABOVE 4340 WILL OPEN THE FOLLOWING BULLISH TARGET
4422
EMA5 CROSS AND LOCK ABOVE 4422 WILL OPEN THE FOLLOWING BULLISH TARGET
4494
BEARISH TARGETS
3964
EMA5 CROSS AND LOCK BELOW 3964 WILL OPEN THE FOLLOWING BEARISH TARGET
3873
EMA5 CROSS AND LOCK BELOW 3873 WILL OPEN THE SWING RANGE
3741
3632
As always, we will keep you all updated with regular updates throughout the week and how we manage the active ideas and setups. Thank you all for your likes, comments and follows, we really appreciate it!
Mr Gold
GoldViewFX

US CRUDE OIL (WTI): Classic Trend-Following Setup I spotted a very classic bullish model on 📈USOIL.
Following a strong bullish wave, the market started to correct within a bullish flag pattern.
The resistance breakout of this pattern consistently provides a reliable confirmation to consider a buy.
I anticipate a rise to 62.50 at this time.

Gold Price Rebound Setup from Support ZoneGold price is consolidating above the support zone near 4,100 after a pullback from the resistance level around 4,140. A potential bullish rebound could target 4,120 first, with an extended move toward 4,135 if momentum strengthens.

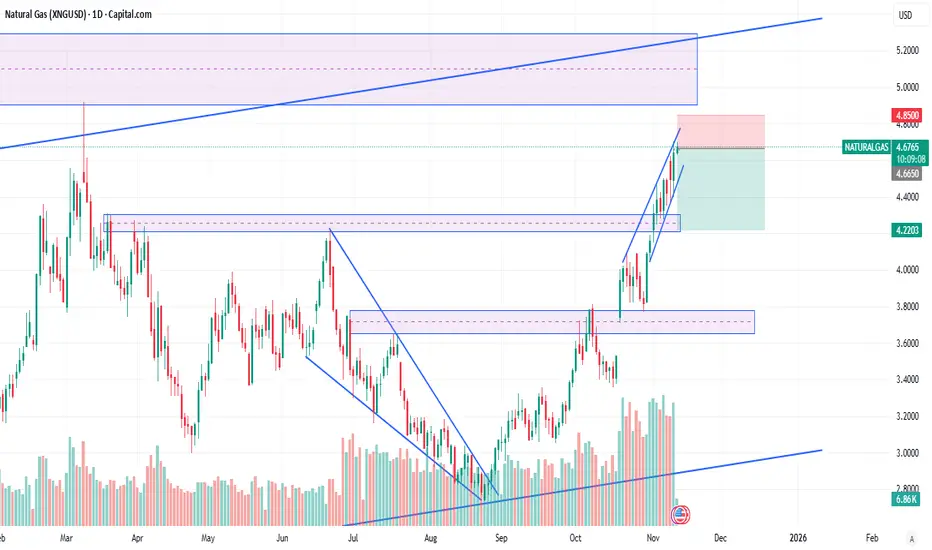
Time for a correction.Natural gas prices have surged by 50% over the past month, even with storage levels at record highs. Increased exports to Europe and recent cold temperatures have contributed to rising prices. For the next two weeks, warmer-than-usual temperatures are anticipated, which may lead to a price correction before the next increase. We still have plenty of time before the true winter season arrives(January-February), and prices cannot continue to rise exponentially indefinitely. This is an early entry to short, I will be looking to short heavily at $5.4
Gold Pullback Expected After Hitting Trend Line ResistanceGold price is testing the upper trend line resistance after a strong bullish rally. A potential pullback toward the 4157 target zone is expected before the next move. Key support levels remain below 4100.

XAUUSDOn the 5-minute chart, the market has formed a bearish swing, suggesting a potential decline toward the 4175 area.

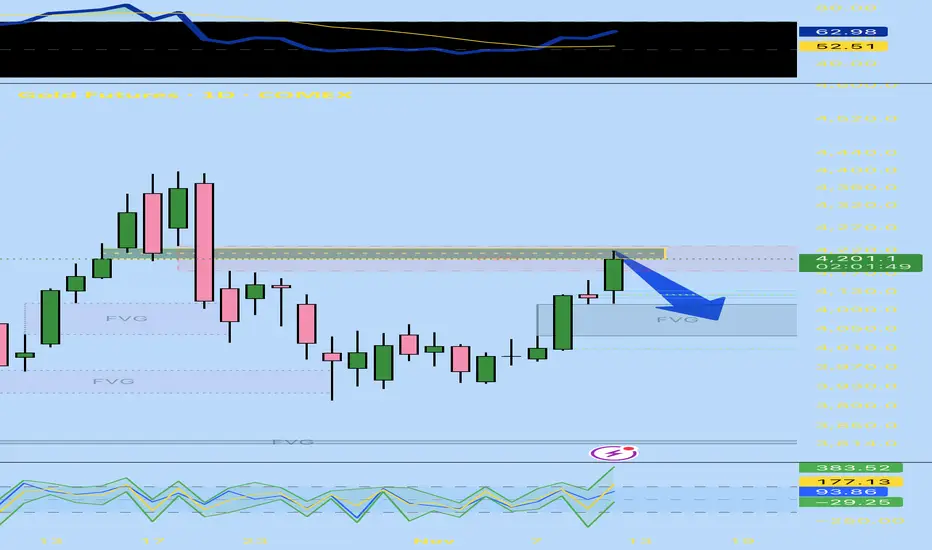
Caught between a Volume Imbalance and 2 FVGsI’m looking at the bullish volume imbalance that is overlapping a bearish fair value gap. Price just made a bullish run leaving a bullish fvg behind. I think we drop out of this fvg and vi and head back down towards the bullish fvg around 4050.
I’m guessing we go back to around 4050 over the next couple days.
GOLDWaiting for price to break out of the potential range between 4095 - 4147.
Looking for a retest of the range @ 4147 to continue bullish long term to 4380.
This is just an idea, please remember to trade according to your plan.

XAU/USD – Bullish Toward 4,200 USDGold continues to respect the boundaries of its rising channel. After rejecting the lower boundary and reclaiming levels above 4,100 USD, price action is showing what looks like an inverse double-top — a bullish reversal structure suggesting further upside.
This pattern aligns perfectly with the broader ascending channel and current market momentum. The breakout above the 4,130 USD neckline adds confirmation, supported by expanding volume and a positive short-term trend (EMA 20 > EMA 50).
The structure points to a continuation toward the 4,200 USD area, which coincides with both the upper channel boundary and Fibonacci extension targets. Immediate resistance sits near 4,160 USD, but the overall bias remains bullish while price holds above 4,100 USD.

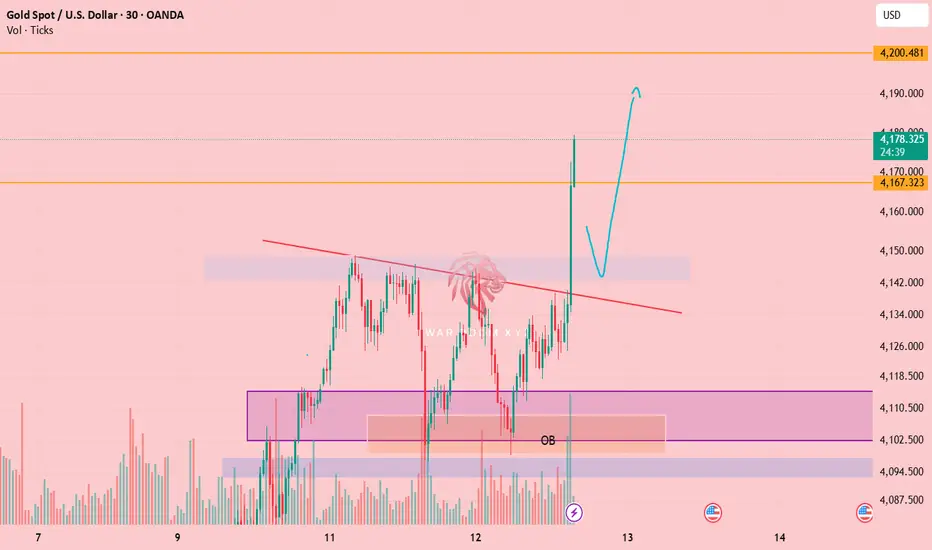
Bullish breakout setupA bullish breakout setup for Gold Spot (XAU/USD) following a clean break above the descending trendline resistance. Price has surged through the prior supply zone, confirming strong buying momentum. The ideal buy area lies between 4,137 – 4,144, aligning with a retest of the broken trendline and structure zone, which could now act as support. A stop-loss below 4,120 protects against a false breakout or liquidity sweep into the previous order block (OB). The target is set at 4,200, which corresponds to a significant resistance and psychological round number. Volume spikes on the breakout support bullish continuation, suggesting buyers are in control. A pullback into the highlighted zone before resuming the upward move would offer the best risk-to-reward entry opportunity.
BULLISHNQ
BIAS: BULLISH
DAILY: Price is currently above the daily -OB MT. Yesterday, price retraced to the 4H + inversion fair value gap and respected this discount array and took off.
PDH & Asian High (equal highs): Has been raided ahead London opening plus the Old High on Thursday Nov. 06, 2025. Then it retraced lower filled the 1H +FVG between 11:00pm and 1:00am
PRE-MARKET: NQ and ES made a LL whereas YM failed to make a LL. There's a cracking correlation here (SMT).
BUYSIDE TARGET: LONDON HIGH @25,830.25 and DAILY -FVG Low end @ 25,881.00

XAUUSD M30 | Key Levels & Smart Zones Today💹 🔥 Trading Idea | Key Levels & Targets 🔥
📊 Market Outlook:
Pair:
Timeframe:
Trend: [UPTREND
Support:
Resistance:
🎯 Targets & Risk:
Target 1:
Target 2:
Stop Loss:
⚡ Quick Analysis:
Price approaching – strong move expected! 🚀
✅ Perfect for
⏱ Wait for confirmation before entering to reduce risk
💡 Pro Trading Tips:
Trade smart with proper position sizing 💰
Always confirm key levels before taking a trade
Keep emotions out – discipline wins! ✅
🙏 Support the Channel:
If this helps you, LIKE 👍, COMMENT 💬 & SHARE 🔄
Your engagement boosts professional ideas to the For You feed! 🌟
🚀 Stay Updated:
Follow for high-quality trading ideas & chart setups!

GOLD SENDS CLEAR BEARISH SIGNALS|SHORT
GOLD SIGNAL
Trade Direction: short
Entry Level: 4,124.58
Target Level: 4,005.98
Stop Loss: 4,203.19
RISK PROFILE
Risk level: medium
Suggested risk: 1%
Timeframe: 9h
Disclosure: I am part of Trade Nation's Influencer program and receive a monthly fee for using their TradingView charts in my analysis.
✅LIKE AND COMMENT MY IDEAS✅

Fundamental analysis of Gold (XAU/USD)GOLD
Here’s a fundamental analysis of Gold (XAU/USD)
1. Interest Rates & Real Yields
One of the biggest drivers of gold is real interest rates (nominal interest rates minus inflation). When real yields are low or negative, gold becomes more attractive since it carries no coupon. In recent weeks, growing expectations that the Federal Reserve will cut interest rates have boosted gold’s appeal. For example, analysts see a high probability of a Fed rate cut in December.
Also, as long-term inflation remains stubborn, the “opportunity cost” of holding gold (rather than interest-earning assets) is lower, which favours gold.
---
2. U.S. Dollar Strength & Currency Effects
Gold is priced in U.S. dollars, so a weaker dollar typically supports higher gold prices (foreign buyers get more gold for their money). Recently the dollar has shown some weakness, which helps gold.
Conversely, if the dollar strengthens sharply (for example because of safe-haven flows into USD or a surprise strong US economy), that could temper gold’s upside.
---
3. Central Bank & Institutional Demand
Central banks around the world continue to buy gold as part of reserve diversification and as a hedge against currency risk. This structural demand supports gold’s medium- and long-term fundamentals.
At the same time, investment flows (via ETFs, etc.) are rising, showing that institutional investors are leaning into gold. This adds to upward pressure.
---
4. Geopolitical & Macro Risk Premium
Gold is still viewed as a “safe-haven” asset. Elevated geopolitical risks, recession fears, or inflation shocks tend to push investors into gold. Reports suggest the current market environment — with elevated macro risks — favours gold’s role as a hedge.
So, if new shocks (trade, geopolitics, monetary policy) emerge, they could accelerate the move upward.
---
5. Supply, Demand & Inflation Dynamics
While gold supply (mining + recycling) is relatively stable, demand from investment and central banks is increasing — tightening the balance somewhat.
Meanwhile inflation remains elevated in many economies, which supports gold’s appeal as a store of value.
---
6. Key Fundamental Takeaways (Bullish Scenario)
If the Fed begins cutting rates, real yields fall → gold rises.
If the dollar weakens further, that boosts gold’s dollar-price.
If central banks amplify gold purchases and investment flows remain strong, that structural demand underpins prices.
If geopolitical or macro risks increase, gold benefits from the safe-haven bid.
Together, these suggest a favourable environment for gold to continue its up-trend.
---
7. Key Risks / What Could Go Wrong
If inflation falls rapidly and the Fed holds firm or even raises rates, real yields may rise → that would pressure gold.
If the dollar strengthens significantly (e.g., due to strong US growth or safe-haven demand), gold could face headwinds.
A sudden improvement in global risk appetite might shift flow away from safe assets like gold.
Supply-side overshoot or substitution into other assets could dampen inflows.

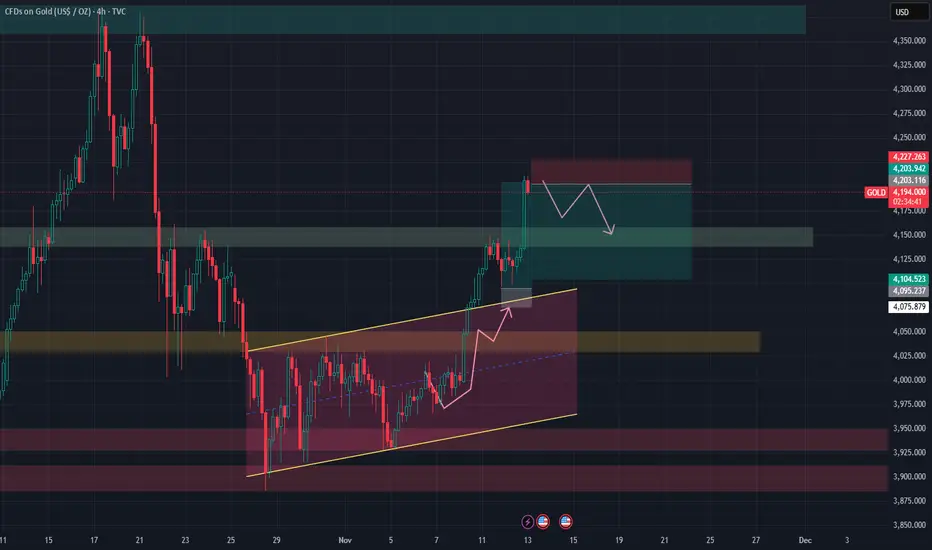
Gold Price Analysis – Consolidation PatternThis chart shows the price movement of Gold (XAU/USD) on an hourly timeframe as of November 12, 2025. The market has formed an upward channel, indicated by the blue lines, showing a consistent bullish trend. However, the price has entered a consolidation phase (marked in green), signaling a potential pause in the upward movement. The market might test lower levels before deciding on the next direction. The chart suggests a possible bearish reversal, as indicated by the downward arrow. Traders should monitor the price action within the consolidation zone for further clues.

XAU/USD – Bulls Face Resistance at Key Supply ZoneGold prices have shown strong bullish momentum in recent sessions, but the rally is now encountering significant resistance near the $4,148 zone. After an extended impulse leg, price appears to be losing steam, signaling the potential for a short-term pullback or correction.
On the 1-hour timeframe, price has tested the upper resistance multiple times without a clear breakout, forming a potential double-top pattern. The latest bearish candle from this area reinforces the presence of sellers and suggests a possible rejection phase before any continuation.
Key Levels to Watch:
Resistance: $4,148 – $4,155 (supply zone / neckline area)
Support: $4,076 (short-term demand zone), $3,995 (major demand zone)
Trading Strategy:
Short-term traders could look for bearish confirmation signals below $4,120 for potential short entries, targeting $4,076 as the first take-profit zone. However, if price breaks and closes above $4,148 with volume, it could invalidate the bearish setup and open the door for a continuation toward new highs.
Outlook:
Neutral-to-bearish in the short term while below $4,148. Watch for price reaction at this level for the next directional move.
Follow for more high-probability gold setups and daily technical insights.

XAUUSD: Bulls Are Ready to Break Out!Gold is showing a powerful comeback as both fundamentals and price action are shifting in favor of the bulls. Global investors are betting that the reopening of the U.S. government and the full release of economic data will pave the way for the Fed to cut interest rates next month. In an environment of economic uncertainty and rising expectations of monetary easing, gold naturally becomes a highly attractive safe haven.
On the chart, the uptrend remains clear as XAUUSD continues to trade steadily within its ascending channel. Recent pullbacks have been purely technical, not signs of a reversal. The nearby support around 4,090 is acting as a crucial launching zone. As long as price stays above this area, the bulls remain firmly in control.
In the short term, the next key target is 4,240, where the market will likely test the true strength of bullish momentum before deciding the next leg.
If you're waiting for a clear trend signal, gold is showing exactly that: the bullish pressure hasn’t stopped—every dip is simply creating another opportunity for buyers to step in.

Day 68 — Clean Entries, No Chasing | +$251 Trading S&P FuturesMade $251.50 today trading S&P Futures — a clean, low-stress day built around precision and patience.
I shorted the 6892 resistance zone early when structure flipped bearish, then sat out most of the chop until we got a confirmed X3 buy signal at 12:30 to go long.
Days like this are all about discipline — no chasing, no forcing, just letting structure and the algo do their job.
VX Algo was on point — 9 out of 10 signals worked for 5+ points.
That’s the kind of day where patience pays.
Tomorrow’s Levels
Above 6850 = bullish, below 6830 = bearish.
Expect a quieter range day unless we get major data or earnings surprises.

Will Gold's Surge Hold Above $4200?Gold surged again after the US market opened, jumping from $4130 to $4206. This was driven by news of a more than 50% expected rate cut by the Federal Reserve. I've consistently emphasized that a rapid surge is inevitably followed by a sharp drop, and we're seizing this opportunity to hopefully reap good profits. This strong rally broke through the resistance zone of $4160-$4180, changing gold's weak and volatile pattern from a bear market to a bull market. This situation makes subsequent trading simpler and provides opportunities that we can better manage. However, I believe this surge will inevitably be followed by a short-term pullback, and it will be difficult to hold above $4200.
I believe gold will continue to challenge the $4300 area this month. More than 20 days have passed since the last surge and pullback, and I think this rise will be more impactful than the previous one because the recent pullback has been solidifying the support level below.
From a technical perspective, this sharp rise has seen all timeframes showing a bullish alignment. The immediate resistance level to watch is around 4200 (the upper Bollinger Band on the 4-hour chart), followed by the Fibonacci retracement level around 4275. These two levels are expected to provide some resistance for the bulls. Support levels have also moved higher with this rise, with the first key level to watch being 4150. This is a previous resistance zone where gold has repeatedly faced downward pressure and is considered a support/resistance level. As long as the price holds above this level, the bullish trend remains intact, with significant support at 4100. Above this level, the bullish outlook remains unchanged. Therefore, we will be placing long orders around this level.
Trading Recommendation: BUY 4150-4160 SELL 4190-4200
I share timely trading strategies and insights on gold daily. If you are currently learning and investing, feel free to connect. As a trader, you need keen market observation and judgment to achieve consistent and stable profits.
