SP500, Bitcoin, Dollar & Euro Daily Trade SetupsIn this update we review the recent price action the SP500, Bitcoin, Dollar Index and the Euro and identify the high-probability trading opportunities and price objectives to target. To review today's video analysis, click here!
Futures market

possible buy on goldprice has been consolidating around 4160 area,, so i am expecting more push to the higher price previously..

Gold looking for longsI think the trendline will be broken , stops will be taken and then gold will start going down.
Let us see what next week is going to bring on.

XAUUSD - Sell Trade Idea - 27.11.2025 Currently the market is consolidating around 4173-4160 zone, making a double top at 4173 and 4171 respectively. At the moment, will try to ''ice'' all the sell side of the market by coming close to the 4173, and then ''ice'' all the buy side of the market thinking that the level 4137 -4143 will serve as a good resistance.
Expecting at 08:00 EST , for the market to move downward. breakiung the 4137 level.

Gold Awaits Breakout as Tight Range Consolidation ContinuesSince yesterday, gold has repeatedly encountered resistance near 4168, with intraday highs reaching around 4173. This sustained narrow-range consolidation is mainly driven by two factors: a need to absorb short-term selling pressure and reduced market activity due to the Thanksgiving holiday, which together have limited price volatility.
From a daily perspective, the bullish structure remains intact, and rate-cut expectations continue to strengthen. Under such conditions, and barring any major unexpected news, the market is likely to see a directional breakout either tomorrow or early next week.
On the technical side, the 4H MACD shows signs of a potential bearish crossover, but the 1H and 2H structures remain constructive. As time progresses, the strength in the shorter timeframes is likely to offset the temporary weakness shown on the 4H chart. In the short term, watch the 4148–4138 support zone, while resistance remains at 4168. Short-term trading can focus on the 4138–4168 range. A breakout to the upside would open targets at 4180–4200, while a downside break would turn attention toward the 4120–4100 support area.
As long as the daily structure remains intact (trend support at 4078–4064), gold still has the potential to reclaim levels above 4300.
Overall, the current short-term volatility is more sentiment-driven and does not indicate a trend reversal. Combining rate-cut expectations, DXY trajectory, and gold’s technical structure, the recent pullback appears to be a healthy correction within an ongoing uptrend.
If upcoming economic data continues to support rate-cut expectations, gold is likely to resume its upward movement after retesting key support areas. However, fluctuations in peace-talk expectations may introduce additional volatility.
Trading Note: If rate-cut expectations continue to build and gold rallies sharply before the rate decision, be cautious of a “sell-the-news” pullback. This would be a normal technical correction, and as long as key support levels hold, the broader bullish trend will remain intact.

Gold on expected upswingTechnical analysis: Gold is showcasing increasing Buying presence on Monthly chart as it is virtually unchanged (the #1M candle at # +2.74% currently) as Price-action is on parabolic uptrend within July’s High’s and October Low’s. This has effectively constructed an series of green candles on Daily chart hence the Neutral values on Hourly 1 chart which was an ideal Buying opportunity for Short-term Traders however Gold is struggling to stage more serious recovery even though we are already Trading above #4,100.80 benchmark comfortably. Personally I remain on Medium-term Buying set-up as Weekly chart (#1W) remains heavily Bullish indicating that the latest consolidation was simply another accumulation and distribution phase of the recently started Bull market. However the Price-action just touched the Weekly chart’s #4,171.80 Resistance and is currently Trading just below it.
My position: After Profiting on multiple Medium-term Buying orders, I have turned now to more Intra-day calls as announced and am Buying Gold literally from #4,138.80 on multiple occasions and will continue to do so, and will Buy Big if #4,130.80 is delivered. I will not Sell Gold and my practical suggestion is to not Sell Gold at all costs.

NQ1! – Bearish Descending Channel, Short Setup Active Nasdaq 100 futures remain trapped inside a bearish descending channel on the 4H chart after failing to reclaim the 25,500 zone.
Key points: Series of lower highs along the blue upper trendline
Strong rejection every time price touches the channel top
Support cluster 25,000–24,800 tested multiple times but showing weakening bounces
RSI slipping toward oversold, but momentum still favors sellers
Bearish plan
Current price rejecting the upper channel again around 25,300–25,320
→ Short entry zone 25,280–25,320
Target 1: 25,000
Target 2: 24,800 (lower channel boundary)
Target 3: 24,500 (channel breakdown target)
Stop-loss above 25,450 (clear invalidation)
Risk/Reward → 1:1.8 average Bullish reversal only on strong break and close above 25,400–25,450 with volume (then first target 25,800). As long as we stay inside this channel, bias is short. Holiday-thinned liquidity can accelerate the move on Friday open.
Short setup live.

XAUUSD – Bullish Ascending Triangle Ready for Breakout After a strong impulsive move from 3,600 to 4,250, Gold is now consolidating inside a clear ascending triangle on the 4H timeframe.
Key observations:
Higher lows are perfectly respected along the rising yellow trendline
Upper resistance (blue descending line) is getting tighter → classic compression
Multiple tests of the 4,000 psychological zone turned it into strong support
Bullish scenario
Break and 4H close above 4,165–4,175 → triggers triangle breakout
Target 1: 4,200
Target 2: 4,250 (recent swing high)
Target 3: 4,300+ (measured move)
Stop-loss below 3,980 (invalidates the triangle)
Risk/Reward → 1:1.8 to 1:3 depending on scaling Bearish invalidation only on decisive break below 4,000 with volume (then target 3,880–3,800). Until then, bias remains firmly bullish. Watching for post-Thanksgiving momentum on Friday.
Long setup active.
#XAUUSD #Gold #Bullish

XAUUSD SHORT IDEA Hello FOREXCOM:XAUUSD
My technical analysis of Spot gold price ,
Midterm price will drop 3950-3750 possible this situation !

Heading into key resistance?Gold (XAU/USD) is rising towards the pivot and could reverse to the 1st support, which acts as an overlap support.
Pivot: 4,221.15
1st Support: 4,027.94
1st Resistance: 4,364.63
Disclaimer:
The opinions given above constitute general market commentary and do not constitute the opinion or advice of IC Markets or any form of personal or investment advice.
Any opinions, news, research, analyses, prices, other information, or links to third-party sites contained on this website are provided on an "as-is" basis, are intended to be informative only, and are not advice, a recommendation, research, a record of our trading prices, an offer of, or solicitation for, a transaction in any financial instrument and thus should not be treated as such. The information provided does not involve any specific investment objectives, financial situation, or needs of any specific person who may receive it. Please be aware that past performance is not a reliable indicator of future performance and/or results. Past performance or forward-looking scenarios based upon the reasonable beliefs of the third-party provider are not a guarantee of future performance. Actual results may differ materially from those anticipated in forward-looking or past performance statements. IC Markets makes no representation or warranty and assumes no liability as to the accuracy or completeness of the information provided, nor any loss arising from any investment based on a recommendation, forecast, or any information supplied by any third party.

Gold 30-Min — Volume Sell Reversal Triggered⚡Base : Hanzo Trading Alpha Algorithm
The algorithm calculates volatility displacement vs liquidity recovery, identifying where probability meets imbalance.
It trades only where precision, volume, and manipulation intersect —only logic.
✈️ Technical Reasons
/ Direction — SHORT / Reversal 4155 Area
☄️Bearish rejection confirmed through sharp candle body.
☄️Lower-high forming beneath resistance supply region.
☄️Volume decreasing confirms exhaustion in price rally.
☄️Sellers regained imbalance with heavy top rejection.
☄️Algorithm detects fading demand and shift to control.
⚙️ Hanzo Alpha Trading Protocol
The Alpha Candle defines the day’s real control zone — the first battle of momentum.
From this origin, the Volume Window reveals where the next precision strike begins.
⚙️ Hanzo Volume Window / Map
Window tracked from 10:30 — mapping true market behavior.
POC alignment exposes institutional bias and breakout potential zones.
⚙️ Hanzo Delta Window / Pulse
Delta window monitors real buying vs. selling power behind each move.
Tracks volume aggression to expose who controls the candle — buyers or sellers.
When Delta aligns with Volume Map, momentum becomes undeniable.

XAUUSD – 4H Chart AnalysisTesting the Upper Boundary of the Descending Channel
XAUUSD continues to move within a medium-term descending channel , and price is now testing the upper boundary of this structure — a level that has repeatedly acted as resistance in recent weeks.
In the short term, the market is forming a narrow rising wedge , a pattern that often appears as a weakening corrective move within broader downtrends. Previous occurrences of this pattern on this chart have also led to pullbacks after touching the channel’s upper boundary.
As long as the channel resistance holds , the first area of interest on the downside is the 3880–3920 support zone, which represents a key structural floor in the current movement.
A break below this zone could open the path toward the midline of the channel and potentially lower levels.
The bullish scenario becomes valid only if price can achieve a clean breakout above the channel , supported by strong momentum and confirmed closes.

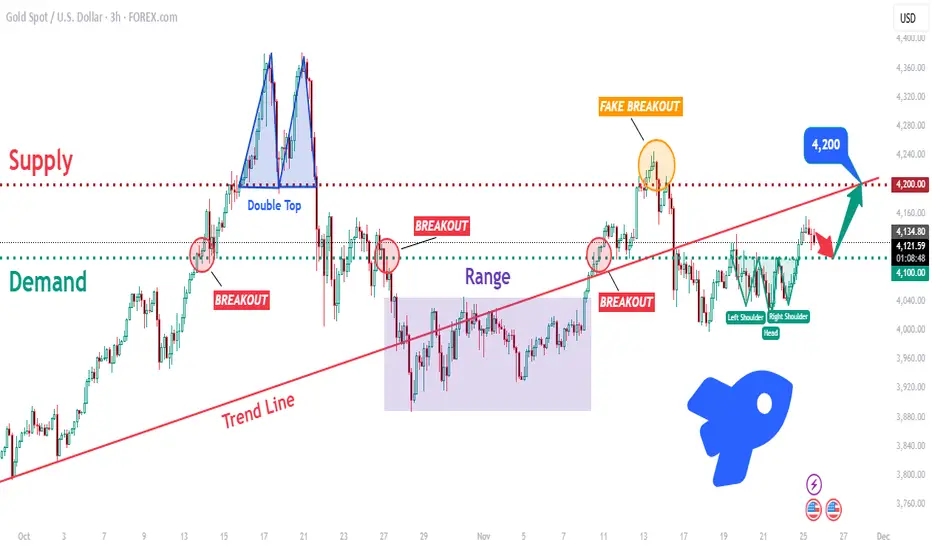
XAUUSD: Bulls Defend 4100! Is a Breakout to 4220 Imminent?Hello traders! XAUUSD continues to trade within a broader bullish structure, but with repeated volatility around key zones. The chart highlights how Gold has reacted multiple times to the major Demand Zone near 4,100, which has consistently acted as a strong support area. Each dip into this zone triggered a bullish response, confirming active buyers. Earlier in the structure, price formed a clear Double Top inside the Supply Zone around 4,220–4,230, which led to a strong bearish reversal and a breakdown below the trend line. After that, Gold entered a prolonged Range Phase, where the market consolidated sideways before breaking out to the upside. Recently, XAUUSD attempted a bullish continuation, but the move resulted in a Fake Breakout above the supply zone, signaling that buyers lacked the strength to maintain momentum above 4,220. This rejection pushed price downward and back below the main Trend Line, which now acts as dynamic resistance.
Currently, Gold is trading above the 4,100 Demand Zone, forming a potential Inverse Head and Shoulders pattern — an early sign that buyers may be preparing for another upward push. As long as price holds above 4,100 and stays above local structure, the bullish scenario remains valid.
My scenario, if XAUUSD holds above the 4,100 Demand Zone, buyers may gain momentum and attempt another breakout toward the 4,200–4,220 Supply Zone, which is the next major resistance and the primary upside target. A sustained break above 4,220 would confirm bullish strength and could open the path toward higher continuation targets. However, if buyers fail to hold the 4,100 level, Gold may drop back into the previous range or retest lower support areas before attempting another reversal. For now, the bias is moderately bullish, supported by demand reactions and reversal patterns — but a confirmed breakout above 4,200 is needed for stronger trend continuation. Manage your risk!
Continue shorting gold around 4160.Continue shorting gold around 4160.
Chart 4h: Macroeconomic triangle pattern.
Today's strategy: Treat this as a consolidation phase.
Key price levels: $4180 - $4110 - $4060
Current strategy:
Sell: $4160
Stop loss: $4185
Take profit: $4130 - $4110 - $4100 - $4060
Resistance: $4180-$4190 is the primary resistance level. A strong break above this level could open up upside potential to $4210 or even $4250.
Support: $4130-$4140 is a support area tested multiple times recently. A break below this level could lead to further declines towards $4110-$4120 and the more crucial support around $4075.
Specific Trading Strategies:
1. Breakout Buy Strategy
Scenario: Gold price rises strongly and breaks through $4190.
Plan: This can be seen as a confirmation signal that the upside potential has opened up; consider a small long position.
Stop Loss: Set below $4170.
Target: Initially target $4210; if momentum is strong, target $4250.
2. Pullback Buy Strategy
Scenario: Gold price fails to break through directly and instead falls back to the $4130-$4140 support zone, showing signs of bottoming out (e.g., a lower shadow on a small-cycle candlestick).
Plan: This is an ideal low-buying opportunity in the volatile market you mentioned.
Stop Loss: Set below $4110.
Target: Target around $4180, and consider partially reducing the position.
3. Breakdown Sell Strategy
Scenario: Gold price breaks below the $4110-$4120 support level.
Plan: This may signal the start of a short-term correction; consider a small short position.
Stop Loss: Set above $4150.
Target: Around $4075.

GoldXAUUSD
- Rising Wedge as an corrective pattern in Long Time Frame
- Change of Characteristics
- Completed " 12345 " Impulsive Waves
- Fibonacci Level - 38.20% / 50.00%
- Consolidation Phase

platinum HI GUYS,
we failed to sell yesterday as there was no sell candle , the market just bullishly moved up .
this is another pair is sometimes less volatile however its quite heavy and has speed on trend.
Currently i expect sells as illustrated

Silver - Parking capital somewhere 'safe'One of the cleaner chart patterns that I can see, which has been playing out for the last 5 years. Over several years the target zone sits at twice the current value.
ETF's like SLV look appealing with general exposure through miners.
Follow the lines.

USD Stunned: Buy Gold at the Adjustment Bottom!1. Fundamentals Quick Take
US Data: Positive (Jobless Claims 216K, lowest in 7 months, Durable Goods +0.5%).
Fed Policy: Extremely Dovish. Fed officials hint at a 25bps rate cut as early as December.
Impact: Low interest rate expectations push DXY down: Strong support for Gold.
2. Technical Outlook - H1
Trend: Strong Uptrend.
Position: Price is below Resistance/Supply (CP Zone - around 4,175 - 4,195). High likelihood of short-term adjustment.
Strategy: Focus on BUY (Long) at strong Demand/Support zones, do not Short based on short-term reactions.
Ideal Long Zone: Around 4,129 or 4,096.
Conclusion: Wait for price to adjust to the Demand zone to enter Long orders following the main trend, based on the USD's decline momentum from Fed signals.
#XAUUSD #Gold #Fed #DXY #TradingView

ANFIBO XAUUSD – Holiday Range or Surprise Breakout? [11.27]Hi guys, Anfibo’s here!
XAUUSD Intraday Trading Plan
Overall Picture
On M30, gold is trading inside a tightening rising structure, with price repeatedly bouncing between local support and descending short-term resistance. Liquidity is thin due to the holiday period, so the market is compressing in a narrow range instead of showing a clear trend.
Key things on the chart:
Upper trendline + horizontal resistance around 4170–4175 is acting as a sell zone.
Local supports are stacked around 4143 – 4136, with a major liquidity pocket / demand zone near 4110 labeled “Strong Liquidity”.
Because of low volume and mixed flows, the safest approach is to trade the edges or wait for a clean breakout of this range.
On the macro side, USD is correcting as markets price in a more dovish Fed path, while Thanksgiving liquidity is thin. According to ING, recent USD moves are more about rate expectations than geopolitics, and the low-liquidity environment can also invite occasional volatility spikes, especially in pairs like USD/JPY. All of this supports a choppy, indecisive environment for gold in the short term.
Trading Plan – Fade the Edges, Respect the Range
We’ll work with two tactical setups:
a sell from resistance and a buy from deep liquidity support.
>>> Scenario #1 – SELL from 4173 Resistance Zone
If price drifts back into the upper boundary and reacts bearishly, I’ll look for short setups:
Sell entry: 4173 – 4175
Stop loss: 4180
Take profit levels:
TP1: 4162
TP2: 4150
TP3: 4122
TP4: 4110 (strong liquidity / demand)
Idea: fade the holiday squeeze into resistance, targeting a move back toward mid-range support and eventually the liquidity zone at 4110 if downside extends.
>>> Scenario #2 – BUY from the Strong Liquidity Zone
If price flushes down into the 4110 area and shows strong rejection, I’ll switch to a buy-the-dip plan:
Buy entry: 4110 – 4112
Stop loss: 4104
Take profit levels:
TP1: 4133
TP2: 4150
TP3: 4172
TP4: 4190 (if market breaks above the current range)
Idea: participate in a liquidity grab at the bottom of the structure, aiming for a bounce back into the core of the range and potentially a breakout if volume returns.
Key Intraday Levels to Watch
Resistance / Sell zone: 4167 – 4175
Mid-range supports: 4143 – 4136
Major liquidity support: 4110 – 4112
A clean break and hold outside this band would signal the next directional move; until then, this is a range market.
Risk Management
Holiday liquidity can be tricky – avoid over-leveraging and keep positions smaller than usual.
Wait for clear rejection or confirmation at planned levels; avoid trading in the noisy middle of the range.
Maintain Risk:Reward ≥ 1:2 for both buy and sell setups.
Do not hold both directions simultaneously; follow the scenario that price confirms first.
If price breaks and holds beyond your SL zone (above 4180 or below 4104), close the idea and reassess instead of forcing re-entries.
Conclusion
Gold is stuck in a narrow holiday range, squeezed between resistance near 4175 and liquidity support around 4110. With USD adjusting to softer Fed expectations and volumes thin, the best edge comes from patiently trading the extremes or standing aside until price finally breaks out.
TRADE THE EDGES, RESPECT THE RANGE, AND LET THE MARKET SHOW ITS HAND, GUYS!

GOLD USDHI GUYS,
we failed to sell on wed however gold did show false sells due to its high volatility.
i expect sells today only if silver confirms entry on candle close.
SO many Traders i know yesterday fell upon trap selling due to false entries, anyway am not a financial advisor am pretty much a consistent trader so anything can happen.
however if u know when to enter then u are less affected by false entries.

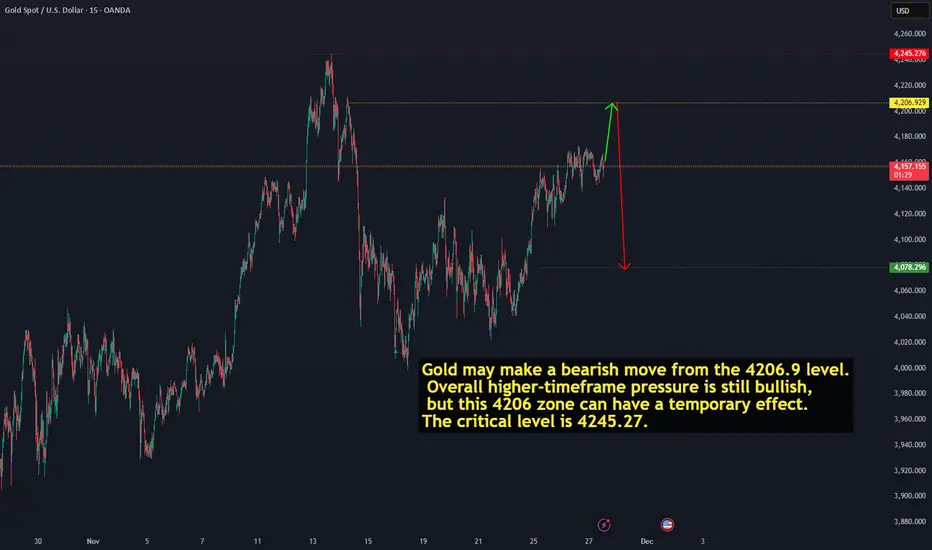
A pullback is possible for gold.Gold may make a bearish move from the 4206.9 level. Overall higher-timeframe pressure is still bullish, but this 4206 zone can have a temporary effect. The critical level is 4245.27.
Daily live trade with XAUUSD in 15m/30m/1h 20251127Daily live trade with XAUUSD in 15m/30m/1h 20251127
