XAUUSD: Market Analysis and Strategy for November 24thGold Technical Analysis:
Daily Resistance: 4145, Support: 4000
4-Hour Resistance: 4110, Support: 4022
1-Hour Resistance: 4085, Support: 4040
The weekly chart closed with a doji, putting pressure on short-term bullish sentiment. The consecutive doji closes on the daily chart suggest a slowdown in the short-term upward trend and exacerbate the expectation of consolidation. The upper Bollinger Band resistance continues to move downwards, and the price will need to focus on the 4040 level (the middle Bollinger Band) during the day. The next key level is 4000; a break below this level would warrant a short-term sell-off. If the price can recover above 4085 in the short term, a continued bullish trend is possible, with the 4140/4150 area as another resistance level to watch. Long-term holders can still look for buying opportunities around 3930/3920;
Looking at the 1-hour chart, gold rebounded after a decline in the European session, with the Bollinger Bands narrowing. The focus in the US session will be on the continuation of this rebound, with resistance levels around 4078 and 4092. The short-term range to watch is 4040-4100;
Trading Strategy:
BUY: 4040near
SELL: 4078~4085
More Analysis →
Futures market

SI - hourly chartT.A explained -
BackSide (BS)
FrontSide (FS)
Inverse BS (Inv.BS)
Inverse FS (Inv.FS)
BS & FS levels are expected support when dashed lines, tested when dotted and resistance when solid lines.
The inverse is true for the Inv. BS Inv. FS levels, they are resistance as dashed lines, tested as dotted and support as solid lines.
Monthly timeframe is color pink
weekly grey
daily is red
4hr is orange
1hr is yellow
15min is blue
5min is green if they are shown.
strength favors the higher timeframe.
2x dotted levels are origin levels where trends have or will originate. When trends break, price will target the origin of the trend. its math, when the trend breaks, the vertex breaks too so the higher timeframe level/trend that breaks, the more volatility there could be as strength in the orders flow in to fuel the move.

Gold Price Analysis: A Battle of Interest Rate Cut Expectations,Gold Price Analysis: A Battle of Interest Rate Cut Expectations, Volatility Remains the Main Theme
🎯 Key Event: Fed's "Tailor" Signals Market Stabilization
A key figure at the Federal Reserve—New York Fed President Williams—released a clear dovish signal, stating that interest rates are "very likely to be adjusted further." This move was interpreted by the market as a near-certainty of a December rate cut, instantly boosting market expectations to 73% 📈. Although internal hawks (such as Collins and Logan) still have objections, the leadership's inclination is quite clear.
Conflicting non-farm payroll data (more jobs than expected, but the unemployment rate rose to a four-year high of 4.4%) further complicated the decision-making situation.
🔥 Market Reaction: Gold "Wins," Stocks Recover
Williams' words were like "timely rain," successfully rescuing market sentiment:
Stock Market: Non-tech sectors collectively strengthened, and the market reversed its decline.
Gold: Year-to-date gains have reached 50%, with gold stocks soaring 125%! Central bank gold purchases and expectations of interest rate cuts form the core logic behind its upward trend 💎.
📉 Technical Analysis: A period of consolidation is expected; buy low and sell high.
Chart: The 4-hour chart shows a slightly bearish consolidation pattern, with bulls and bears repeatedly battling within a range.
Strategy:
Main Strategy - Short Selling: Patiently sell short on rallies to the 4090-4110 area. Consider shorting around 4080. 🎯
Secondary Strategy - Long Selling: Only cautiously monitor short-term support opportunities in the 4000-3990 area.
Remember: It's better to observe than to chase highs or lows in the middle of the range! ⚠️
💎 Summary and Outlook
The overall outlook for gold remains positive due to central bank support and expectations of interest rate cuts, but in the short term, it will continue to be influenced by Fed statements and economic data. Traders need to remain patient, strictly adhere to key resistance and support levels, and seek high-probability opportunities within the consolidation.

THE KOG REPORTTHE KOG REPORT:
In last week’s KOG Report we gave the potential path as well as the red box defence to look for any reaction in price. We managed to support the lower red box defence giving us a nice long to start the week then resulting in the higher defence holding and giving us an extremely decent short. It was only during the later part of the week we faced some choppy and whipsawing ranging which we decided wasn’t worth committing too much into, so we returned to scalping the red boxes only for the remainder of the week.
A decent week in Camelot, not only on Gold but the numerous other pairs we trade and analyse.
So, what can we expect in the week ahead?
It’s likely to be another week of choppy price action and potential for a range to develop even smaller than we’ve seen in previous sessions. We have the key level of support below again at 4040 while resistance above sits at key level of 4104. Economic news on Tuesday should bring volume and we would expect one of these levels to break open and the range to have accumulated enough to then move us into a clear direction.
We have added the red box defence up and down, ideally wanting a test of that low, so price going up on the open could represent opportunities to attempt the short unless defence is breached. Otherwise, we’ll look to take this into that 4000-3980 levels before we look for any RIPs.
RED BOXES:
Break below 4060 for 4055, 4050, 4041, 4033 and 4010 in extension of the move
Break above 4081 for 4095, 4103, 4120 and 4130 in extension of the move
Please do support us by hitting the like button, leaving a comment, and giving us a follow. We’ve been doing this for a long time now providing traders with in-depth free analysis on Gold, so your likes and comments are very much appreciated.
As always, trade safe.
KOG

How to trade in a range-bound market?Gold remains in a wide-range trading pattern, with the daily chart closing with another doji candlestick. This pattern suggests continued range-bound trading. Today's strategy is to buy low and sell high, as there is still room and demand for further declines. The key resistance level to watch today is around $4098; sell on rallies near this level.
Gold maintains its wide-range trading structure. The daily/weekly charts show a tug-of-war between bulls and bears, with moving averages converging and the price hovering around the middle Bollinger Band. Gold will soon face a directional decision. From a technical perspective, after rebounding to the $4110 high and encountering resistance, gold has fallen again in a stepped pattern, and this area remains a significant resistance zone.
Key Levels:
First Support: 4040, Second Support: 4023, Third Support: 4004
First Resistance: 4090, Second Resistance: 4108, Third Resistance: 4130
Gold Intraday Trading Strategy:
BUY: 4026-4031, SL: 4010, TP: 4050-4060;
SELL: 4095-4100, SL: 4115, TP: 4080-4070;
More Analysis →
TIME TO FLY
Time to fly and if you have courage it's best to hold it because this could be the beginning of a higher high on weekly but it had to clear many people out before the real move,
least place for a close should be at 4115-20 but if you want more cash and brave as well then hold it

NQ Week 48 T.A explained -
BackSide (BS)
FrontSide (FS)
Inverse BS (Inv.BS)
Inverse FS (Inv.FS)
BS & FS levels are expected support when dashed lines, tested when dotted and resistance when solid lines.
The inverse is true for the Inv. BS Inv. FS levels, they are resistance as dashed lines, tested as dotted and support as solid lines.
Monthly timeframe is color pink
weekly grey
daily is red
4hr is orange
1hr is yellow
15min is blue
5min is green if they are shown.
strength favors the higher timeframe.
2x dotted levels are origin levels where trends have or will originate. When trends break, price will target the origin of the trend. its math, when the trend breaks, the vertex breaks too so the higher timeframe level/trend that breaks, the more volatility there could be as strength in the orders flow in to fuel the move.


XAUUSD | Gold Awaits Catalyst from US DataGold bounced off the 4043 support zone, indicating moderate gains as the market awaits a week of heavy US economic data, combined with ongoing geopolitical tensions.
The probability of a Fed rate cut in December has risen to 74%, providing partial support for the precious metal.
Signs of a de-escalation in the Russia-Ukraine conflict could trigger a correction, while strong US data could dampen expectations of policy easing.
Gold fluctuated between 4030 and 4113 as the market awaited key US data this week.
➡️ Below 4087 → bearish towards 4059 and 4043
Potential retest towards 4099–4113
➡️ Above 4087 (15m) → bullish towards 4099 and then 4113

Seize the opportunity to short sell at high levels.Technically, gold closed last week in a range-bound manner, and short positions once again yielded good profits. Shorting in the 4080-4100 range, focusing on selling at higher levels, offered considerable profit potential. Given the overall bearish structure on the 4-hour chart, the strategy of buying low and selling high within the lower range, relying on strong resistance and support (primarily shorting), was also favorable for those who went long. However, given the overall bearish trend, going long against the trend is generally cautious and should be avoided, especially chasing rallies in the middle. There's not much to say technically; the overall strategy remains to patiently sell on rallies. Intraday, if there's another rebound, shorting in batches within the 4080-4100 range can be considered.

Time frame 1H,#XAUUSDIf 4080 is broken, buy with a stop of 4060. If 4060 is broken, sell with a stop of 4080. However, considering the trading volume and the updated channel, the probability of success of a buy position is higher than a sell position.

goldawaitbreakout#XAUUSD we await price for breakout above the 4077 to buy, above 4087-89 holds confirmation on buy once M15-H1 close above.
Buy limit 4077, target 4095-4109, SL 4065.
Below 4063 holds strong bearish continuation which will target 4031.

NAT-GAS | Approaching Resistance After Geopolitical ShockNatural gas has surged sharply in recent sessions, partly reflecting renewed geopolitical tension after the latest developments in Ukraine. Markets tend to price in supply-risk premiums quickly, especially when the backdrop involves infrastructure vulnerability and winter demand approaching. This rally has now carried price directly into a major resistance zone around 4.75–5.00.
Technical Lens:
The chart shows a clean breakout from the multi-month descending structure, followed by an impulsive leg upward with very shallow pullbacks. Price is now pressing into a clear supply area that previously capped rallies. How it behaves here will likely define the next swing.
Scenarios:
• If the resistance zone holds:
Price may stall as early longs take profit and volatility compresses. This region acted as a distribution area earlier in the year, and the recent rally has travelled a long way without a meaningful pause. A cooling-off phase would make sense if geopolitical volatility eases or if weather forecasts soften demand expectations.
• If the zone breaks:
A decisive push through 5.00 would suggest the market is repricing the risk environment more aggressively. Concerns about Ukrainian infrastructure, higher LNG import dependence, or colder-than-expected winter conditions could support continuation. In that case, the same zone could turn into support on any retest.
Catalysts:
Short-term drivers include updates on Ukrainian supply risks, European storage commentary, and upcoming weather models. Any shift in these inputs could determine whether resistance holds or gives way.
Takeaway:
The 4.75–5.00 zone is the key decision point. The market either cools off here after a stretched run, or it confirms a more structural shift in sentiment by breaking above it.

Gold close entries...For now I'm not longer interested in buying gold, so I will close at current area...
I will wait for gold to give me direction.

BTC Update: The Rollercoaster EditionAttention all chart warriors, candlestick whisperers, and Fibonacci fanatics!
If you're reading this trade plan, congratulations — you've officially entered the realm of market prophecy
🚀 BTC Update: The Rollercoaster Edition 🎢
What’s New?
Bitcoin is chilling around $86K, like that friend who says “I’m fine” after a breakup but keeps posting cryptic stories.
Upper Trendline:
Sitting pretty near $90,774 – that’s the “VIP section” where bulls want to party. Break above it, and we’re talking $97K–$104K dreams.
Lower Trendline (Breakout Zone):
Guarded at $85,500. If BTC slips below this, next stop could be $80K – aka the “budget seats.”
Price Action:
Currently stuck in a descending channel, but RSI is whispering, “Hey, maybe we’re oversold.” MACD is like that friend who says, “I think things are turning around.”
Target:
If BTC breaks the upper trendline, $97K–$104K is the next dance floor. If not… well, let’s just say $80K might be the couch we crash on.
Fun Fact:
Bitcoin’s November mood? Extreme Fear. Basically, the market is acting like someone saw a spider in the bathroom.
Good luck, everyone! And hey, don’t forget to smash that like button and drop your wildest market predictions in the comments! ❤️
Disclaimer: My trading strategy isn’t a signal—it’s more like a workout for my brain. I’m just here flexing my market structure knowledge and sharpening my trading skills while building my trade journal. Think of it as financial gym time—no personal trainers, just candlesticks!

XAUUSD 1Hr OutlookThis is the one hour onlook on xauusd based on my detailed analysis
DISCLAIMER: This is intended for educational purposes only and not to be used as financial advice

There are some setups for trades todayThis is Monday the 24th and I went through a number of markets including oil which I think is going higher and they went to some many contracts for traders who need less risk even though there's a little bit less reward.

XAUUSD Tapped 4080 Twice!!The price tapped 4080 twice now, We expect another impulsive move down to 4050 which is our Support! Lets catch this drop.

CRUDE OIlDO YOU KNOW WHATS BEHIND THIS OR OTHER IDEAS?? in bio..
Preferably suitable for scalping and accurate as long as you watch carefully the price action with the drawn areas.
With your likes and comments, you give me enough energy to provide the best analysis on an ongoing basis.
And if you needed any analysis that was not on the page, you can ask me with a comment or a personal message.
Enjoy Trading ;)

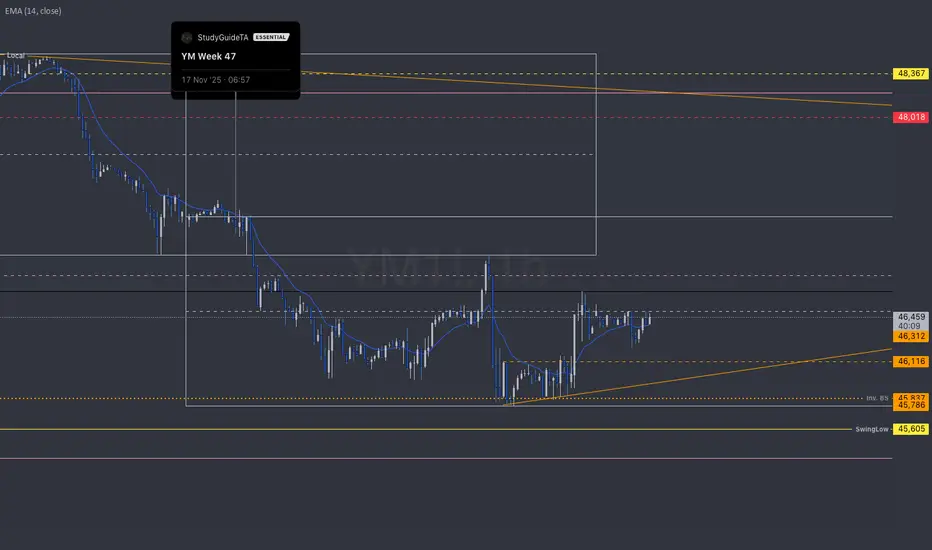
YM Week 48 (1hr chart)T.A explained -
BackSide (BS)
FrontSide (FS)
Inverse BS (Inv.BS)
Inverse FS (Inv.FS)
BS & FS levels are expected support when dashed lines, tested when dotted and resistance when solid lines.
The inverse is true for the Inv. BS Inv. FS levels, they are resistance as dashed lines, tested as dotted and support as solid lines.
Monthly timeframe is color pink
weekly grey
daily is red
4hr is orange
1hr is yellow
15min is blue
5min is green if they are shown.
strength favors the higher timeframe.
2x dotted levels are origin levels where trends have or will originate. When trends break, price will target the origin of the trend. its math, when the trend breaks, the vertex breaks too so the higher timeframe level/trend that breaks, the more volatility there could be as strength in the orders flow in to fuel the move.
XAU/USD: Short at Range Resistance 11/22
Based on your chart analysis and the request to fill out a detailed trade idea for XAU/USD, here is the structured analysis following the principles of Volume Profile and multi-timeframe confirmation.
Publish Idea
Clear Title: XAU/USD: Short at Range Resistance (Testing the $4085 Selling Zone)
Analysis and Prediction
This analysis uses the 5-minute chart to identify a short-term trading opportunity within the context of a larger Neutral/Consolidation pattern (the Symmetrical Triangle visible on the 4H chart).
1. Structural Context (M5/D-Shape): The price is currently contained within a broad consolidation area, characterized by a D-Shape Volume Profile. The large cluster of volume around 4070 - 4085 represents the current fair value. We are positioned near the Value Area High (VAH) of this distribution.
2. Resistance Confirmation: The black line and the Red Box 1 (approx. 4085.00) represent a high-volume resistance zone that has already been tested once (marked "2" on your chart). The previous sharp rejection confirms that sellers are actively defending this level. The current rally is the second retest of this critical ceiling.
3. Bias and Rationale (Mean Reversion): Given the overall neutral/range-bound structure and the repeated rejection at 4085, the highest probability trade is a Mean Reversion Short. We expect the price to revert from the resistance ceiling back down towards the center (POC) and the bottom of the range (support).
4. User Sentiment Integration: Your sentiment notes ("1. sell more than buy" and "2. down trend") align with fading the high price in this zone, expecting the bearish pressure from the larger triangle structure to prevail.

GOLDDO YOU KNOW WHATS BEHIND THIS OR OTHER IDEAS?? in bio..
Preferably suitable for scalping and accurate as long as you watch carefully the price action with the drawn areas.
With your likes and comments, you give me enough energy to provide the best analysis on an ongoing basis.
And if you needed any analysis that was not on the page, you can ask me with a comment or a personal message.
Enjoy Trading ;)

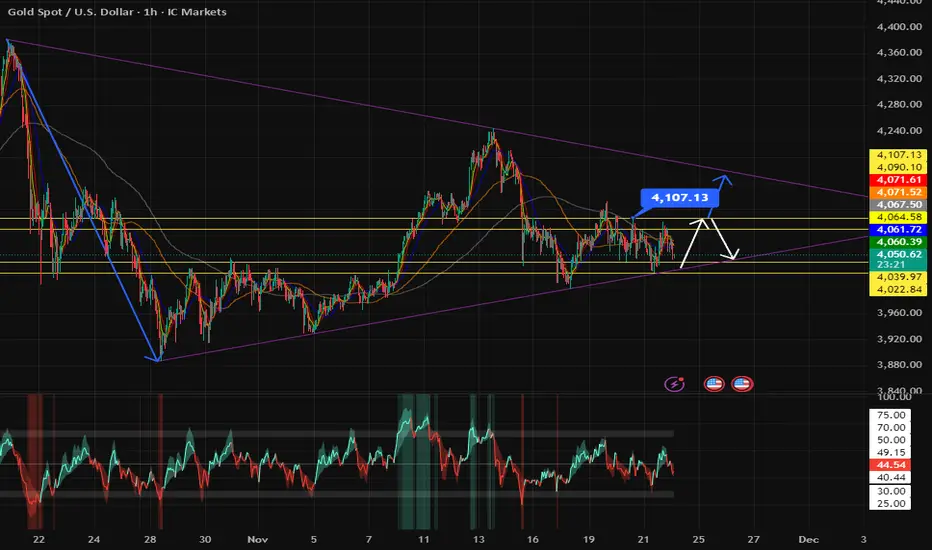
MGC LongsPrice is forming a rounded double-bottom structure right on the rising trendline (blue), suggesting buyers are quietly stepping back in after multiple rejections from the lower demand zone (4,050–4,060).
We’re currently pushing into a key mid-range resistance at 4,085–4,095. This level has acted as a heavy decision zone for several sessions, so I’m watching for one of two things:
Primary Bias (Bullish)
A controlled pullback into the 4,060–4,065 demand zone
Buyers hold structure above the trendline and EMAs
Break and hold above 4,090
Then continuation toward 4,110 → 4,130 liquidity pockets
The white projection illustrates the ideal retest-and-continue scenario.
Key Notes
EMAs are beginning to curl up and tighten — early sign of momentum shift
Liquidity sits above 4,105–4,115 from prior wicks
Clean invalidation below the trendline / demand at 4,050
Overall, this is a reversal-structure forming at higher-timeframe support, with a potential push into the next major supply zone if intraday demand continues to hold.
