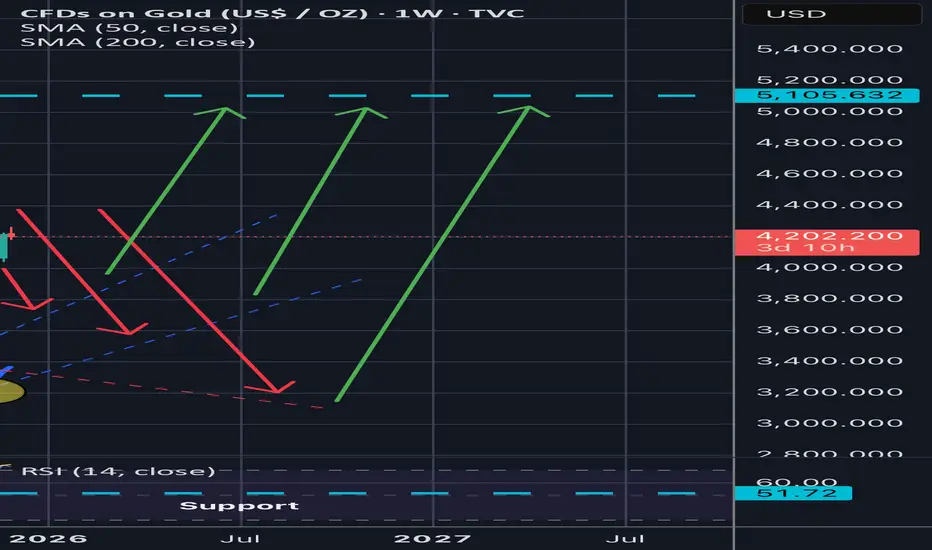
The downtrend in gold has become apparent.
news:
December 1st in the US marks the official end of the Federal Reserve's quantitative easing (QT) policy (confirmed at the October 29th meeting). This means:
1️⃣ The end of QT = a systemic halt to liquidity injection, shifting the financial market from a "liquidity contraction mode" to a "stability mode."
2️⃣ Marginal easing of US Treasury supply pressure, reduced risk of rising long-term interest rates, and a potential for the yield curve to flatten again.
3️⃣ The rapid decline in bank reserves has ceased, significantly easing liquidity tensions in the overnight financing and repurchase markets.
4️⃣ The "liquidity discount" in risk asset pricing has begun to diminish, which is conducive to the valuation recovery of such assets.
5️⃣ The cessation of QT does not equate to the resumption of QE, but rather a significant turning point signaling the end of the tightening cycle.
6️⃣ The core of market competition will shift from the "intensity of balance sheet reduction" to "when to cut interest rates and whether to restart balance sheet expansion."
7️⃣ The macroeconomic narrative has shifted from "passively deflating bubbles" to "actively stabilizing the market," confirming the policy bottom.
Technical aspects:
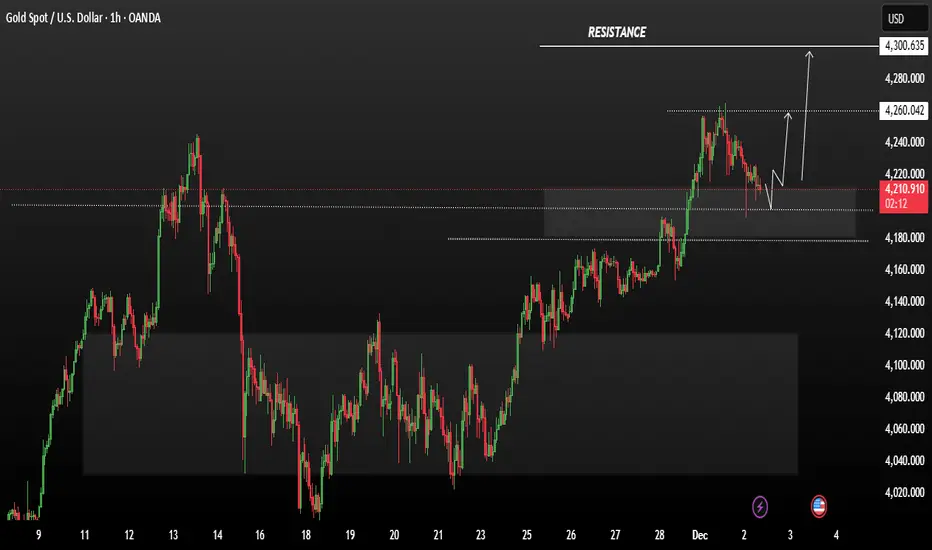
Looking at the 1-hour chart,Gold prices consolidated slightly before declining, accelerating their fall after breaking below the previous night's low of 4220. They reached a low near 4180 before rebounding and consolidating. With the price breaking yesterday's low, the downtrend is likely to continue. Short-term resistance is around 4220, while support lies at the 5-day moving average on the daily chart at 4175, which also represents the retracement level of the 4152-4265 upward move.
Strategy Signals:
Buy: 4215-4220 Stop Loss: 4230 Target: 4190-4170
Futures market

NiftyNifty levels are based on volume profile
1. Gapup 26250 long
2. 26250-26180 trade breakout
3. Gapdown 26180 short

XAG/USD Long Position OpportunityBased on the daily technical analysis of XAG/USD, the overall trend remains bullish. Price is holding above the key support zone of $56–$56.5, which indicates strength for long positions. If this support sustains, the next upside target is expected in the $58–$60 resistance zone.
A temporary pullback is possible due to overbought conditions, but the broader trend continues to favor long trades.
Please let me know if you require a detailed entry and risk management plan.

GOLD Consolidation bullish run momenmtumGold moved into consolidation after a bullish run. The metal pulled back to $4110/oz on Tuesday as investors booked profits following Monday’s six-week high. The market is now focused on U.S. interest rate expectations, with growing anticipation of a rate cut next week. Traders are also awaiting remarks from Federal Reserve Chair Jerome Powell later today for additional guidance on the Fed’s rate trajectory.
Price retested the 4205 zone and rebounded, indicating a healthy pullback within the uptrend If bulls successfully hold the 4210 support range, upward momentum could strengthen quickly On the upside, the next major resistance levels to watch are 4260 and 4300.
You may find more details in the chart.
Trade wisely best of luck buddies.
Ps; Support with like and comments for better analysis thanks for supporting.
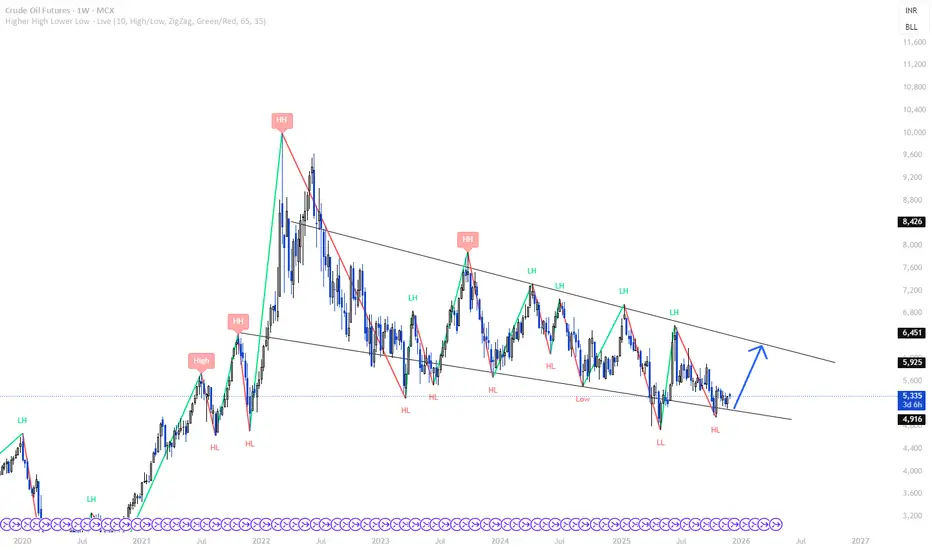
OIL looking at buy zone in weekly levels oil at yearly low and looking at very good buy opportunity as a swing trade
Nifty Positional Target 27000 then 29000 Target Nifty Looks strong from current Levels .
Last 1 Year movement just like sideways .
by December 2026 Nifty can give good return at least 15% return expected .
No stoploss only trade with Hedge .

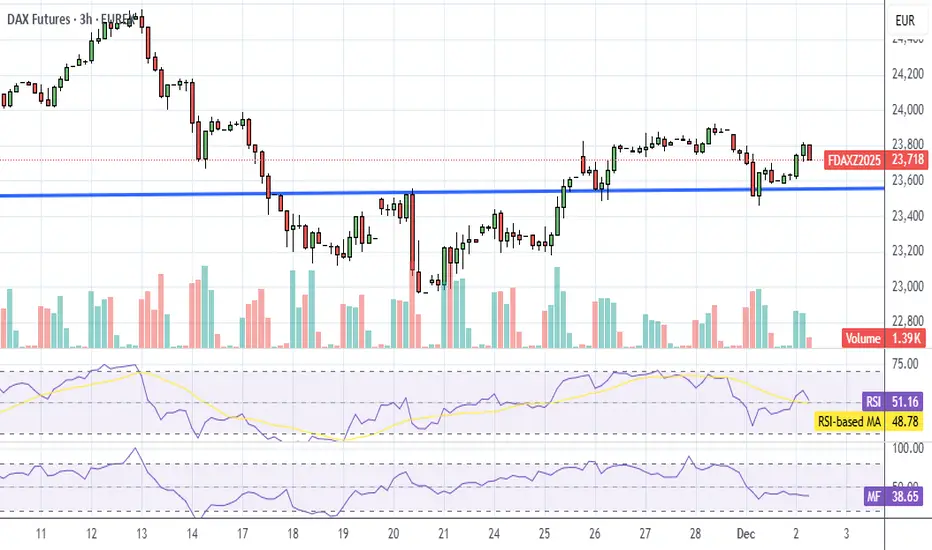
FDAX Premarket UpdateIndicators don't show much, but if you look at premarket futures, you can see that US index futures went down a little when FDAX went down a little. This is why I track the DAX.
Cryptos dipped as well.
I check ES, NQ, FDAX, and RTY indicators before trading.... unfortunately none of them are telling me a thing, lol. Probably staying out today.
FCPO Fibo 2.618now price at RM4,157.
Now price at resistant maybe price can break or pullback to level fibo 1.168 at TF H2.
if price break resistant maybe the price find another resistant.

NQ: 286th trading session - recapI am SO back. Last week: Monday was aigh, had to time on tuesday, wednesday I had school and thursday and friday was no action due to thanksgiving.
I am mentally in a really good spot again and I focus my time on scalping again.

XAUUSD – Liquidity Grab Done, Bearish Continuation ExpecteGold (XAUUSD) – Bearish Retracement After Buy-Side Liquidity Sweep
Price has tapped into a major buy-side liquidity zone, clearing the previous highs and triggering liquidity grab. After the sweep, market structure shifted and price started forming a clean descending channel, showing controlled bearish momentum.
Currently, price has pulled back into the premium retracement zone, aligning with the channel’s upper boundary — a strong confluence for a potential short setup.
If the bearish structure continues, I am expecting:
Short-term retracement + bearish continuation
Targeting the next demand imbalance zone marked on the chart
A deeper drop toward the 4,155 – 4,160 zone where strong buy orders may appear
Reasons for Bearish Bias:
• Buy-side liquidity already cleared (reversal signal)
• Clear bearish channel structure
• Retest of broken structure + premium zone
• Multiple imbalance zones below waiting to be filled
This idea remains valid as long as price stays below the highlighted rejection area.

The bulls are correcting before continuing their upward surge!Gold opened lower but rebounded, quickly stabilizing around 4192. Bulls launched a counterattack from the lows, reaching a high of around 4226 before entering a period of consolidation and pullback. The current movement is still within a normal adjustment structure, with some room for further retracement. In terms of trading, focus on the key support zone around 4200-4190, which was broken after the previous surge. As long as this zone holds, the strategy remains to buy on dips. The international macroeconomic environment continues to favor gold, and the technical structure also remains bullish. Therefore, buying on dips is crucial, rather than blindly chasing highs – this is the core of sound trading. Looking at the 4-hour chart, the resistance level to watch is around 4250-4260, a key resistance level. Support is seen around 4205-4190, a crucial support level for the bulls. Therefore, today's strategy remains to patiently wait for pullbacks at key levels. As long as the support holds, the potential for further bullish movement remains significant.

XAUUSD at 2HR timeframe : LONG IDEA XAUUSD looks bullish for the 2HR price structure, looking at the bullish structure in gold


Gold Buy only / never SellTechnical analysis: Gold is showcasing underlying Bullish trend and is comfortably Trading above #4,200.80 psychological barrier throughout the session (Xau-Usd Spot prices). The pullback can extend as High as the Resistance (former Support now turned to Resistance) on Hourly 1 chart which is currently Trading at #4,208.80 and #4,218.80 - #4,222.80 Resistance zone respectively, I do expect #4,227.80?test in extension before new Short-term Sellers appear. The real market news should soon enough be digested by market as Gold is bound to give one more Lower High’s before the Bullish Medium-term trend resumes. As DX is on decent recovery and Bond Yields still Trading above the Resistance zone, I was expecting some Selling action / momentum on Gold which is currently over and #4,300.80 benchmark is ahead of us.
My position: I have been Buying Gold aggressively from #4,222.80 Support throughout yesterday’s session many times and closing m orders as near as #4,242.80 Resistance. I Bought Gold this morning #4,185.80 aggressively as well with set of Buying orders. I will continue Buying aggressively above #4,208.80 Resistance is invalidated. #4,300.80 and #5,100.80 Medium-term Targets.

Gold Buys only / never SellTechnical analysis: Gold is showcasing underlying Bullish trend and is comfortably Trading above #4,200.80 psychological barrier throughout the session (Xau-Usd Spot prices). The pullback can extend as High as the Resistance (former Support now turned to Resistance) on Hourly 1 chart which is currently Trading at #4,208.80 and #4,218.80 - #4,222.80 Resistance zone respectively, I do expect #4,227.80?test in extension before new Short-term Sellers appear. The real market news should soon enough be digested by market as Gold is bound to give one more Lower High’s before the Bullish Medium-term trend resumes. As DX is on decent recovery and Bond Yields still Trading above the Resistance zone, I was expecting some Selling action / momentum on Gold which is currently over and #4,300.80 benchmark is ahead of us.
My position: I have been Buying Gold aggressively from #4,222.80 Support throughout yesterday’s session many times and closing m orders as near as #4,242.80 Resistance. I Bought Gold this morning #4,185.80 aggressively as well with set of Buying orders. I will continue Buying aggressively above #4,208.80 Resistance is invalidated. #4,300.80 and #5,100.80 Medium-term Targets.
Is Gold's Movement a Normal Correction or a Downtrend?Gold's movement is in line with our expectations. Our operations last trading day were very successful; both long and short positions were profitable. We repeatedly reminded everyone not to chase the highs, as a correction was inevitable without a firm hold above $4260, a prediction that has proven accurate. Gold opened higher but then fell back, breaking below the previous trading day's low. This is partly due to the gradual digestion of expectations, and partly due to support from central bank interest rate cut expectations. Gold's overall trend remains bullish; the current movement is merely a consolidation within an uptrend, a correction to build momentum for further gains. It's important to avoid chasing the highs and observe the strength of the pullback.
The support level around 4200-4190 needs to be monitored. Only by holding this level can the bullish outlook continue. Key resistance levels to watch are 4225-35, with significant resistance around 4250. In this consolidation phase, the preferred entry point for long positions is around 4200-4210. Today's strategy is primarily to buy on dips, with selling on rallies as a secondary approach. I update my trading ideas and strategies daily. If you lack a plan or ideas for gold trading and are unable to achieve consistent and stable returns, you can refer to my updates. For real-time trading signals, please find the channel entry and contact me.
I focus solely on short-term trading and clear market analysis. In short-term trading, there is no market that rises or falls forever, only the correct entry point at any given moment. Find the rhythm and follow the trend. This is the essence of trading.
