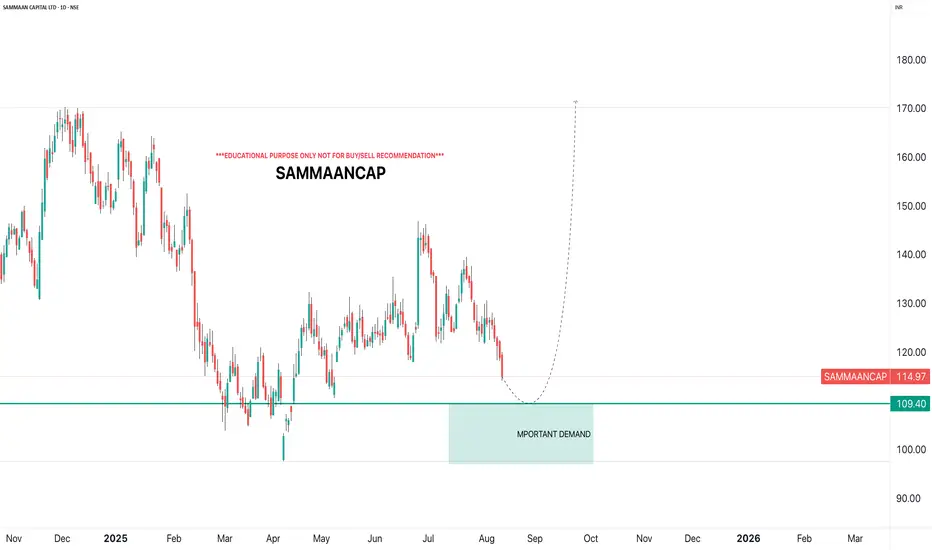
SAMMAANCAPi Observed these Levels based on Price Action and Demand & Supply which is my own Concept "PENDAM CONCEPTS"... Please don't take any trades based on this chart/post... Because this chart is for educational purpose only not for Buy or Sell Recommendation... Thank Q
NSDL | Post‑Listing Surge Near ₹1,425Summary
After listing at ₹880 on Aug 6, NSDL rallied to ~₹1,425 within four sessions before profit‑taking; near‑term P/E ~77–79 vs peer CDSL ~66, so momentum may pause into the Aug 12 results.
Chart Thesis
Structure: Parabolic advance from ₹880 to ₹1,425, followed by intraday rejection—first meaningful pullback likely to set a higher low above ₹1,200 if the trend is to continue.
Levels:
Long zone: ₹1,200–₹1,250
Invalidation: Close <₹1,160
Targets: ₹1,360 → ₹1,400–₹1,425
Note: Event risk—board meets Aug 12 to consider Q1 FY26; expect swings.
Fundamentals
FY25 revenue +~12% to ₹1,420–1,535cr; PAT ₹343cr (+~25% YoY); near‑duopoly advantages but valuation now full post‑rally.
Plan
Avoid chasing strength; buy dips only with tight risk and take partials near prior highs. Investors with IPO gains can book some profits and hold a core for the long term.
Disclaimer: Educational, not investment advice. Manage risk.


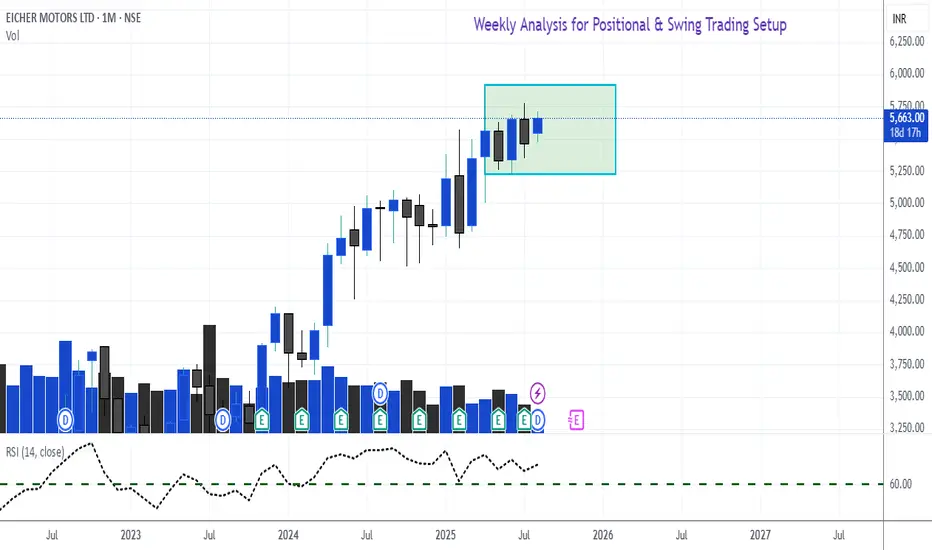
Weekly & Monthly Analysis - Swing & Positional Trade SetupsAs per our setup shared, I am hereby forwarding you all the scripts which fits to our criteria.
Those who are new please check previous post for better understanding.
These setups are for Swing Trading, Positional Trading and Stock Options buying.
Stocks which came out from Analysis are -
Eicher Motors - Monthly range - RSI above 60 - wait to break that range for new entry
Heromoto - Monthly RSI at 58. About to cross 60. buying above high 4712.
TVS Motor - Monthly RSI at 63 - Buying range above 3031.
Lupin -Monthly RSI at 57 - Buying above 2163 high
Dixon - Monthly RSI at 63 - Buying above 17150 in stock options
Titan - Monthly RSI at 54 - Buying above range 3853
Ultracemc - Monthly RSI at 63 - Buying above 12728 in stock options
Polycab - Monthly RSI at 60- Buying in Stock options above 7623
Cummins - Monthly RSI at 67 - Wait for a pull back in the next coming month as it is near ATH.
Kindly analyse all these scripts given above. Take your wise decisions. All the best.
Faraaz T
Sr. Research Analyst - Equity & Derivatives
Stockholm Securities UK
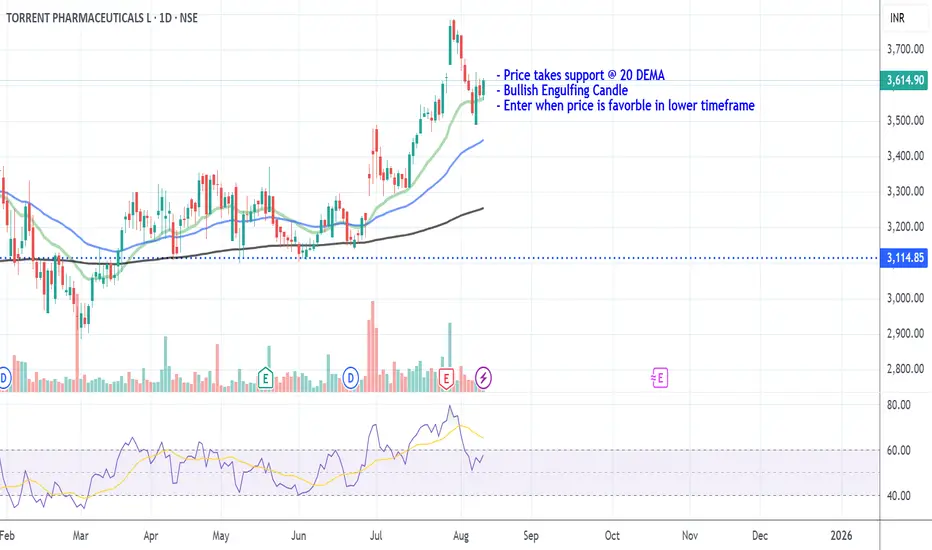
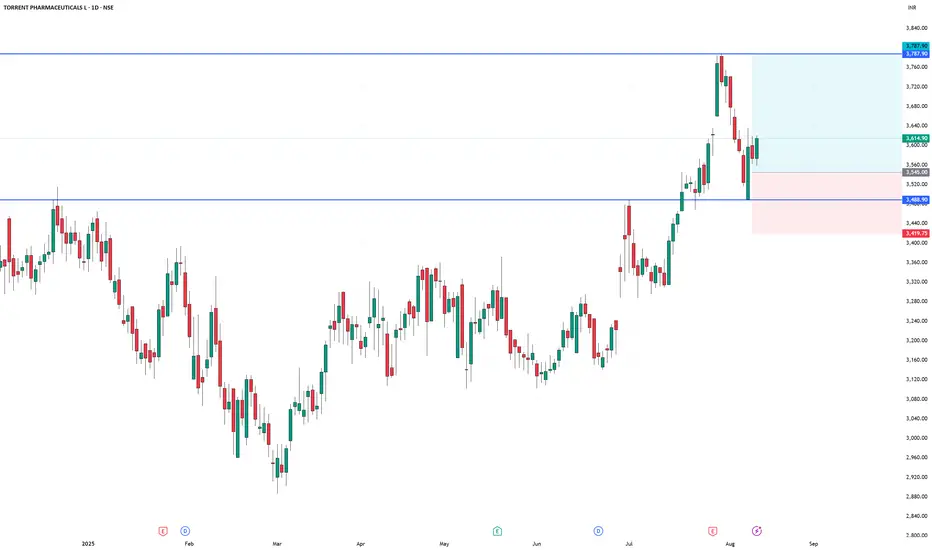
Torrent Pharm_Long_Support @ 20 DEMA- Price takes support @ 20 DEMA
- Bullish Engulfing Candle
- Enter when price is favorble in lower timeframe
BSE Takes Breather Before Its Next Move‽BSE Ltd, Asia's oldest stock exchange and a backbone of India's financial markets, has been a silent wealth creator over the past year.
From early 2024, the stock went on a dream run, driven by surging investor participation, record equity and derivatives turnover, and its diversified revenue streams - listing fees, transaction charges, and new technology-led offerings.
But like every strong trend, momentum eventually pauses. Since June, the rally cooled, and the price entered a downward-sloping channel, hinting at profit booking and cautious sentiment.
Technicals
• Primary Resistance: ₹2,500 - the top of the falling channel and a key breakout gate.
• Current Support: *2,365, where buyers have recently shown interest.
• Major Demand Zone: ₹2,270-₹2,300 - a historical springboard that fueled earlier surges.
• If Support Fails: A slide towards *1,946 and 1,775 could unfold.
The structure resembles a falling channel with a descending triangle base a classic setup where a decisive breakout can flip sentiment overnight.
The Bigger Picture
BSE's fundamentals remain robust
• India's booming equity culture is increasing trading volumes.
• Growing market share in derivatives is adding fresh revenue streams.
• Technology upgrades and new product introductions are future-proofing its business model.
Short-term price weakness appears more like a healthy pause in a long-term uptrend - provided the ₹2,270 zone holds.
Key Watch Levels
• Bullish Trigger: Sustained close above ₹2,500 could open the path to ₹2,800+
• Bearish Trigger: Close below ₹2,270 may extend the correction to ₹1,946 or 1,775.
Market Sentiment Cue
If the broader market remains strong and participation continues to rise, BSE could be setting up for its next breakout phase. But if the market turns risk-off, the stock may test its lower zones before attempting a rebound.

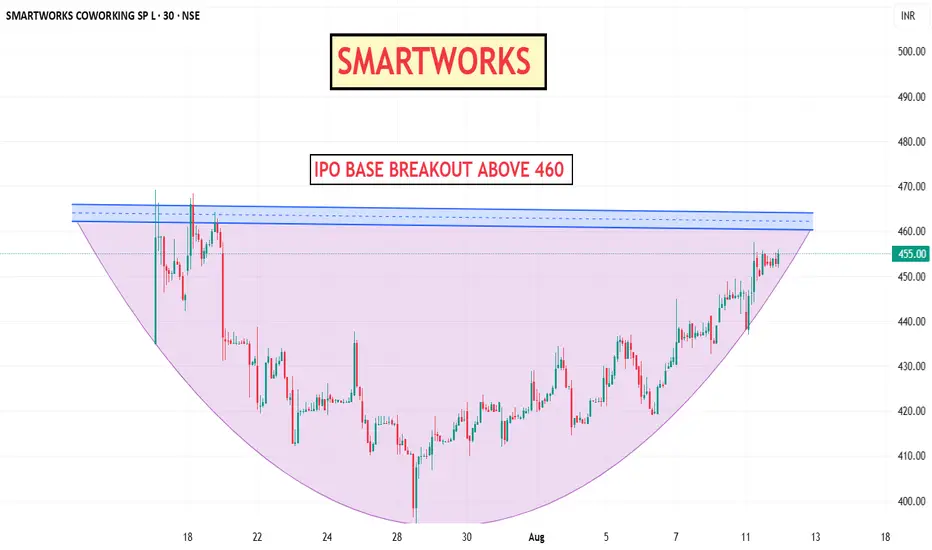
Breakout StockThis stock price after listing construct a strong base and finally break the resistance and now retest and ready for upmove.

Swing & Positional Trading - RSI - Monthly & DailyThis trading guide outlines a simple and effective setup for both positional and swing trades, focused on high beta, highly liquid stocks. Follow the rules strictly for better consistency and profitability.
🔹 Positional Trade Setup
• Open the Monthly Chart of the stock.
• Add the RSI (Relative Strength Index) indicator.
• Uncheck all levels (30, 50, 70) and only keep one level at 60.
• Edit the level from 70 to 60 and highlight it in green.
Entry Criteria:
• Stock must cross the 60 RSI level on the monthly chart.
• Entry is only triggered if the price breaks the previous month’s high.
Stop Loss:
• Place the initial stop loss below the previous month’s low.
Trailing Stop Loss:
• Trail the stop loss to the current month’s low, but only after the monthly candle closes.
• Continue trailing the stop loss every month using this method until exit.
Exit Rule:
• Exit the positional trade only if the current month’s candle closes below the previous month’s low.
⚡ Note: The RSI 60+ setup is a powerful momentum strategy with high reward probability.
🔹 Swing Trade Setup
• Precondition:
• Monthly RSI must cross above the 60 level.
• Switch to the Daily Chart
Entry Criteria:
• Identify the current swing high on the daily chart ( Current High Price Level)
• Entry is triggered only when the stock breaks the swing high.
Stop Loss:
• Place the stop loss below the current swing low.
• If unsure how to mark swing low, then use a daily close below RSI 60 as your stop.
Trailing Stop Loss:
• If the trade moves in your favor, trail the stop loss to each day’s low.
Exit Rule:
• Exit the swing trade only if RSI crosses back below 60 with a daily candle close.
📝 Conclusion
This is the final and simplified setup designed for traders looking for clarity and consistency in trading. No complicated indicators or confusing rules—just clean chart action with momentum logic.
🔥 Stock Options Trading Strategy – Built on Core Swing/Positional Principles
I’m now sharing a Stock Options Trading Concept that follows the same core principles but is tailored specifically for liquid stock options.
You’ve already been provided with a list of 75+ high-beta, liquid stocks. For this strategy, you will strictly focus only on those stocks.
✅ Strategy Setup
🔹 Timeframe Filters:
• Monthly RSI > 60 (RSI has crossed and is holding above 60)
• Daily RSI: RSI must be crossing 60 or on the verge of crossing
Now, on the Daily Chart, mark the current swing high and swing low.
📌 Two Entry Approaches:
Approach 1: Breakout Entry
• Entry: When swing high is broken.
• Stop Loss (SL): Swing low or previous week’s low.
Approach 2: Pullback Entry
• Wait for a retracement from swing high (should not exceed 50% retracement).
• Confirmation of pullback weakness: Volume bars should be shrinking/decreasing.
• Entry: On breakout of the last candle high of the pullback.
• Stop Loss: Swing low or previous week’s low.
Once in the trade, trail your stop loss to cost after 3 consecutive bullish candles.
📤 Exit Rules
• Exit the Stock Options position only if the Daily RSI close below 60.
⚠️ Important Guidelines for Stock Options
• 💡 Trade with only 1 lot. Never exceed your lot size.
• 📅 Enter after 2 days of the monthly expiry and exit before 2 days of next monthly expiry to avoid smart money manipulation.
• 🎯 Choose strike prices in multiples of 25, 50, 75, or 100 for better liquidity.
• Example: If stock is at 1564, choose 1550 ITM or 1575 ATM.
• ⏱️ For quick exits, always place exit orders at round numbers like 5 or 10 levels.
• Example: If you entered at ₹70 and the option is at ₹144, place an exit at ₹140 or ₹145—not any random price.
For PE buying-
Monthly RSI < 40
Weekly RSI < 40
Daily RSi crossing 40 or below
Same process for PE with 2 approach as you like but in reverse form.
📊 75 High-Beta, Highly Liquid NSE Stocks
These stocks are liquid, fundamentally strong, and mostly traded in the F&O segment — giving you both flexibility and depth.
🚗 Auto
• Bajaj Auto
• Bosch Ltd
• Eicher Motors
• Hero Motocorp
• Maruti Suzuki
• TVS Motors
• Tata Motors
🏦 Banking & Financial Services
• Bank of Baroda
• Kotak Mahindra Bank
• Axis Bank
• ICICI Bank
• HDFC Bank
• IndusInd Bank
• Bajaj Finserv
• Bajaj Finance
• SBI
🧪 Chemicals
• Aarti Industries
• Atul Ltd
• Navin Fluorine
• UPL
• Tata Chemicals
🍫 FMCG
• Britannia Industries
• Godrej Consumer
• Tata Consumer
• DMart
• Hindustan Unilever
• Dabur
💊 Pharma & Healthcare
• Apollo Hospitals
• Alkem Labs
• Biocon
• Divis Labs
• Dr. Reddy’s
• IPCA Labs
• Laurus Labs
• Lupin
• Aurobindo Pharma
• Sun Pharma
• Cipla
💻 IT Sector
• HCL Technologies
• Infosys
• LTIMindtree
• TCS
• Tech Mahindra
• Wipro
⛓️ Steel & Metals
• APL Apollo Tubes
• JSW Steel
• Jindal Steel
• Tata Steel
• Hindalco
• L&T
🛢️ Oil & Gas
• Reliance Industries
• Gujarat Gas
• Indraprastha Gas (IGL)
• Mahanagar Gas (MGL)
• Tata Power
🏢 Realty
• DLF Ltd
• Godrej Properties
• Lodha (Macrotech Developers)
• Oberoi Realty
• Phoenix Mills
🛋️ Durables & Others
• Sona BLW (Sona Comstar)
• Amber Enterprises
• Bata India
• Crompton Greaves
• Dixon Technologies
• Titan Company
• ACC Cement
• Ambuja Cement
• Ultratech Cement
• Voltas Ltd
• Polycab India
• Mazagon Dock (Mazdock)
• Asian Paints
• Berger Paints
📝 Final Thoughts
This is not just a strategy — it’s a framework to reprogram your trading mindset. Use higher timeframes, respect structure, and focus only on high-probability setups. You’re not here for noise. You’re here for moves that matter.
If this helped you, prepare a trading journal based on this strategy. Stay focused. Be consistent. Trade less, but trade right.

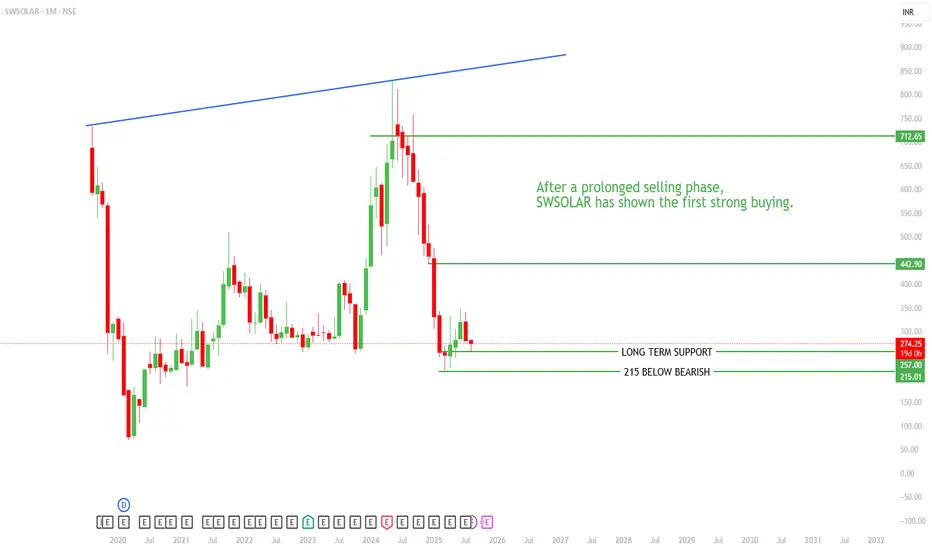
SWSOLAR – Long Term Support Test | 350 Above = Super BullishAfter a prolonged selling phase, SWSOLAR has shown the first strong buying reaction on the monthly chart — indicating potential accumulation at lower levels.
Key Levels to Watch:
350+ → Strong bullish sentiment, potential for a breakout towards 442 and 712 in the long term.
Long-Term Support: ~257 zone — currently holding above this level.
215 Below → Triggers bearish sentiment, could lead to deeper corrections.
View:
As long as price sustains above 257, the bias remains positive for positional traders. A sustained move above 350 could start a new bullish leg, while a break below 215 will invalidate the bullish setup.
Disclaimer:
This analysis is for educational purposes only and not financial advice. Please do your own research before trading or investing.
TGVSL - Good for Long Term Investment*TGV SRAAC - CMP - 120 / Positional Trade*
*Buy Range 115 to 117 ONLY / Stop Loss 94 in weekly candle closing*
*Target 1 - 140*
*Target 2 - 150*
*Target 3 - 160*
Long Term 175 / 200+
Disclaimer: This is my view and for educational purpose only.

Strong Momentum With balanced ReturnsIt shows a more Robust BTST setup which cleaner breakout, confirmations across technical indicators Zee Learn Ltd is a promising candidate

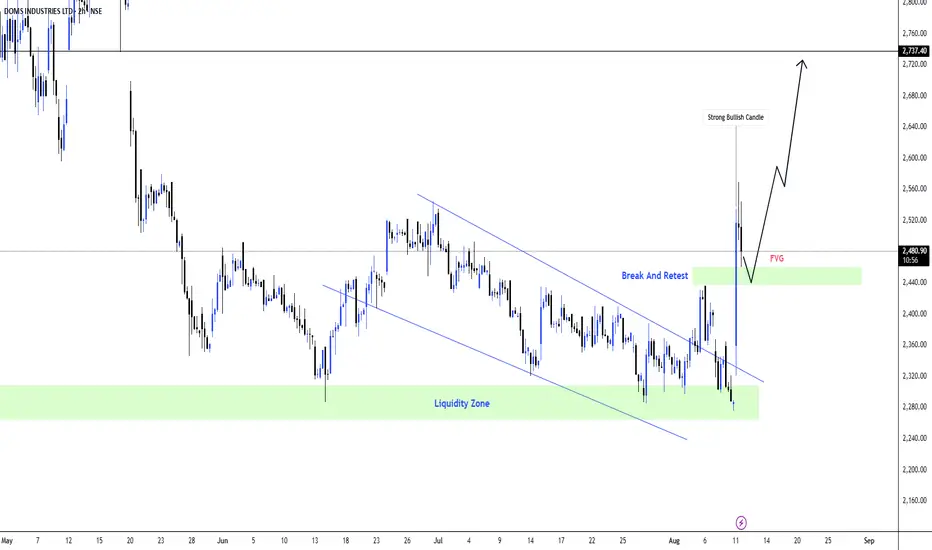
DOMS Earnings Breakout from Falling Channel–Buy Dips into 2,42xSummary
Strong Q1 FY26 triggered a high-volume breakout above a multi-week descending channel. Price reclaimed prior supply, leaving an FVG at 2,42x–2,46x that may act as demand on pullbacks.
Chart Thesis
Structure: Liquidity sweep into 2,30x–2,33x, impulsive bullish candle breaks channel and retests flip zone.
Momentum: Intraday high ~2,569; watch for shallow pullbacks to the FVG/demand to join trend continuation.
Levels:
Long zone: 2,420–2,460
Stop: 2,375–2,385 (below flip/invalidation)
Targets: 2,630 → 2,750 → 2,950–3,000; extended 3,115 if momentum persists.
Fundamentals
Rev +26.4% YoY; PAT +8.8%; capacity expansion and distribution initiatives intact; valuations rich (P/E ~66–69), so manage risk and avoid chasing breakouts far from support.
Plan
Buy-on-dips only; scale out at targets; if daily closes back below 2,380, exit and reassess.
Disclaimer: For educational purposes; follow personal risk management.
Continuation Inverse head and shoulder pattern Continuation Inverse head and shoulder pattern is trend continuation setup indicates price continue the previous trend

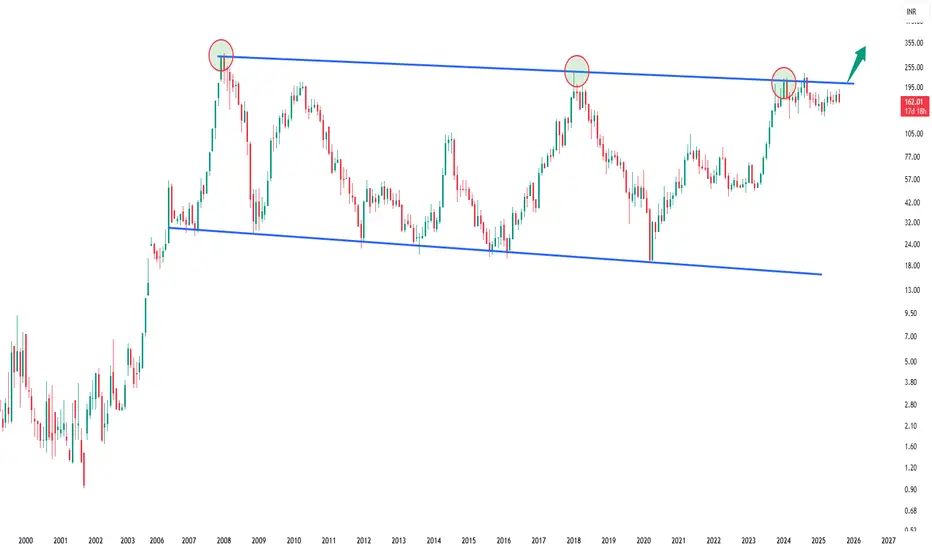
Ready for Multiyear BreakoutAfter multiyear consolidations finally this stock price ready for multiyear breakout . After breakout this stock price confirm its multiyear uptrend .
PNB Breaks Out of Long Downtrend – Bullish Continuation SetupDescription:
Punjab National Bank has broken out of a falling channel that lasted nearly a year. Price surged past the ₹105 resistance with strong volume (~60M), validating the breakout. RSI trending toward overbought confirms momentum. Prior resistance zone ₹102–104 may act as support on any pullback. As long as ₹100 holds, bias remains bullish.
Targets: ₹115 / ₹124
Stop: Below ₹98 (invalidation level)
Bias: Bullish continuation
Timeframe: Swing (2–6 weeks)
Disclaimer:
This idea is purely for educational purposes and reflects a technical setup based on chart patterns and price action. It is not a recommendation to buy or sell securities. PSU banks can be volatile and sensitive to macro/policy triggers. Traders should manage risk independently, use stop-loss, and size positions based on personal risk tolerance. Always do your own due diligence before taking any trade.

Mazdock Short_Rejectiojn @ 200 demaMazdock:
- Price breaks 200 dema
- Bearish Engulging candle.
- Enter short when the prices are favorable
- SL - close above 200 dema

ANGELONE SHORT_Rejection @ 200 DEMAANGELONE SHORT
- Price rejected from 20 DEMA
- Bearish Engulfing Pattern
- Short when price is favourable
- SL close above 200 dema

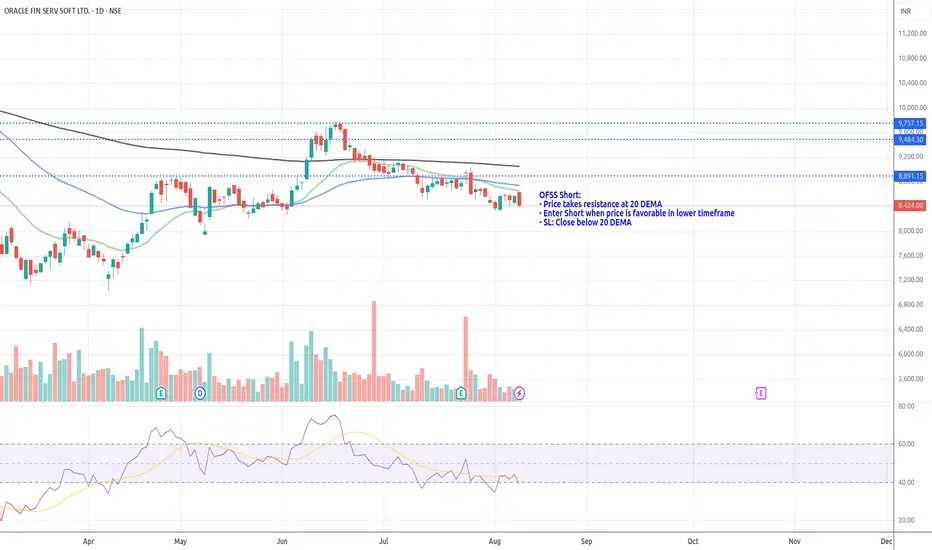
OFSS Short_Rejection @ 20 DEMAOFSS Short:
- Price takes resistance at 20 DEMA
- Enter Short when price is favorable in lower timeframe
- SL: Close below 20 DEMA
Ashapura MinechemA cup and handle breakout anticipated . Buy above 575-580 with not more than 8% stop loss. This June quarter result is good .

Review and plan for 12th August 2025 Nifty future and banknifty future analysis and intraday plan.
This video is for information/education purpose only. you are 100% responsible for any actions you take by reading/viewing this post.
please consult your financial advisor before taking any action.
----Vinaykumar hiremath, CMT

Ye Chart Kuch Kehta Hai - Eternal LimitedTechnical Analysis Recommendation for Eternal Limited:
The technical trend for Eternal Limited is currently bullish with moderate strength as of early August 2025. Key indicators include a bullish MACD on the weekly chart, bullish moving averages on the daily timeframe, and a bullish KST indicator on weekly and monthly charts. However, the weekly RSI indicates some short-term weakness, suggesting minor caution.
Recent technical signals include a 5-day EMA crossover, stochastic crossover on the weekly chart, and 10-day EMA crossover on the daily chart, all indicating buy signals with historical average gains of 4.7% to 11.8% within weeks after such signals.
Moving averages across timeframes (5, 10, 20, 50, 100, 200 days) show a strong buy consensus.
Price is trading near key resistance and pivot levels with expected upside momentum if a breakout occurs.
Clear Technical Recommendation:
Buy or hold if you have positions, especially on confirmed breakouts and after pullbacks to support levels. Use stop-losses below recent swing lows to manage risk.
Fundamental Analysis Recommendation for Eternal Limited:
The company’s valuation is very high, with a P/E ratio close to 999 and price-to-book around 9.6, reflecting a premium typical for high-growth sector stocks.
The Earnings Per Share (EPS) is low but positive (around ₹0.31), with growth in revenue highlighted by a strong quarter-on-quarter growth of 21.29%, the highest in 3 years.
Return on Equity (ROE) and Return on Capital Employed (ROCE) have shown improvement recently, indicating better operational efficiency and profitability recovery in fiscal 2025 compared to prior years where returns were negative or very low.
Interest coverage ratio is healthy at 11.13, showing the company comfortably covers interest expenses.
No dividend yield is offered, indicating reinvestment into growth.
Fundamental risks include the stretched valuations and reliance on sustained strong earnings growth to justify the premium multiples.
Clear Fundamental Recommendation:
Hold if you believe in continued earnings growth and operational improvement. For new buyers, wait for clearer signs of sustainable profit momentum or valuation compression to reduce downside risk.
In summary:
This separation clarifies that technically the stock looks attractive for buying or holding on strength, while fundamentally it requires caution and close monitoring of earnings and valuation justification.

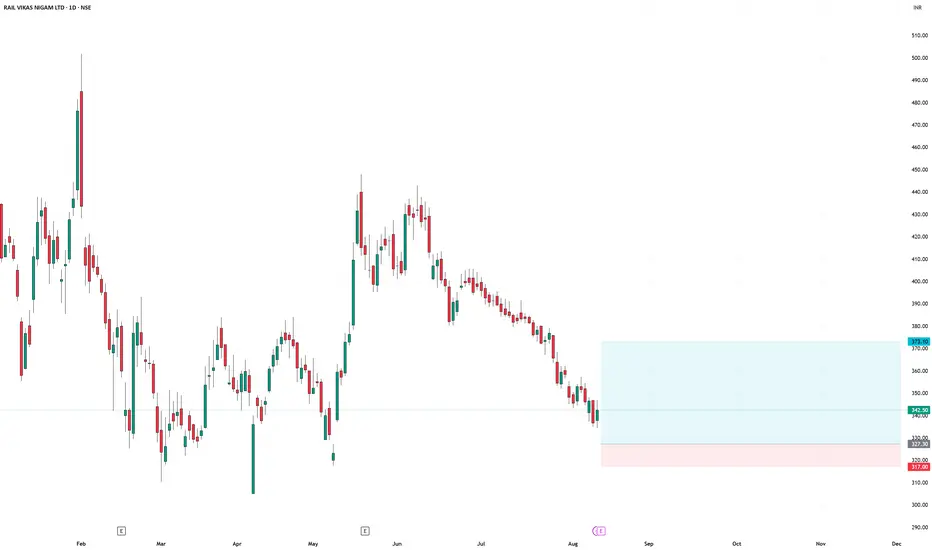
RAIL VIKAS NIGAM LTD swing log setupRAIL VIKAS NIGAM LTD swing log setup
Entry - 327.3
Stop Loss - 317
Target - 373.1
Risk Reward - 1:4.45