How Low Can Bitcoin Go in September 2025? Bearish BTC Price Prediction Scenarios & Support Analysis
Market analysts are closely monitoring Bitcoin's technical setup as the cryptocurrency navigates September trading at $110,804, following Friday's volatile session marked by weak NFP data and bearish candle formations. With historical September performance showing average declines of 3.77% and technical indicators suggesting potential deeper corrections, understanding key support levels becomes crucial for assessing Bitcoin's near-term trajectory.
Current Bitcoin Market Setup: Bearish Signals Emerge
Bitcoin started September trading around $108,253 but has recovered to $110,800 after Friday's volatile session that saw prices spike to $113,384 before closing near $110,700. According to my technical analysis, the bearish doji candle drawn during Friday's session—featuring a very long upper wick and extremely narrow body, could signal a sell-off to deepen the correction.
Key Friday developments:
- Bitcoinopened just below $111,000
- Reachedintraday high of $113,000+
- NFP data triggered sharpreversal (22,000 jobs vs 75,000 expected)
- Closedat $110,700, below opening price
- Unemploymentrose to 4.3% from 4.2%
The bearish candle formation proved significant because it occurred below the support zone established since early July around $112,000, the historical maximum from May 2025 that later served as support in August. This level has now been definitively broken, and Bitcoin is testing it from below according to polarity conversion principles in technical analysis.
Bitcoin Expert Technical Analysis: $100K-$104K Target Zone
According to my comprehensive technical analysis, Bitcoin currently faces reasonable resistance strengthened by the 50-day exponential moving average (50 EMA) and the 23.6% Fibonacci retracement measured from April lows to August's historical maximum above $124,000.
While Bitcoin has several local support levels including $110,000 and $108,000 coinciding with September lows, the key support level is located significantly lower. I'm currently targeting a technical correction toward the zone stretching from $104,000 to the psychological $100,000 level.
This narrow $4,000 range encompasses:
- 200-day exponential movingaverage (200 EMA)
- 50%Fibonacci retracement
- Psychologicalsix-figure level
- Coincides with early and lateJune lows
This represents an accumulation of many important technical levels that could concentrate buy orders. A drop to the mentioned zone would represent only a 20% correction, which isn't particularly dramatic for Bitcoin markets.
I want to emphasize that I don't believe Bitcoin faces an end to its upward trend: this would simply be a healthy technical correction, and declines to the mentioned zone would be utilized as entry opportunities.
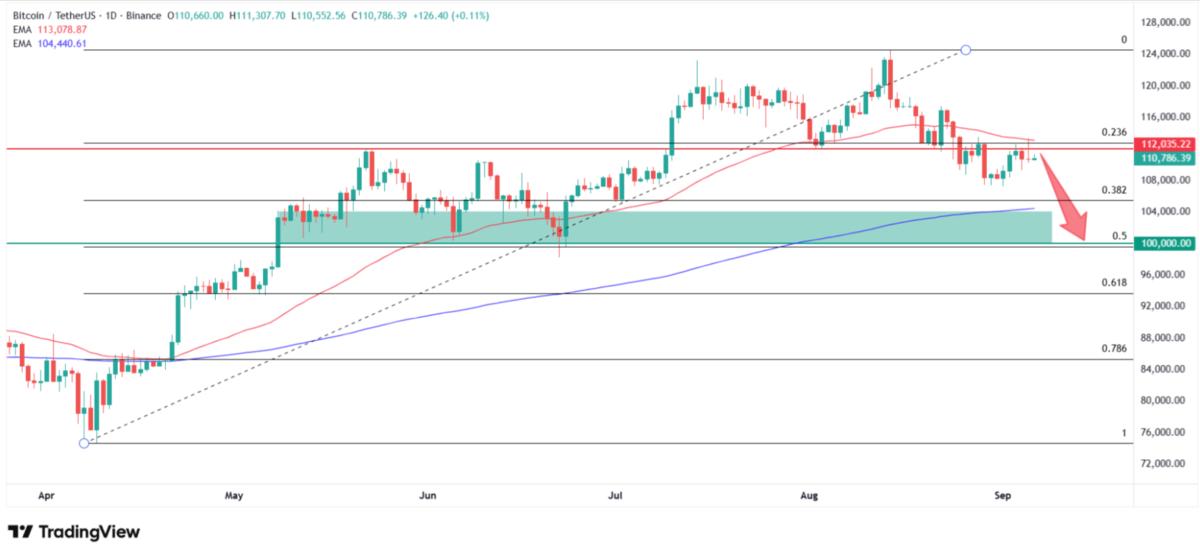
Bitcoin price technical analysis. Source: Tradingview.com
Analyst Bitcoin Price Predictions: Bearish Scenarios Range $78K-$95K
Peter Brandt's Head-and-Shoulders: $78K Target
Legendary technical analyst Peter Brandt warns of a potential crash to $78,000 based on a 45-day head-and-shoulders pattern formation. Brandt's analysis suggests this could complete and trigger a significant decline, though he cautions that "charts do NOT predict anything. Charts merely suggest possibilities."
CoinShares: Policy Disappointment Could Trigger $80K
James Butterfill from CoinShares sees potential for Bitcoin to correct to $80,000 if there's "disappointment surrounding Trump's proposed crypto policies and doubts about their enactment". This represents a more fundamental-driven bearish scenario tied to regulatory uncertainty.
TradingView Expert: $99K Crash Loading
Crypto analyst MelikaTrader94 forecasts an imminent crash below $100,000 as bears take control. The analysis highlights a descending trendline acting as strong resistance, with Bitcoin lacking momentum for sustained upward movement. A drop to $99,000 could "shake out weak hands" before any sustainable rally resumes.
ITB Broker: Worst Case $72K-$75K
ITB Broker's analysis presents the most bearish scenario, suggesting that if the $105,000 support breaks, selling pressure could push Bitcoin to $96,000, with extreme downside potentially reaching $72,000-$75,000.
Historical Context: September's Brutal Track Record
Bitcoin price predictions must account for September's devastating historical performance. Since 2013, Bitcoin has posted average returns of -3.77% in September, closing red in 8 of the past 12 years.
Why September typically brings selling pressure:
- Portfolio rebalancing byinstitutional investors before fiscal year-end
- Tax loss harvesting tooptimize yearly returns
- Reducedsummer liquidity amplifying volatility
- Psychological selling basedon historical patterns
However, Rekt Fencer argues that "a September dump is not coming" this year, citing similarities to 2017 when Bitcoin found support after August weakness before "rocketing to $20,000".
NFP Impact: Jobs Data Triggers Volatility
Friday's Non-Farm Payrolls miss (22,000 vs 75,000 expected) initially boosted Bitcoin as markets priced in higher Fed rate cut probability. However, the volatile reaction saw Bitcoin give back gains, confirming the market's uncertain direction amid mixed economic signals.
Market pricing now shows:
- 100% probability of25-basis-point Fed cut in September
- 14%chance of 50-basis-point cut
- Dollar weakness despiterisk-off sentiment in equities
Support Levels: Where Bitcoin Could Find Footing
InvestingHaven's "Buy the Dip" Zone: $78K-$82K
InvestingHaven analysts identify their primary "buy the dip" target between $78,000-$82,000. This zone represents approximately 25-30% correction from current levels and aligns with historical major support areas.
Changelly's Conservative $108K Floor
Changelly's September predictions show a minimum target of $108,802 with average prices around $119,470. This represents the most conservative downside scenario among major forecasting platforms.
Binance Technical Levels: $105K-$100K Range
Binance Square analysis highlights the $105K-$100K threshold as the nearest critical zone requiring attention. This aligns with my technical analysis identifying the same range as primary support.
FAQ: Bitcoin Downside Potential 2025
How low could Bitcoin realistically fall in September 2025?
Technical analysis suggests $100K-$104K as primary targets, with extreme scenarios reaching $78K-$95K range.
What would trigger a deeper Bitcoin correction?
Breaking below $105K support could accelerate selling toward $95K-$99K levels, while policy disappointments could target $78K-$80K.
Is the $100K level significant for Bitcoin?
Yes, it represents psychological support, 200-day EMA convergence, and 50% Fibonacci retracement from the April-August trend.
Could Bitcoin's correction be healthy for long-term growth?
Most analysts view 20% corrections as normal and healthy, providing accumulation opportunities before the next leg up.