Bitcoin Faces Drop; This Analyst Flags “Three Bars Down” Pattern for BTC Traders
BTCUSD, after facing rejection at an intraday resistance, has undergone a significant bearish correction and appears to have found support around $110.4K. As of writing, the cryptocurrency is trading near this level, with intraday traders watching price action closely to determine its next move.
Crypto analysts have issued a warning as Bitcoin exhibits a rare “three bars down” signal on its weekly chart. Historically, this pattern has preceded major corrections, although current market conditions may reduce the likelihood of a severe downturn. Traders should monitor key levels in the coming days for potential shifts in market direction.
Analyst Issues Warning on Bitcoin
A cryptocurrency analyst, Jason Pizzino, has issued a warning about a rare technical pattern forming on Bitcoin’s weekly chart, while noting that current market conditions may not indicate a severe downturn.
The “Three Bars Down” Signal
The analyst highlighted the “three bars down” signal, also referred to as “three red weeks,” which consists of three consecutive weekly candles with lower highs and lower lows following a significant peak.
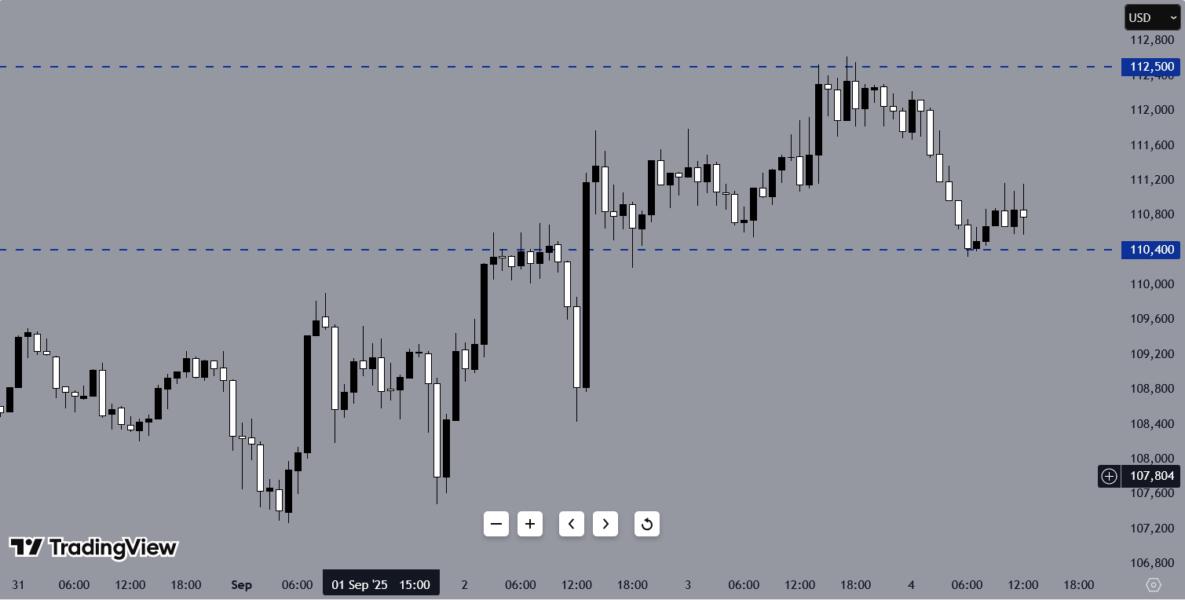
BTCUSD, H1 Chart, Source: TradingView
You may find it interesting at FinanceMagnates.com: Bitcoin Finds Support; Analysts Highlight US Offshore Access Impact on Crypto.
Historically, this pattern has preceded major Bitcoin corrections, including a 70% decline after the 2017 all-time high, a 55% drop in April 2021, and a 53% correction following June 2019. In the current bull market, the signal has already appeared twice, each time coinciding with roughly a 30% correction.
Why This Time Might Be Different
Despite the historical precedent, the analyst argued that the conditions this time differ from past occurrences. Previous signals coincided with periods of extreme market greed and peak Google search interest for Bitcoin, while the current market has not displayed sustained euphoria. This suggests that a deep correction may be less likely, and the bull market could continue.
Jason Pizzino 🌞@jasonpizzinoSep 04, 2025This rare weekly signal has crashed the price of Bitcoin by up to 70%. Crypto isn't immune to it either; however, we are yet to see the sentiment reach similar levels for the full impact of this signal. There are 4 days to go to invalidate this signal. #BTC #ETH #Crypto
Watch… pic.twitter.com/r5V82ESbXW
Key Levels to Watch
The analyst outlined key levels to monitor over the next four days as the weekly candle closes. A break above $113K would invalidate the bearish signal, signaling continued strength in Bitcoin.
Read More: Why Bitcoin Is Going Up? BTC Price Today Rallies Above $111K on Technical Breakout Signal.
The preferred short-term scenario involves a bounce toward $114K–$117K, followed by a rejection and a retest of recent lows near $107K, which could help establish a stronger base for a future rally. If the signal holds and the price fails to surpass $113K, it may indicate a longer and deeper correction extending into the fourth quarter.
Broader Market Context
The broader macroeconomic context also informs the analyst’s outlook. Expectations of upcoming interest rate cuts, strong performance in gold and silver, and historical seasonal trends suggest that Bitcoin and other major cryptocurrencies could experience a relatively positive fourth quarter, even if short-term consolidation occurs in September.