CRT [TakingProphets]
Purpose
Informational overlay to structure higher-timeframe (HTF) context. It does not generate buy/sell signals and is not financial advice. Use it to organize analysis and alerts—not to automate trades.
What it does
Projects HTF candles (1m → 1M) on any lower timeframe so the big picture stays on the chart.
Detects CRT transitions on the HTF (bullish/bearish “failed continuation” pattern).
Evaluates SMT divergence vs. a user-selected correlated instrument on the same HTF (historical & real-time).
Extends live HTF Open/High/Low/Close as developing reference levels.
Concepts (what it looks for)
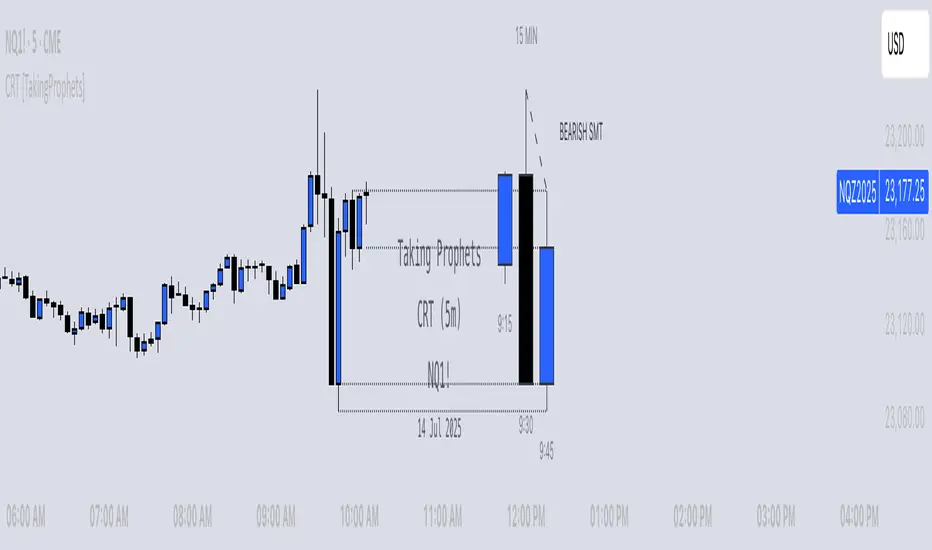
Candle Range Theory (CRT) — a 3-bar HTF pattern where candle 2 fails to continue candle 1’s move:
Bearish CRT: candle 2 trades above candle 1’s high but closes back inside candle 1’s range and does not break its low.
Bullish CRT: candle 2 trades below candle 1’s low but closes back inside candle 1’s range and does not break its high.
SMT divergence (intermarket) — compares HTF swing extremes between the chart symbol and a correlated symbol:
Bearish SMT: one makes a higher high while the other does not.
Bullish SMT: one makes a lower low while the other does not.
Checked in two modes: historical (between the two last closed HTF bars) and real-time (last closed vs. current forming HTF bar).
How the elements work together (integration, not a mashup)
All modules share one HTF time base, so annotations describe the same segment of price action. The overlay produces an explicit context state by sequencing the modules in this order:
HTF Projection → Structural Frame
The last three HTF candles are drawn (bodies+wicks). This creates the “canvas” the rest of the logic references (ranges, highs/lows, and time boundaries).
CRT Test → Directional Bias Candidate
The script evaluates the 3-bar CRT conditions on those exact HTF candles (not lower-TF approximations).
If conditions are forming on the current HTF bar, status is CRT Forming.
If they complete on the close, status becomes CRT Confirmed (Bullish/Bearish).
SMT Check → Confirmation/Stress-Test on the Same HTF
Using the same HTF window, the tool compares swing progress with the correlated symbol.
Historical SMT comments on whether the prior HTF segment’s push had intermarket agreement.
Real-time SMT comments on the current forming push.
This lets you confirm a CRT bias (e.g., Bearish CRT + Bearish SMT) or challenge it (e.g., Bullish CRT but Bearish SMT).
Live HTF OHLC → Actionable Reference Levels
The current HTF Open/High/Low/Close are extended as levels. These are the decision rails you’ll typically use to judge follow-through, failure, mitigation, or targets in the same CRT/SMT context.
Resulting context states (what you’ll see in alerts/labels):
Neutral (no CRT; SMT may still inform context).
CRT Forming (monitor): HTF push is underway; watch real-time SMT into HTF High/Low/Close projections.
CRT Confirmed (bias): HTF failure pattern locked; use projections as reference for continuation/invalidations.
CRT + SMT Aligned (confluence): CRT direction agrees with SMT; strongest context.
CRT vs. SMT Mixed (caution): bias exists but intermarket is disagreeing; treat levels as potential fade zones.
Why this is not a mashup
Every module is computed and plotted in the same HTF coordinate system, so signals are about one thing: the current HTF segment.
CRT provides the bias hypothesis, SMT provides a cross-market test of that hypothesis in the same window, and live OHLC projections supply the exact levels used to act on or fade that hypothesis.
Alerts are tied to state transitions (e.g., CRT forming → confirmed; SMT flip), not to unrelated features.
Mechanics (high-level)
HTF Projection: pulls HTF OHLC/time for the last three HTF bars and renders body boxes + wicks; optional time labels adapt to intraday vs D/W/M.
CRT Labels: when the three-bar conditions are met, prints BULLISH CRT or BEARISH CRT on the HTF stack.
SMT Lines: draws labeled diagonals across the relevant HTF pair for historical and real-time checks using your correlated symbol.
Live Levels: extends the current HTF Open/High/Low/Close horizontally; anchors are deterministic (Open = first bar, High/Low = first occurrence, Close = current bar).
Inputs & customization
HTF timeframe: 1m–1M.
Display: candle width/opacity, borders/wicks, time labels (12h/24h).
SMT: enable/disable, correlated symbol, line style/width, optional labels.
Projections: enable/disable, left extension (bars), per-level styling and price labels.
Alerts: switches for CRT, SMT-historical, SMT-real-time.
Alerts (workflow prompts)
Bullish/Bearish CRT detected on the selected HTF.
Bullish/Bearish SMT (historical) between the two last closed HTF bars.
Bullish/Bearish SMT (real-time) between the last closed and current forming HTF bar.
Suggested text includes the HTF and current context state so you know if CRT and SMT are aligned or mixed.
Example use
Bearish scenario: A Bearish CRT confirms on the 4H; soon after, real-time SMT (bearish) appears while price probes the projected 4H High. Context = CRT + SMT Aligned → treat the projected Open/Close as near-term objectives.
Mixed scenario: A Bullish CRT forms on 1H, but historical SMT (bearish) printed in the prior segment. Context = Mixed → continue to monitor real-time SMT and projected Low for possible invalidation.
Notes & limitations
HTF values are provisional until the HTF bar closes; labels/lines can update while forming.
SMT depends on the correlated symbol you select; relationships vary by market/regime.
Session gaps/illiquid hours can distort extremes and time labels.
Educational tool: no performance claims, no entry/exit signals.
Originality & scope (for protected/invite-only publications)
A unified HTF projection → CRT test → SMT check → live level pipeline that yields explicit context states instead of separate, unrelated overlays.
Formal CRT detection performed on actual HTF bars (not lower-TF approximations).
Dual-mode SMT tied to the same HTF windows (historical + real-time), plotted as labeled span lines.
Deterministic OHLC projection (first-occurrence anchoring) to align decisions with the identified context.
Attribution: CRT/SMT concepts inspired by ICT. Design, implementation, and alert framework by TakingProphets.
Invite-only script
Only users approved by the author can access this script. You'll need to request and get permission to use it. This is typically granted after payment. For more details, follow the author's instructions below or contact TakingProphets directly.
TradingView does NOT recommend paying for or using a script unless you fully trust its author and understand how it works. You may also find free, open-source alternatives in our community scripts.
Author's instructions
Disclaimer
Invite-only script
Only users approved by the author can access this script. You'll need to request and get permission to use it. This is typically granted after payment. For more details, follow the author's instructions below or contact TakingProphets directly.
TradingView does NOT recommend paying for or using a script unless you fully trust its author and understand how it works. You may also find free, open-source alternatives in our community scripts.