OPEN-SOURCE SCRIPT
Updated Niteya BG Candle Formations
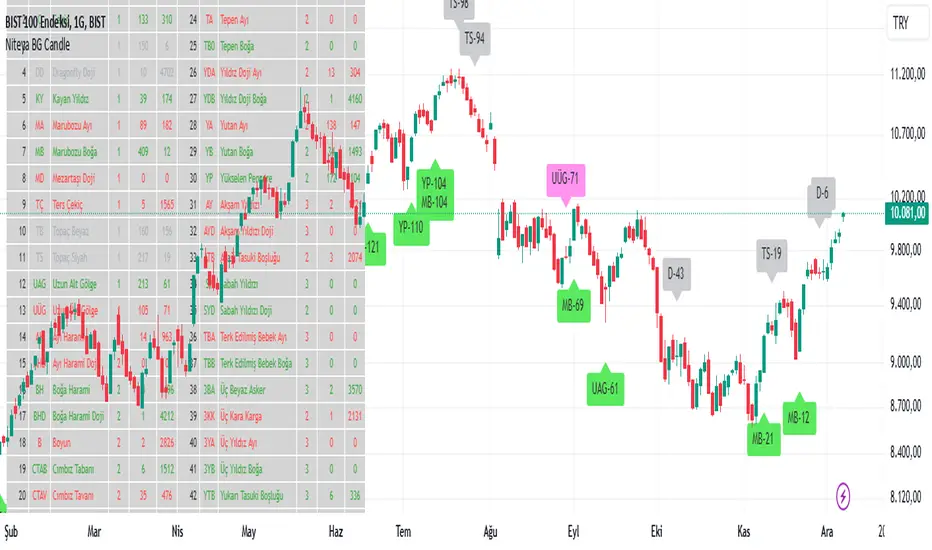
Niteya BG Candle Formations is an indicator that shows the total number of formations of each of the 44 different candlestick formations and the index of the last bar it was formed in a table and on a chart.
It shows candlestick formations that express uptrends and downtrends and indecisive market conditions in different colors.
The table columns contain the values shown below:
S.No: Candlestick formation bar index number
Code: Candlestick formation abbreviation
Formation: Name of the candlestick formation
Quantity: Number of candles in the formation
Total: Total number of formations on the chart
Last: Index of the last formation on the chart
bilgigunlugum.net/public/images/borsa/candlef_1.png
Details
bilgigunlugum.net/borsa/pine_script/pine_script_indicator/candlef
Türkçe açıklaması
Niteya BG Candle Formations, toplam 44 adet farklı mum formasyonunun her birinin toplam oluşma sayısını ve en son oluştuğu barın endeksini bir tabloda ve grafik üzerinde gösteren bir indikatördür.
Yükseliş ve düşüş trendleri ile kararsız piyasa durumlarını ifade eden mum formasyonlarını farklı renkte gösterir.
Tablo sütunları aşağıda gösterilen değerleri içerir:
S.No: Mum formasyonu sıra numarası
Kod: Mum formasyonu kısaltması
Formasyonu: Mum formasyonunun adı
Adet: Formasyonu oluşturan mum sayısı
Toplam: Grafikte gerçekleşen toplam formasyon sayısı
Son: Grafikte gerçekleşen en son formasyon endeksi
bilgigunlugum.net/public/images/borsa/candlef_1.png
Detaylar
bilgigunlugum.net/borsa/pine_script/pine_script_indicator/candlef
Release Notes
Table and character sizes have been reduced.Open-source script
In true TradingView spirit, the creator of this script has made it open-source, so that traders can review and verify its functionality. Kudos to the author! While you can use it for free, remember that republishing the code is subject to our House Rules.
Disclaimer
The information and publications are not meant to be, and do not constitute, financial, investment, trading, or other types of advice or recommendations supplied or endorsed by TradingView. Read more in the Terms of Use.
Open-source script
In true TradingView spirit, the creator of this script has made it open-source, so that traders can review and verify its functionality. Kudos to the author! While you can use it for free, remember that republishing the code is subject to our House Rules.
Disclaimer
The information and publications are not meant to be, and do not constitute, financial, investment, trading, or other types of advice or recommendations supplied or endorsed by TradingView. Read more in the Terms of Use.