OPEN-SOURCE SCRIPT
Fractal Strength Oscillator
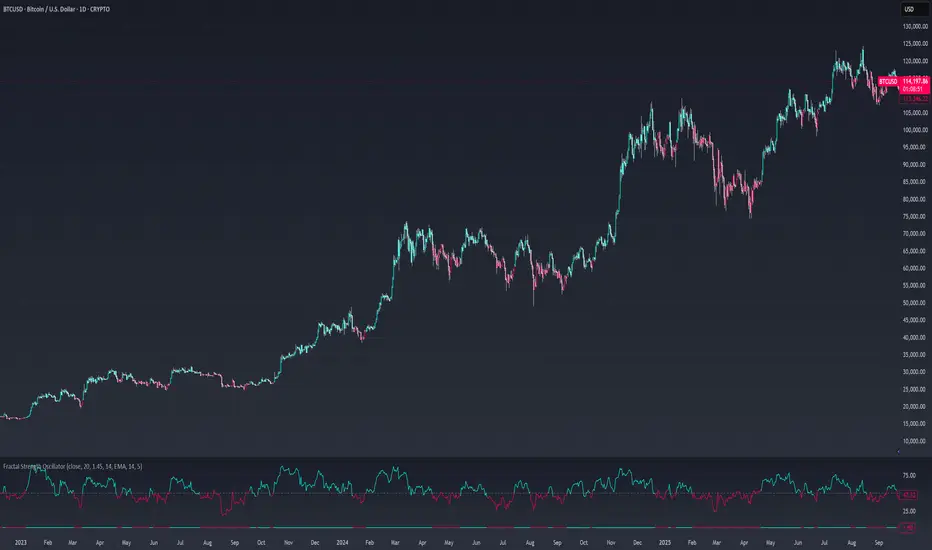
The Fractal Strength Oscillator Indicator combines the Relative Strength Index (RSI) and Fractal Dimension Index (FDI) to identify market momentum and trend direction. By integrating RSI's momentum signals with FDI's fractal-based trend analysis, this indicator provides clear visual cues for bullish and bearish conditions through colored plots and price bars.
How It Works
Trend Logic
Customization & Parameters
Trading Applications
Final Note
The Fractal Strength Oscillator Indicator is a straightforward tool for traders seeking momentum and trend insights. Its combination of RSI, FDI, and visual cues supports informed trading decisions. Backtest thoroughly and use within a broader strategy. This indicator is for educational purposes and not financial advice.
How It Works
- RSI Calculation: Computes RSI based on a user-selected price source (default: Close) over a configurable period. Optional smoothing with various moving average types (e.g., SMA, EMA, ALMA) enhances signal clarity.
- FDI Calculation: Measures market complexity using a fractal dimension over a user-defined period (default: 20). A threshold (default: 1.45) determines trend strength.
Trend Logic
- Bullish Signal: RSI > 55 or FDI < threshold indicates upward momentum
- Bearish Signal: RSI < 45 or FDI > threshold indicates downward momentum
Customization & Parameters
- RSI Parameters: RSI length, smoothing option ["SMA", "EMA", "DEMA", "TEMA", "WMA", "VWMA", "SMMA", "HMA", "LSMA", "ALMA"] , MA type, MA length, ALMA sigma
- FDI Parameters: FDI length, trend threshold.
Trading Applications
- Momentum Trading: Use RSI and FDI signals for entry/exit points.
- Trend Confirmation: Bar coloring aligns with trend signals.
- Reversal Detection: Identify shifts when RSI or FDI crosses thresholds
Final Note
The Fractal Strength Oscillator Indicator is a straightforward tool for traders seeking momentum and trend insights. Its combination of RSI, FDI, and visual cues supports informed trading decisions. Backtest thoroughly and use within a broader strategy. This indicator is for educational purposes and not financial advice.
Open-source script
In true TradingView spirit, the creator of this script has made it open-source, so that traders can review and verify its functionality. Kudos to the author! While you can use it for free, remember that republishing the code is subject to our House Rules.
Disclaimer
The information and publications are not meant to be, and do not constitute, financial, investment, trading, or other types of advice or recommendations supplied or endorsed by TradingView. Read more in the Terms of Use.