OPEN-SOURCE SCRIPT
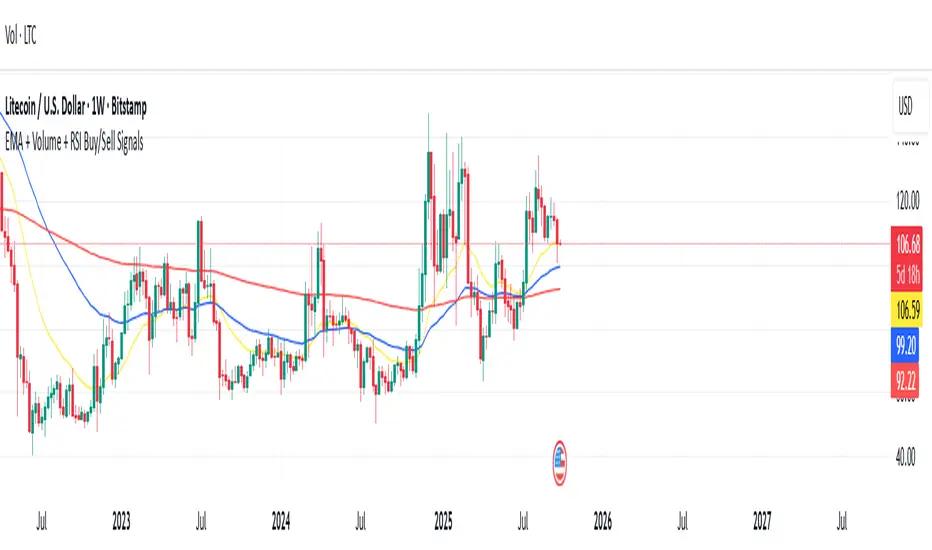
EMA + Volume + RSI Buy/Sell Signals
//version=5
indicator("EMA + Volume + RSI Buy/Sell Signals", overlay=true)
// === Inputs ===
ema20 = ta.ema(close, 20)
ema50 = ta.ema(close, 50)
ema200 = ta.ema(close, 200)
rsi = ta.rsi(close, 14)
// === Conditions ===
// Price % change from yesterday
priceChange = (close - close[1]) / close[1] * 100
// Volume condition
volCondition = volume > 1.5 * volume[1]
// RSI
rsiOverbought = rsi > 70
rsiOversold = rsi < 30
// Price move conditions
priceUp5 = priceChange > 5
priceDown5 = priceChange < -5
// === Buy & Sell Conditions ===
buySignal = close > ema20 and close > ema50 and close > ema200 and priceUp5 and volCondition and rsiOversold
sellSignal = close < ema20 and close < ema50 and close < ema200 and priceDown5 and volCondition and rsiOverbought
// === Plot EMAs ===
plot(ema20, color=color.yellow, title="EMA 20")
plot(ema50, color=color.blue, title="EMA 50")
plot(ema200, color=color.red, title="EMA 200")
// === Plot Signals on Chart ===
plotshape(buySignal, title="BUY Signal", style=shape.labelup, color=color.green, text="BUY", location=location.belowbar, size=size.normal)
plotshape(sellSignal, title="SELL Signal", style=shape.labeldown, color=color.red, text="SELL", location=location.abovebar, size=size.normal)
// === Background Highlight for Visuals ===
bgcolor(buySignal ? color.new(color.green, 85) : na)
bgcolor(sellSignal ? color.new(color.red, 85) : na)
Open-source script
In true TradingView spirit, the creator of this script has made it open-source, so that traders can review and verify its functionality. Kudos to the author! While you can use it for free, remember that republishing the code is subject to our House Rules.
Disclaimer
The information and publications are not meant to be, and do not constitute, financial, investment, trading, or other types of advice or recommendations supplied or endorsed by TradingView. Read more in the Terms of Use.