PROTECTED SOURCE SCRIPT
Updated UDI Directional Lines 5/20ema
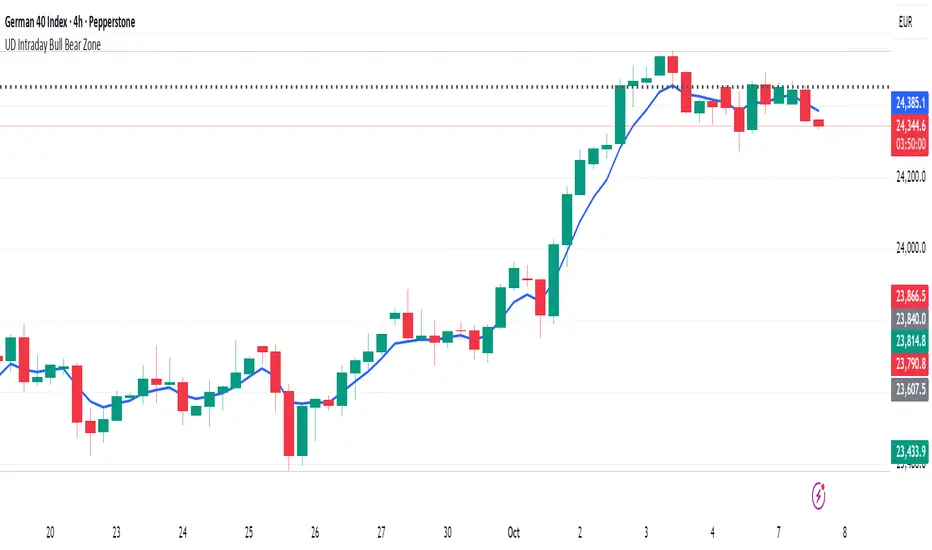
This indicator indicates the use of ema lines to determine the change of directions where:
- 5ema black line indicates small trend shift
- 20ema red line indicates big trend shift
On top of it the circles below the chart shows the momentum to execute where
- green indicates bull trend and cycle
- red indicates red trend and cycle
With the combination of direction and momentum there will be more accuracy in tracking the trend movement of a particular asset
Release Notes
The blue line is the line that indicates the bull bear zone of the intraday movement where candle closing above is entering Bull and Below is entering BearProtected script
This script is published as closed-source. However, you can use it freely and without any limitations – learn more here.
Ups and Downs by Entreuverse
Disclaimer
The information and publications are not meant to be, and do not constitute, financial, investment, trading, or other types of advice or recommendations supplied or endorsed by TradingView. Read more in the Terms of Use.
Protected script
This script is published as closed-source. However, you can use it freely and without any limitations – learn more here.
Ups and Downs by Entreuverse
Disclaimer
The information and publications are not meant to be, and do not constitute, financial, investment, trading, or other types of advice or recommendations supplied or endorsed by TradingView. Read more in the Terms of Use.