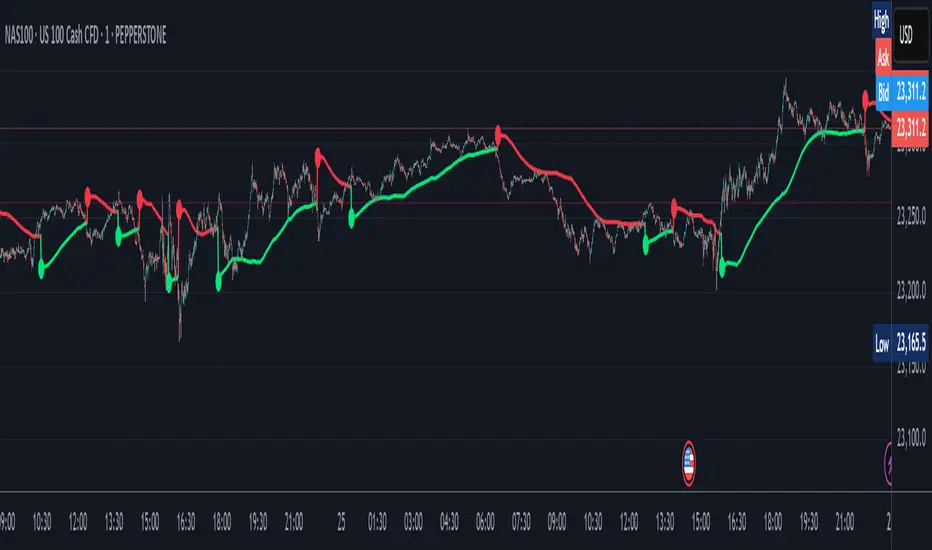
Scalper - Pattern Recognition & Price Action🔍 Introducing the Ultimate Scalping Toolkit for TradingView
📊 “Scalper – Pattern Recognition & Price Action”
💥 Unlock precision trading with one of the most advanced Pine Script indicators ever built!
✅ Key Features:
📌 Multiple Moving Averages (SMA, EMA, HMA, VWMA & more) – fully customizable per timeframe
🔍 Candlestick Pattern Detection – from Engulfing & Doji to Morning/Evening Stars and Three Soldiers/Crows
⚡ Smart Price Action Tools – Fair Value Gaps, Order Blocks, Breakout Zones
🧠 Confluence Engine – Aggregates multi-signal zones for high-probability entries
📉 Dynamic Support & Resistance Lines – auto-detected from historical swing points
📈 RSI & CCI Reversal Zones – spot hidden turning points before the crowd
🎯 Perfect for Scalpers, Day Traders & Pattern Hunters
💡 This is not just another indicator — it's a complete trading assistant that identifies structure, signals strength, and simplifies decision-making.
🚀 Plug it into your TradingView chart today and start seeing the market in a whole new way.
👉 DM us for access : t.me
Moving Averages

Step-OMA with SignalsThe Step-OMA with Signals is a sophisticated trend-following indicator that combines Loxx's Optimized Moving Average (OMA) algorithm with an advanced step function to create a highly responsive yet smooth trend detection system. This indicator excels at identifying trend changes early while minimizing false signals through its adaptive filtering mechanism.
Core Algorithm Components
1. Optimized Moving Average (OMA) Foundation
Based on Loxx's advanced OMA implementation
Uses a 6-stage exponential smoothing process
Incorporates adaptive period calculation based on market noise
Employs Jurik-style smoothing techniques for superior signal quality
2. Step Function Integration
Implements a step-based trend detection mechanism
Uses ATR-based dynamic threshold calculation
Maintains trend consistency through threshold memory
Provides clear trend change identification
3. Adaptive Noise Filtering
Automatically adjusts to market volatility
Calculates optimal averaging periods based on price noise
Reduces false signals in choppy market conditions
Speed (Default: 3.0, Range: -1.5 to unlimited)
This is the most critical parameter affecting indicator behavior:
Positive Speed Values (0 to 10.0+):
Creates faster, more responsive signals
Higher values increase sensitivity to recent price action
Negative Speed Values (-1.5 to -0.1):
Produces smoother, more conservative signals
Reduces noise and false breakouts
Creates delayed but more reliable trend confirmations
Adaptive (Default: True)
When enabled: Automatically adjusts averaging period based on market noise
When disabled: Uses fixed length parameter
Recommendation: Keep enabled for most market conditions
Sensitivity Factor (Default: 3.0)
Controls the threshold distance for trend change detection
Lower values: More frequent signals, higher sensitivity
Higher values: Fewer but more reliable signals
Optimal range: 2.0-5.0 depending on market volatility
Step Size Period (Default: 50)
Determines the ATR calculation period for dynamic thresholds
Affects the indicator's adaptation to volatility changes
Lower values: More reactive to recent volatility
Higher values: More stable threshold calculation
For a trading application, Step-OMA is a suitable base filter to complement other types of signaling indicators (oscillators, momentum indicators).
Disclaimer: This indicator is a technical analysis tool and should be used in conjunction with proper risk management and comprehensive market analysis. Past performance does not guarantee future results.
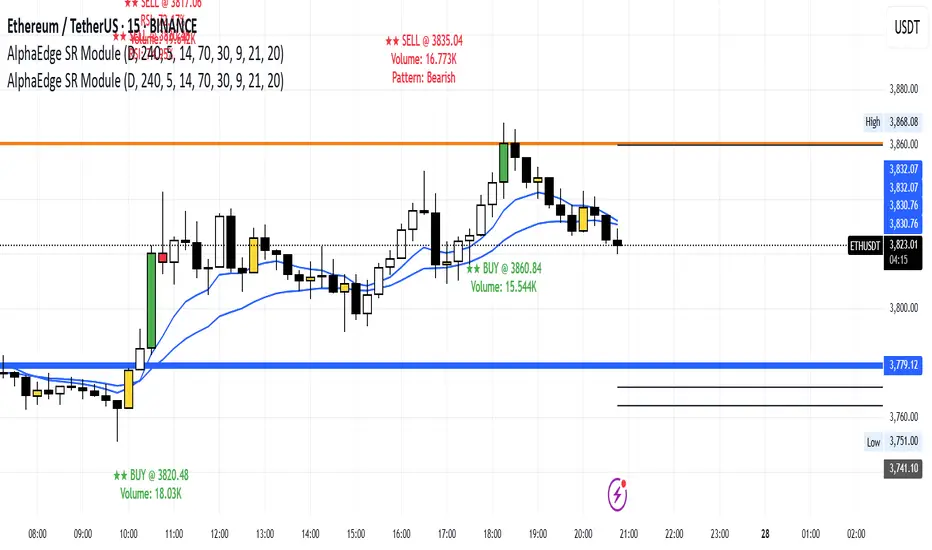
AlphaEdge SR Modulentroducing AlphaEdge SR Module – a powerful tool that combines:
🔹 Clean S/R Zones (Daily & 4H)
🔹 EMA Trend Filters
🔹 RSI OB/OS Highlighting
🔹 Reversal Candle Detection (Engulfing, Pin Bar, Doji)
🔹 Volume Spike Highlighting
🔹 Smart Signal Labels with EMA, RSI, and Volume
Optimized for Gold (XAUUSD), Forex, and Crypto on 1H+ timeframes.
Use it for trend reversals, breakouts, or S/R scalping.
🎯 Public & Free – Search “AlphaEdge SR Module” under Community Scripts.
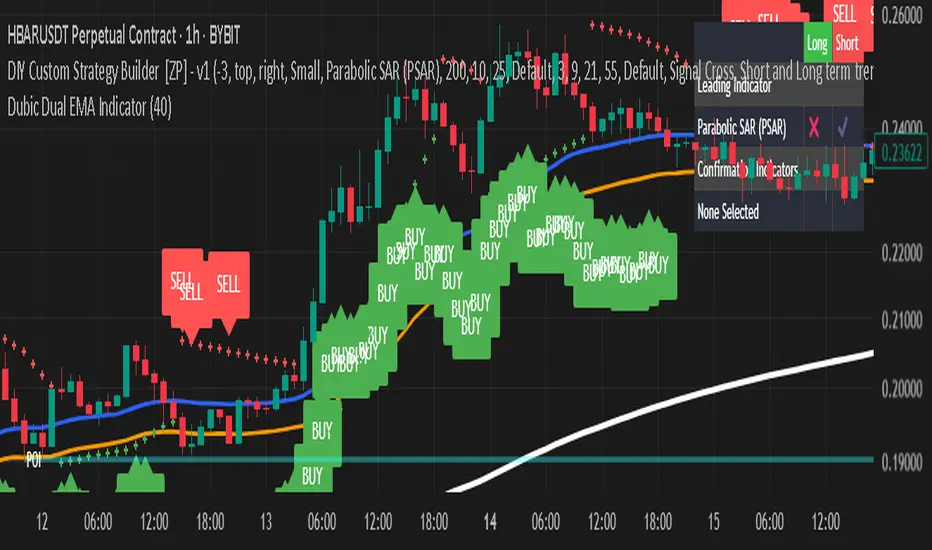
Dubic Dual EMA IndicatorThe Dual EMA Indicator combines two exponential moving averages (EMAs) to identify trend-based buy and sell signals. A buy signal is generated when the price closes above both EMAs suggesting strong bullish momentum. A sell signal appears when the price closes below both EMAs indicating bearish pressure.
MVO - MA Signal StrategyStrategy Description: MA Signal Strategy with Heikin Ashi, Break-even and Trailing Stop
⸻
🔍 Core Concept
This strategy enters long or short trades based on Heikin Ashi candles crossing above or below a moving average (MA), with optional confirmation from the Money Flow Index (MFI). It includes:
• Dynamic stop loss and take profit levels based on ATR
• Optional break-even stop adjustment
• Optional trailing stop activation after breakeven
• Full visual feedback for trades and zones
⸻
⚙️ Indicators Used
• Heikin Ashi Candles: Smooth price action to reduce noise.
• Simple Moving Average (MA): Determines trend direction.
• Average True Range (ATR): Sets volatility-based SL/TP.
• Money Flow Index (MFI): Optional momentum filter for entries.
⸻
📈 Trade Entry Logic
✅ Long Entry:
Triggered if:
• Heikin Ashi close crosses above the MA
or
• MFI is below 20 and Heikin Ashi close is above the MA
❌ Short Entry:
Triggered if:
• Heikin Ashi close crosses below the MA
or
• MFI is above 90 and Heikin Ashi close is below the MA
⸻
🛑 Stop Loss & Take Profit
• SL is set using riskMult * ATR
• TP is set using rewardMult * ATR
Example:
• If ATR = 10, riskMult = 1, rewardMult = 5
→ SL = 10 points, TP = 50 points from entry
⸻
⚖️ Break-even Logic (Optional)
• If price moves in your favor by breakevenTicks * ATR, SL is moved to entry price.
• Enabled via checkbox Enable Break Even.
⸻
📉 Trailing Stop Logic (Optional)
• Once break-even is hit, a trailing stop starts moving behind price by trailATRmult * ATR.
• Trailing stop only activates after break-even is reached.
• Enabled via checkbox Enable Trailing Stop.
📊 Visual Elements
• Heikin Ashi candles are drawn on the main chart.
• Trade zones are shaded between SL and TP during open trades.
• Lines mark Entry, SL, TP, Break-even trigger.
• Markers show entries and exits:
• Green/red triangles = long/short entries
• ✅ = Take profit hit
• ❌ = Stop loss hit
✅ Best Use Case
• Trending markets with strong pullbacks
• Works on multiple timeframes
• Better suited for assets with consistent volatility (ATR behavior)

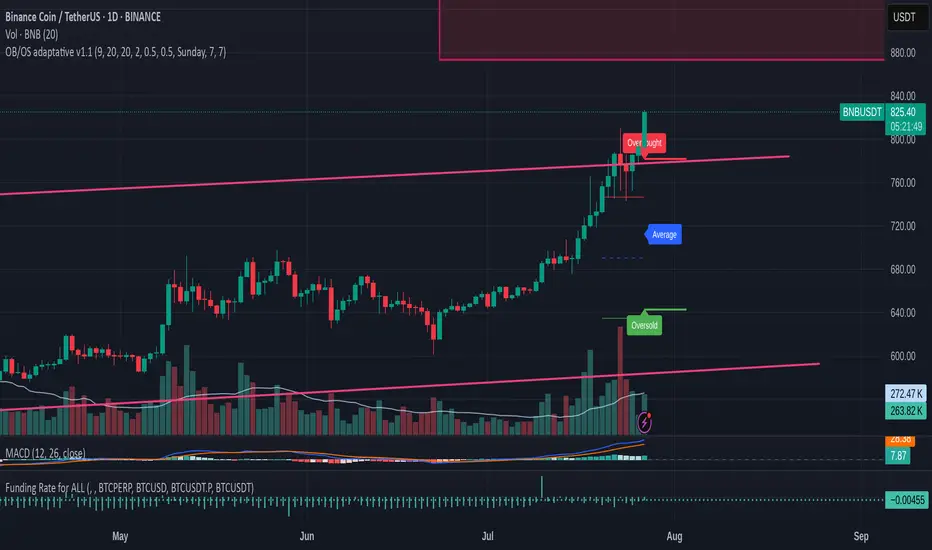
OB/OS adaptative v1.1# OB/OS Adaptative v1.1 - Multi-Timeframe Adaptive Overbought/Oversold Indicator
## Overview
The `tradingview_indicator_emas.pine` script is a sophisticated multi-timeframe indicator designed to identify dynamic overbought and oversold levels in financial markets. It combines EMA (Exponential Moving Average) crossovers and Bollinger Bands across monthly, weekly, and daily timeframes to create adaptive support and resistance levels that adjust to changing market conditions.
## Core Functionality
### Multi-Timeframe Analysis
The indicator analyzes three timeframes simultaneously:
- **Monthly (M)**: Long-term trend identification
- **Weekly (W)**: Intermediate-term trend identification
- **Daily (D)**: Short-term volatility measurement
### Technical Indicators Used
- **EMA 9 and EMA 20**: For trend identification and momentum assessment
- **Bollinger Bands (20-period)**: For volatility measurement and extreme level identification
- **Price action**: For confirmation of level validity and signal generation
## Key Features
### Adaptive Level Calculation
The indicator dynamically determines overbought and oversold levels based on market structure and trend bias:
#### Monthly Level Logic
- **Bullish Bias** (when monthly open > EMA20):
- Oversold = lower of EMA9 or EMA20
- Overbought = upper of EMA9 or Bollinger Upper Band
- **Bearish/Neutral Bias** (when monthly open ≤ EMA20):
- Oversold = Bollinger Lower Band
- Overbought = upper of EMA20 or EMA9
#### Weekly Level Logic
- **Bullish Bias** (when weekly open > EMA20):
- Oversold = lower of EMA9 or EMA20
- Overbought = Bollinger Upper Band
- **Bearish/Neutral Bias** (when weekly open ≤ EMA20):
- Oversold = Bollinger Lower Band
- Overbought = upper of EMA20 or EMA9
#### Daily Level Logic
- Simple Bollinger Bands:
- Oversold = Bollinger Lower Band
- Overbought = Bollinger Upper Band
### Final Level Determination
The indicator combines all three timeframes through a weighted averaging process:
1. Calculates initial values as the average of monthly, weekly, and daily levels
2. Ensures mathematical consistency by enforcing overbought_final ≥ oversold_final using min/max functions
3. Calculates a midpoint average level as the center of the range
### Visual Elements
- **Dynamic Lines**: Draws horizontal lines for current and previous period overbought, oversold, and average levels
- **Labels**: Places clear textual labels at the start of each period
- **Color Coding**:
- Red for overbought levels (resistance)
- Green for oversold levels (support)
- Blue for average levels (pivot point)
- **Transparency**: Previous period lines use semi-transparent colors to distinguish between current and historical levels
### Update Mechanism
- **Calculation Day**: User-defined day of the week (default: Monday)
- On the specified calculation day, the indicator:
- Updates all levels based on previous bar's data
- Draws new lines extending forward for a user-defined number of days
- Maintains previous period lines for comparison and trend analysis
- Automatically deletes and recreates lines to ensure clean visualization
### Proximity Detection
- Alerts when price approaches overbought/oversold levels (configurable distance in percentage)
- Helps identify potential reversal zones before actual crossovers occur
- Distance thresholds are user-configurable for both overbought and oversold conditions
### Alert Conditions
The indicator provides four distinct alert types:
1. **Cross below oversold**: Triggered when price crosses below the oversold level
2. **Cross above overbought**: Triggered when price crosses above the overbought level
3. **Near oversold**: Triggered when price approaches the oversold level within the configured distance
4. **Near overbought**: Triggered when price approaches the overbought level within the configured distance
### Debug Mode
When enabled, displays comprehensive debug information including:
- Current values for all levels (oversold, overbought, average)
- Timeframe-specific calculations and raw data points
- System status information (current day, calculation day, etc.)
- Lines existence and timing information
- Organized in multiple labels at different price levels to avoid overlap
## Configuration Parameters
| Parameter | Default Value | Description |
|---------|---------------|-------------|
| Short EMA (9) | 9 | Length for short-term EMA calculation |
| Long EMA (20) | 20 | Length for long-term EMA calculation |
| BB Length | 20 | Period for Bollinger Bands calculation |
| Std Dev | 2.0 | Standard deviation multiplier for Bollinger Bands |
| Distance to overbought (%) | 0.5 | Percentage threshold for "near overbought" alerts |
| Distance to oversold (%) | 0.5 | Percentage threshold for "near oversold" alerts |
| Calculation day | Monday | Day of week when levels are recalculated |
| Lookback days | 7 | Number of days to extend previous period lines backward |
| Forward days | 7 | Number of days to extend current period lines forward |
| Show Debug Labels | false | Toggle for comprehensive debug information display |
## Trading Applications
### Primary Use Cases
1. **Reversal Trading**: Identify potential reversal zones when price approaches overbought/oversold levels
2. **Trend Confirmation**: Use the adaptive nature of levels to confirm trend strength and direction
3. **Position Sizing**: Adjust position size based on distance from key levels
4. **Stop Placement**: Use opposite levels as dynamic stop-loss references
### Strategic Advantages
- **Adaptive Nature**: Levels adjust to changing market volatility and trend structure
- **Multi-Timeframe Confirmation**: Signals are validated across multiple timeframes
- **Visual Clarity**: Clear color-coded lines and labels enhance decision-making
- **Proactive Alerts**: "Near" conditions provide early warnings before crossovers
## Implementation Details
### Data Security
Uses `request.security()` function to fetch data from higher timeframes (monthly, weekly) while maintaining proper bar indexing with ` ` offset for open prices.
### Performance Optimization
- Uses `var` keyword to declare persistent variables that maintain state across bars
- Efficient line and label management with proper deletion before recreation
- Conditional execution of debug code to minimize performance impact
### Error Handling
- Comprehensive NA (not available) checks throughout the code
- Graceful degradation when data is unavailable for higher timeframes
- Mathematical safeguards to prevent invalid level calculations
## Conclusion
The OB/OS Adaptative v1.1 indicator represents a sophisticated approach to identifying market extremes by combining multiple technical analysis concepts. Its adaptive nature makes it particularly useful in trending markets where static levels may be less effective. The multi-timeframe approach provides a comprehensive view of market structure, while the visual elements and alert system enhance its practical utility for active traders.
Dr. Keith Wade Momentum SignalsThis is a heikin Ashli strategy combined with an 18 moving average crossover. Entry at cross of 18 EMA and exit at change of heikin Ashi

Supertrend Strategy (5m)📊 Strategy: Buy/Sell Based on EMA Crossover (5-Minute Timeframe)
📊 Стратегия: Buy/Sell по пересечению EMA (5 минут)

Moving Average Exponential (Daily Frozen EMA)This script plots an Exponential Moving Average (EMA) based on the daily timeframe, but with a unique twist:
✅ The EMA value is frozen for the entire current daily session, only updating when a new daily candle begins.
🔍 How it works:
The EMA is calculated using the 1-day timeframe, regardless of the chart's current timeframe.
This EMA value remains fixed throughout the day — it doesn't fluctuate intrabar.
It updates only once the daily candle has closed, providing a stable and reliable reference point during the trading day.
The default is the 5 day EMA but can be changed to any EMA timeframe you desire such as 9, 21, 50, 100. 200, etc.
✨ Additional Features:
✅ Optional smoothing with various moving average types (SMA, EMA, WMA, SMMA, VWMA).
✅ Optional Bollinger Bands on top of the smoothed EMA.
✅ Adjustable settings for EMA length, smoothing type, Bollinger Band deviation, and display options.
🛠️ Use Cases:
Ideal for traders who want a non-reactive EMA during intraday trading.
Helps reduce signal noise by anchoring EMA to higher timeframe structure.
Useful for strategy development where EMA should represent confirmed daily bias only.
Hope this helps, happy trading!

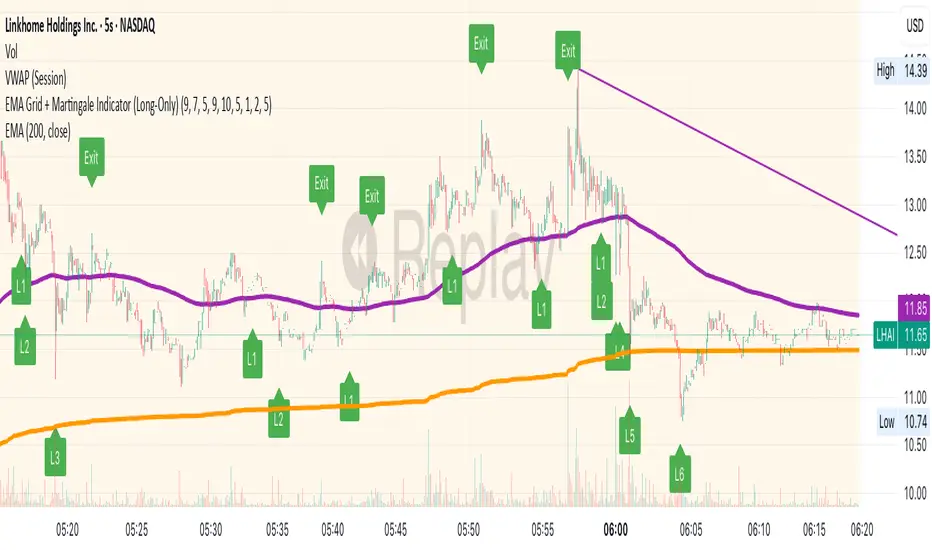
EMA Grid + Martingale Indicator (Long-Only)Title:
EMA Grid + Martingale Indicator (Long-Only)
Short Summary:
A 4-EMA trend filter combined with a grid-based entry system and optional martingale sizing to visualize staged long entries and exits in bullish markets.
Full Description:
This indicator combines a 4-EMA trend filter with a grid-based entry system and optional martingale-style position sizing to help traders visualize staged long entries and exits in trending markets.
How It Works
1. Trend Detection: Uses two sets of EMAs (fast/slow pairs) to confirm bullish momentum. A long signal is generated when both EMA groups align in an uptrend.
2. Grid Entries: After the initial long entry, additional grid levels are triggered every time price drops by the specified grid step (in pips).
3. Martingale Sizing (Optional): Each subsequent entry can increase in size based on the defined martingale factor.
4. Weighted-Average Exit: Calculates the weighted average of all grid entries and signals an exit when the price reaches or surpasses this level plus an optional buffer.
Key Features
• 4 EMA Trend Filter with fully customizable lengths.
• Dynamic grid entries with visual labels (L1, L2, etc.).
• Optional martingale position sizing.
• Weighted-average exit with adjustable buffer.
• Customizable parameters for EMAs, grid steps, max entries, and buffer pips.
• Clear chart visualization of EMAs and entry/exit levels.
Use Cases
• For traders using cost-averaging or grid strategies in bullish markets.
• Visualizes multiple entry levels and profit targets.
• Useful for backtesting and strategy planning.
Note: This indicator is for visualization and planning purposes only. It does not execute trades automatically. It does not guarantee profits and is not financial advice.
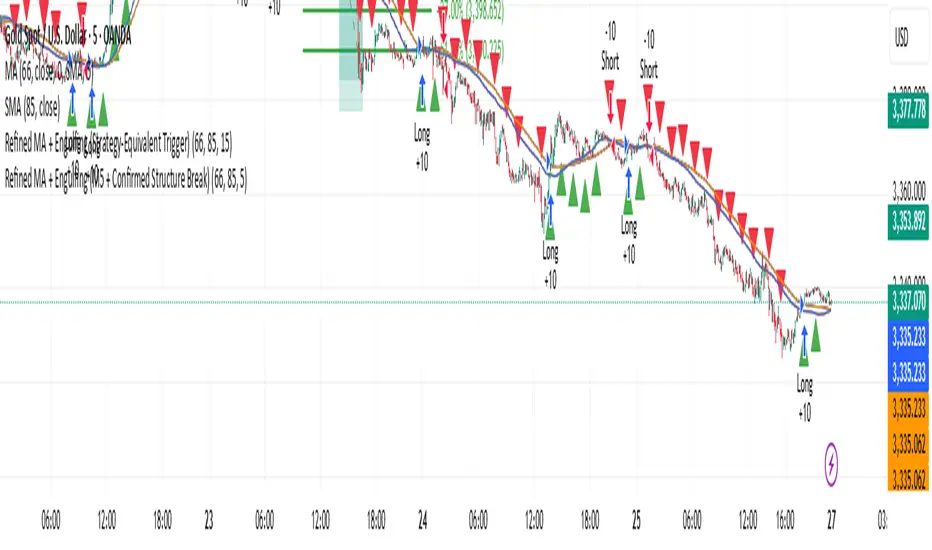
Refined MA + Engulfing (M5 + Confirmed Structure Break)I would like to start by saying that this strategy was put together using ChatGPT, some past trades from myself and some backtested trades, and from my time as a student in Wallstreet Academy under Cue Banks.
I am not profitable yet. I am too jumpy and blow accounts. I'm hoping this strategy (and it's indicator twin) can help me spend less time on the charts, so that I'm not tempted to press buttons as much.
It does fire quite a bit. But, the Strategy Tester tab shows a 30% win rate with our wins being significant to our losses. So, in theory, if you followed the rules of this strategy STRICTLY, you COULD BE profitable.
With that being said, there are times that this strategy has shown to trigger and I ask, "Why?".
I just want to help myself and others, and maybe make some decent\cool stuff along the way. Enjoy
KR

J-Lines Ribbon • 4-Cycle Engine (CHOP / ANTI / LONG / SHORT)📈 J-Lines Ribbon • 4-Cycle Engine (CHOP / ANTI / LONG / SHORT)
Version: Pine Script v6
Author: Thomas Lee
Category: Trend-Following / Mean Reversion / Scalping
Timeframes: Optimized for 1–5m (but adaptable) Seems to work best on Fibb Time
🧠 Strategy Overview:
The J-Lines Ribbon 4-Cycle Engine is a precision trading algorithm designed to navigate complex market microstructure across four adaptive states:
🔁 CHOP (No Trade / Flatten)
🟡 ANTI (Legacy Layer / Under Development)
🟢 LONG (Trend-Continuation & Rebounds)
🔴 SHORT (Inverse Trend-Continuation & Rebounds)
It combines a multi-layer EMA ribbon, ADX-based CHOP detection, and smart pivot analysis to dynamically shift between market modes, entering and exiting trades with surgical precision.
🔍 Core Features:
Dynamic Market Cycle Detection
Auto-classifies each bar into one of the 4 market states using ADX + EMA 72/89 crossovers.
One-Shot Entries & Rebound Logic
Initiates base entries at the start of new trend cycles. Re-entries (ReLong/ReShort) trigger on EMA 72 and EMA 126 pullbacks with momentum resumption.
CHOP State Autopilot
Automatically closes open positions when CHOP begins, preventing sideways market exposure.
Precision Take-Profits & Pivots-Based Stop Losses
Real-time adaptive exits using pivot high/low swing points as dynamic SL/TP anchors.
Customizable Parameters
Pivot length (left/right)
ADX thresholds
Rebound tolerance bands
Ribbon display and state-labels
📊 Indicator Components:
📏 EMA Ribbon: 72, 89, 126, 267, 360, 445
📉 ADX Filter: Filters out sideways noise, confirms directional bias
🔁 Crossover Events: Detects trend initiations
🌀 Cycle Labels: Real-time visual display of current market state
🛠️ Ideal Use Cases:
Scalping volatile markets
Automated strategy testing & optimization
Entry/exit signal confirmation for discretionary traders
Trend filtering in algorithmic stacks
⚠️ Notes:
ANTI cycle logic is scaffolded but not fully deployed in this version. It will be extended in a future release for deep mean-reversion detection.
Tailor ADX floor and pivot sensitivity to your specific asset and timeframe for optimal performance.

Momentum Reversal StrategyBEST USE IN 15MIN TIME FRAME EURUSD / XAUSUD
1. Strategy Overview
This strategy hunts short-term momentum reversals at key levels during high-liquidity sessions.
Timeframes: 5-minute for entries; 15-minute for trend context
Sessions: London for EUR/USD & GBP/USD; New York for XAU/USD
Pairs: EUR/USD, GBP/USD, XAU/USD
Indicators (3 max):
EMA(20) and EMA(50) (close)
MACD (12, 26, 9) histogram
Optional: RSI(14) (for divergence filter)
2. Entry Rules
Trend Filter (15 min):
Long only if EMA20 > EMA50; short only if EMA20 < EMA50.
Price-Action Zone (5 min):
Identify recent swing high/low within past 20 bars.
Draw horizontal support (for longs) or resistance (for shorts).
Indicator Alignment (5 min):
MACD histogram crossing from negative to positive for longs, positive to negative for shorts.
Candle close beyond EMA20 in direction of trade.
Candle Confirmation:
Bullish engulfing or hammer at support for longs; bearish engulfing or shooting star at resistance for shorts.
Entry Execution:
Place market order on candle close that meets all above.
3. Exit Rules
Stop-Loss (SL):
Long: 1.5× ATR(14) below entry candle low.
Short: 1.5× ATR(14) above entry candle high.
Take-Profit (TP):
Set at 2× SL distance (RR 1:2).
Trailing SL:
After price moves 1× SL in profit, trail SL to breakeven.
Partial Booking:
Close 50% at 1× SL (50% of TP), move SL to entry.
Close remaining at full TP.
4. Trade Management
False Signal Filter: Skip trades when RSI(14) > 70 for longs or < 30 for shorts (avoids overbought/oversold extremes).
One Trade at a Time: No multiple positions on same pair.
Session Cutoff: Close any open trade 15 minutes before session end.
5. Risk Parameters
Risk per Trade: 1% of account equity.
Reward Target: ≥2% (1:2 RR) per trade.
Win-Rate Expectancy: ≥75% based on indicator confluence and price-action confirmation.

Time Range Marker By BCB ElevateThe Time Range Marker is a simple yet powerful visual tool for traders who want to focus on specific time intervals within the trading day. This indicator highlights a custom time range on your chart using a background color, helping you visually isolate key trading sessions or event windows such as:
Market open/close hours
News release periods
High-volatility trading zones
Personal strategy testing windows
⚙️ Key Features:
Customizable start and end time (hour & minute)
Works across all intraday timeframes
Adjustable highlight color to match your chart theme
Built using Pine Script v5 for speed and flexibility
🔧 Settings:
Start Hour / Minute – Set the beginning of the time range (in 24-hour format)
End Hour / Minute – Define when the range ends
Highlight Color – Choose the background color for better visibility
🕒 Timezone Note:
The indicator uses UTC time by default to ensure accuracy across markets. If your broker uses a different timezone (like EST, IST, etc.), the script can be adjusted to reflect your local market hours.
✅ How to Use the Time Range Marker Indicator
This indicator is used to visually highlight a specific time window each trading day, such as:
Market open or close sessions (e.g., NYSE, London, Tokyo)
High-impact news release periods
Custom time slots for strategy testing or scalping
🛠️ Installation Steps
Open TradingView and go to any chart.
Click on Pine Editor at the bottom of the screen.
Copy and paste the full Pine Script (shared above) into the editor.
Click the “Add to Chart” ▶️ button.
The indicator will appear on the chart with a highlighted background during the time range you set.
⚙️ How to Customize the Time Range
After adding the indicator:
Click the gear icon ⚙️ next to the indicator’s name on the chart.
Adjust the following settings:
Start Hour / Start Minute: The beginning of your time range (in 24-hour format).
End Hour / End Minute: When the highlight should stop.
Highlight Color: Pick a color and transparency for visual clarity.
Click OK to apply changes.
🕒 Timezone Consideration
By default, the indicator uses UTC (Coordinated Universal Time).
To match your broker’s timezone (e.g., EST, IST, etc.), you'll need to adjust the script by changing:
sessStart = timestamp("Etc/UTC", ...)
sessEnd = timestamp("Etc/UTC", ...)
to your correct timezone, like "Asia/Kolkata" for IST or "America/New_York" for EST.
Let me know your broker or local timezone, and I’ll update it for you.
📈 Tips for Traders
Combine this with volume, price action, or breakout indicators to focus your strategy on high-probability time windows.
Use multiple versions of this script if you want to highlight more than one time range in a day.

Key Indicators Dashboard (KID)📌 Overview
Key Indicators Dashboard (KID) is a comprehensive all-in-one technical analysis tool designed for discretionary, systematic, and quantitative traders. It brings together multiple essential trading metrics into a highly customizable, interactive dashboard that overlays directly on your TradingView chart.
🎯 What Does KID Do?
KID consolidates all vital market metrics into a single, glanceable dashboard—saving screen space and analysis time. Whether you are screening equities or monitoring open positions, the KID panel updates dynamically, highlighting actionable signals and market conditions based on your own thresholds and trading style.
🛠 Key Features
⦿ Volatility and Range Metrics
ADR (Average Daily Range, % and Value): Quantifies average price movement over a defined period, with threshold-based color highlights.
ATR (Average True Range, % and Value): Measures volatility as both value and percentage of price.
⦿ Relative Strength and Trend Metrics
Relative Strength (RS) vs. Benchmark: Dynamically calculated using a customizable comparative symbol (default: NSE:NIFTYMIDSML400).
IBD-style RS Rating: Weighted average of price changes over several periods (3, 6, 9, and 12 months).
Trend Detection: Uses Supertrend indicator to visually identify up/down market trends.
⦿ Liquidity and Volume Analysis
Relative Volume (RVol): Comparison of current volume to moving average volume.
Turnover (in Cr): Average turnover calculation to assess liquidity.
Market Cap & Free Float: Real-time computation using price and outstanding/floating shares.
⦿ Trend Strength and Structure
MA Extensions: Compares price extension from a selected moving average, depicted as ATR multiples and percentages.
Moving Averages (MAs): Choice of EMA/SMA with customizable lengths, including up to four plotted MAs and detection of MA crossovers.
⦿ Breakout and Tightness Detectors
52-Week High/Low: Calculates and optionally marks the highest and lowest prices over 252 trading days, including percentage distance from current price.
Minervini Trend Template: The Trend Template is a set of technical criteria designed to identify stocks in strong uptrends.
• Price > 50-DMA > 150-DMA > 200-DMA
• 200-DMA is trending up for at least 1 month
• Price ≥ 52-week high proximity
• Price is at least 30% above its 52-week low.
• Price is within at least 25 percent of its 52-week high
• Table highlights when a stock meets all above criteria.
Tightness Indicator: Highlights periods with compressed price action relative to historical ranges.
⦿ Candlestick Patterns and Power Bars
Inside Bar Detection: Color- and shape-based highlighting of "inside bars" for pattern traders.
PowerBar (Purple Dot): Flags bars with strong price movement paired with high volume, using ROC and volume thresholds.
⦿ Sector/Industry
Automatically reflects symbol sector and industry if available from trading platform data.
⚙️ Customizable Visualization
Switchable between vertical or horizontal layout.
Works in dark/light mode
User-configurable to toggle any indicator ON or OFF.
User-configurable Moving (EMA/SMA), Period/Lengths and thresholds.
🔔 Built-in Alerts
Supports automatic alert creation for:
ADR%, ATR/ATR %, RS, RS Rating, Turnover
Moving Average Crossover (Bullish/Bearish)
52-Week High/Low
Inside Bars (Bullish/Bearish)
Tightness
Minervini Trend Template
⏳PineScreener Capabilities
The indicator’s alert conditions act as filters for PineScreener.
Available Screener Filters & Alerts:
Price Filters: Minimum and maximum price cutoffs.
Daily Change Filters: Minimum and maximum daily percent move.
Volatility Filters: ADR% and ATR% thresholds met or exceeded.
Liquidity Filters: Minimum average turnover and relative volume cutoffs.
Momentum/Trend Filters:
• Strong RS/RS Rating
• Uptrend/Downtrend state (Supertrend-based)
• Price extensions (detect overbought/oversold situations quickly)
• Breakout proximity via 52-week high/low alerts
Pattern and Setup Detection:
• Minervini Trend Template
• Inside Bar
• Tightness (compressed/volatility contraction setups)
• PowerBar (High ROC + high volume bars)
• MA crossover or above/below specific MAs
⦿ (Optional) : For horizontal table orientation increase Top Margin to 16% in Chart (Canvas) settings to avoid chart overlapping with table.
⚡ Add this script to your chart and start making smarter trade decisions today! 🚀

DI/ADX Trend Strategy | (1-Min Scalping)Strategy Overview
This is an experimental 1-minute trend-following strategy combining DI+/DI-, ADX, RSI, MACD, VWAP, and EMA filters with a time-based exit. It aims to catch strong directional moves while strictly managing risk.
Indicator Components
• DI+/DI- + ADX – Trend direction + strength filter
• RSI (14) – Momentum confirmation (RSI > 55 or < 45)
• MACD Histogram – Detects directional momentum shifts
• Candle Body % Filter – Screens for strong commitment candles
• EMA 600 / 2400 – Long-term trend alignment
• Weekly VWAP – Entry only when price is above/below VWAP
• Trade Limit – Max 2 trades per direction per VWAP cycle
• Time-Based Stop – 0.50% SL, 3.75% TP, 12h (720 bars) time stop
Entry Logic
Long Entry:
• DI+ crosses above DI−
• RSI > 55
• MACD histogram > 0
• Strong bullish candle
• Price > VWAP
• EMA600 > EMA2400
• Within 25 bars of EMA crossover
• Max 2 long trades before VWAP resets
Short Entry:
• DI+ crosses below DI−
• RSI < 45
• MACD histogram < 0
• Strong bearish candle
• Price < VWAP
• EMA2400 > EMA600
• Within 25 bars of EMA crossover
• Max 2 short trades before VWAP resets
Exit Logic
• Stop Loss: 0.50%
• Take Profit: 3.75% (7.5R)
• Time Stop: 720 bars (~12 hours on 1m chart)
• Each trade exits independently
Testing Parameters
• Initial Capital: $10,000
• Commission: 0.10%
• Timeframe: 1-minute
• Tested on: BTCUSDT, ETHUSDT
• Pyramiding: Up to 5 positions allowed
• VWAP resets trade counter to reduce overtrading
Alerts
• Buy / Sell signal
• Trade Opened / Closed
• SL/TP triggered
⚠️ Notes
• Early-stage strategy — entry count varies by trend conditions
• Shared for educational use and community feedback
• Please forward-test before using live
• Open-source — contributions and suggestions welcome!
Disclaimer
This strategy is for educational purposes only and should not be considered financial advice. Past performance does not guarantee future results. Always validate independently before trading live.

Refined MA + Engulfing (Strategy-Equivalent Trigger)I would like to start by saying that this indicator was put together using ChatGPT, some past trades from myself and some backtested trades, and from my time as a student in Wallstreet Academy under Cue Banks.
I am not profitable yet. I am too jumpy and blow accounts. I'm hoping this indicator (and it's strategy twin), with the help of some alerts, can help me spend less time on the charts, so that I'm not tempted to press buttons as much.
It does fire quite a bit. It can be adjusted, I believe, to trigger more or less (open the script, cooldown bars(x) <== change the X to whatever. 5 minute intervals so 1 is 5.
With that being said, there are times that this indicator has shown to trigger and I ask, "Why?".
I just want to help myself and others, and maybe make some decent\cool stuff along the way. Enjoy
KR
Weekly 8 EMA Horizontal Linethis will automatically track the WEEKLY 8EMA on your chart so you can know where the Weekly 8EMA is on lower timeframes
EMA 8/21/50 + VWAP Crossover Alert IndicatorOverview of the Indicator
This is a custom Pine Script v5 indicator for TradingView titled "EMA 8/21/50 + VWAP Crossover Alert Indicator" (short title: "EMA+VWAP Cross Alert"). It's designed as an overlay indicator, meaning it plots directly on your price chart rather than in a separate pane. The primary purpose is to detect and alert on crossovers between the 8-period Exponential Moving Average (EMA) and the 21-period EMA, which can signal potential bullish or bearish momentum shifts. These are classic short-term trend reversal or continuation signals often used in trading strategies like momentum or swing trading.
To enhance analysis, it also includes:
A 50-period EMA for medium-term trend context (e.g., to confirm if the overall trend aligns with the crossover).
A Volume Weighted Average Price (VWAP) line, which provides a benchmark for the average price weighted by volume, useful for identifying intraday value areas or fair price levels.
The indicator works across all timeframes (e.g., Daily, 4H, 1H, 15M, 5M, 3M) because the calculations are based on the chart's current bars and adapt to volatility and data resolution. It's not a trading strategy (no entry/exit logic or backtesting), but an alert tool—signals are visual and can trigger notifications in TradingView. Always combine it with risk management, as crossovers can produce false signals in ranging or choppy markets.

Trading Panel with EMA Crossovers## Trading Panel with EMA Crossovers - Description
**What it does:**
This indicator creates a comprehensive trading dashboard that monitors 6 key technical indicators and displays them in an easy-to-read table at the bottom right of your chart. It analyzes market conditions in real-time and provides clear buy/sell signals based on multiple confirmation factors.
**Key Features:**
1. **EMA Crossover Tracking (7/21 & 50/200)**
- Shows whether fast EMAs are above (CROSSOVER/BULL) or below (CROSSUNDER/BEAR) slow EMAs
- Helps identify trend direction and potential entry/exit points
- The 7/21 catches short-term momentum shifts
- The 50/200 confirms longer-term trend strength
2. **Momentum Indicators**
- **RSI**: Identifies overbought (>70) and oversold (<30) conditions
- **MFI**: Similar to RSI but includes volume, making it more reliable
- **MACD**: Confirms trend direction and momentum shifts
3. **Volume Analysis**
- **OBV (On Balance Volume)**: Shows whether smart money is accumulating or distributing
- Helps confirm if price moves are supported by volume
4. **Overall Signal System**
- Counts bullish vs bearish signals from all indicators
- Provides clear BUY/SELL/STRONG BUY/STRONG SELL recommendations
- When both EMAs align (both bull or both bear), it triggers the strongest signals
**Why it's helpful:**
1. **All-in-One View**: Instead of cluttering your chart with multiple indicators, everything is condensed into one clean table
2. **Multiple Confirmation**: Combines trend (EMAs), momentum (RSI/MFI/MACD), and volume (OBV) for more reliable signals
3. **Visual Clarity**: Color-coded signals (green for bullish, red for bearish) make it easy to assess market conditions at a glance
4. **Reduces False Signals**: By requiring multiple indicators to align, it filters out weak trades
5. **Time-Saving**: No need to check multiple indicators manually - the "OVERALL" row gives you an instant market assessment
**Best Use Cases:**
- Trend following: Enter when overall signal shows BUY/STRONG BUY in an uptrend
- Reversal spotting: Watch for divergences between price and indicators
- Risk management: Avoid trades when signals are mixed or neutral
- Confirmation tool: Use alongside your existing strategy for extra confidence
This indicator is particularly effective for swing traders and position traders who want a quick, comprehensive view of market conditions before making trading decisions.

Liquidity Grab Detector (Stop Hunt Sniper) v2.2📌 Purpose
This indicator detects Stop Hunts (Liquidity Grabs) — false breakouts above/below recent highs or lows — filtered by trend direction, volatility, and volume conditions.
It is designed for scalpers and intraday traders who want to identify high-probability reversal zones.
🧠 How It Works
1. Key Logic
Detects previous swing high / swing low over the Lookback Bars.
Marks a false breakout when price moves beyond the level and closes back inside.
Requires a volume spike on the breakout to confirm liquidity sweep.
2. Trend Filter (EMA 50)
Bullish signals only if price is above EMA 50.
Bearish signals only if price is below EMA 50.
This removes most counter-trend stop hunts.
3. ADX Filter
Signals appear only when ADX < Max ADX (low-trend conditions).
This avoids false signals in strong trending markets.
📈 How to Use
Green Arrows: Bullish stop hunt (potential long entry).
Red Arrows: Bearish stop hunt (potential short entry).
Works best in range conditions, liquidity zones, or near session highs/lows.
Combine with order flow, volume profile, or price action for extra confirmation.
Recommended Timeframes: 1m–15m for scalping; 30m–1h for intraday.
Markets: Crypto, Forex, Indices.
⚙️ Inputs
Lookback Bars — swing detection
Volume Spike Multiplier
EMA Length (trend filter)
Min Retrace — how much price must return inside range
Max ADX — trend filter sensitivity
⚠️ Disclaimer
This script is for educational purposes only and does not constitute financial advice.
Always test thoroughly before live trading.

Smart Price Divergence (MACD Filter) + EMA📌 Purpose
This indicator detects Price Divergences with MACD filtered by a 200 EMA trend condition.
It helps identify high-probability reversal zones aligned with market trend context.
🧠 How It Works
1. MACD Divergence Logic
Bearish Divergence:
Price makes a higher high.
MACD makes a lower high.
Price is above EMA (indicating possible exhaustion in bullish trend).
Bullish Divergence:
Price makes a lower low.
MACD makes a higher low.
Price is below EMA (indicating possible exhaustion in bearish trend).
2. EMA Trend Filter
EMA(200) is used as a directional filter:
Bearish divergences considered above EMA (extended bullish conditions).
Bullish divergences considered below EMA (extended bearish conditions).
3. Visual & Alerts
EMA(200) plotted on chart in orange.
Red triangles for Bearish Divergence.
Green triangles for Bullish Divergence.
Alerts fire for both divergence types.
📈 How to Use
Look for divergence signals as potential reversal alerts.
Combine with support/resistance or price action for confirmation.
EMA ensures signals occur in extended zones, increasing reliability.
Recommended Timeframes: 1h, 4h, D.
Markets: Forex, Crypto, Stocks.
⚙️ Inputs
MACD Fast / Slow / Signal Length
EMA Length (default 200)
⚠️ Disclaimer
This script is for educational purposes only. It does not constitute financial advice.
Always test thoroughly before live trading.

Smart Deviation Trend Bands PRO + MTF Filter📌 Purpose
This indicator combines multi-level Deviation Bands (±1, ±2, ±3 standard deviations from SMA) with a Higher Timeframe (HTF) Trend Filter.
It helps traders identify potential bounce and breakout setups aligned with the dominant market trend.
🧠 How It Works
1. Deviation Bands
SMA(Length) is calculated as the centerline.
Standard deviations (±1, ±2, ±3) define multiple dynamic support and resistance zones.
Outer bands (±3) often mark overextended zones; inner bands (±1, ±2) show active trading areas.
2. HTF Trend Filter
A higher timeframe SMA (HTF SMA) acts as a trend confirmation tool.
Default filter timeframe: 1 Day.
Trend Up: Price > HTF SMA
Trend Down: Price < HTF SMA
3. Entry Signals
Long Signal: Price crosses above lower deviation band (+1) when HTF trend is UP.
Short Signal: Price crosses below upper deviation band (−1) when HTF trend is DOWN.
4. Visuals & Alerts
Bands plotted in red (upper) and green (lower).
Centerline = SMA in blue.
HTF SMA in orange.
Circles on chart mark entry points; alerts trigger automatically.
📈 How to Use
In trending markets: Trade with the HTF direction, using band touches for entries.
In mean-reversion setups: Outer bands can be used to spot potential overbought/oversold zones.
Combine with volume or price action for confirmation.
Recommended Timeframes: 1h, 4h, D.
Markets: Forex, Crypto, Stocks.
⚙️ Inputs
SMA Length
StdDev Multiplier 1 / 2 / 3
HTF Timeframe (default: D1)
⚠️ Disclaimer
This script is for educational purposes only. It does not constitute financial advice.
Always test thoroughly before live trading.
